HAL Id: hal-00303982
https://hal.archives-ouvertes.fr/hal-00303982
Submitted on 20 Feb 2008HAL is a multi-disciplinary open access
archive for the deposit and dissemination of sci-entific research documents, whether they are pub-lished or not. The documents may come from teaching and research institutions in France or abroad, or from public or private research centers.
L’archive ouverte pluridisciplinaire HAL, est destinée au dépôt et à la diffusion de documents scientifiques de niveau recherche, publiés ou non, émanant des établissements d’enseignement et de recherche français ou étrangers, des laboratoires publics ou privés.
Diagnosing recent CO emissions and springtime O3
evolution in East Asia using coordinated ground-based
observations of O3 and CO during the East Asian
Regional Experiment (EAREX) 2005 campaign
H. Tanimoto, Y. Sawa, S. Yonemura, K. Yumimoto, H. Matsueda, I. Uno, T.
Hayasaka, H. Mukai, Y. Tohjima, K. Tsuboi, et al.
To cite this version:
H. Tanimoto, Y. Sawa, S. Yonemura, K. Yumimoto, H. Matsueda, et al.. Diagnosing recent CO emissions and springtime O3 evolution in East Asia using coordinated ground-based observations of O3 and CO during the East Asian Regional Experiment (EAREX) 2005 campaign. Atmospheric Chemistry and Physics Discussions, European Geosciences Union, 2008, 8 (1), pp.3525-3561. �hal-00303982�
ACPD
8, 3525–3561, 2008 EAREX 2005 H. Tanimoto et al. Title Page Abstract Introduction Conclusions References Tables Figures ◭ ◮ ◭ ◮ Back Close Full Screen / EscPrinter-friendly Version Interactive Discussion
EGU
Atmos. Chem. Phys. Discuss., 8, 3525–3561, 2008 www.atmos-chem-phys-discuss.net/8/3525/2008/ © Author(s) 2008. This work is licensed
under a Creative Commons License.
Atmospheric Chemistry and Physics Discussions
Diagnosing recent CO emissions and
springtime O
3
evolution in East Asia
using coordinated ground-based
observations of O
3
and CO during the
East Asian Regional Experiment (EAREX)
2005 campaign
H. Tanimoto1,*, Y. Sawa2, S. Yonemura3, K. Yumimoto4, H. Matsueda2, I. Uno4, T. Hayasaka5, H. Mukai1, Y. Tohjima1, K. Tsuboi6, and L. Zhang7
1
National Institute for Environmental Studies, Tsukuba, Japan
2
Meteorological Research Institute, Tsukuba, Japan
3
National Institute for Agro-Environmental Sciences, Tsukuba, Japan
4
Kyushu University, Fukuoka, Japan
5
Research Institute for Humanity and Nature, Kyoto, Japan
6
Japan Meteorological Agency, Tokyo, Japan
7
Harvard University, Cambridge, MA, USA
*
also at: Harvard University, Cambridge, MA, USA
Received: 6 December 2007 – Accepted: 21 January 2008 – Published: 20 February 2008 Correspondence to: H. Tanimoto ([email protected])
ACPD
8, 3525–3561, 2008 EAREX 2005 H. Tanimoto et al. Title Page Abstract Introduction Conclusions References Tables Figures ◭ ◮ ◭ ◮ Back Close Full Screen / EscPrinter-friendly Version Interactive Discussion
EGU Abstract
Simultaneous ground-based measurements of ozone (O3) and carbon monoxide (CO)
were conducted in March 2005 as part of the East Asian Regional Experiment (EAREX) 2005 under the umbrella of the Atmospheric Brown Clouds (ABC) project. Multiple air quality monitoring networks were integrated by performing intercomparison of
indi-5
vidual calibration standards and measurement techniques to ensure comparability of ambient measurements, along with providing consistently high time-resolution mea-surements of O3and CO at the surface sites in East Asia. Ambient data collected from
eight surface stations were compared with simulation results obtained by a regional chemical transport model to infer recent changes in CO emissions from East Asia. Our
10
inverse estimates of the CO emissions from China up to 2005 suggested an increase of 16% since 2001, in good agreement with the recent MOPITT satellite observations and the bottom-up estimates up to 2006. The O3enhancement relative to CO in
con-tinental pollution plumes traversed in the boundary layer were examined as a function of transport time from the Asian continent to the western Pacific Ocean. Comparison
15
of the observed ∆O3/∆ CO ratios and their modeled spatial distributions suggests an
increase in the ∆ O3/∆ CO ratio due likely to en-route photochemical O3 formation
during eastward transport, confirming that East Asia is an important O3source region
during spring.
1 Introduction
20
East Asia is one of the large source regions of anthropogenic pollutants to the global at-mosphere. Rapidly developing economic growth increases emissions of anthropogenic pollutants from a variety of emission sources including industry, transportation, and power plant sectors. Gaseous pollutants and aerosols emitted from these sources have local and regional, as well as substantial global impacts due to long-range
trans-25
resi-ACPD
8, 3525–3561, 2008 EAREX 2005 H. Tanimoto et al. Title Page Abstract Introduction Conclusions References Tables Figures ◭ ◮ ◭ ◮ Back Close Full Screen / EscPrinter-friendly Version Interactive Discussion
EGU
dential areas can also increase emissions of dust aerosols and nitrogen oxides (NOx). Emissions of air pollutants from East Asia are estimated to have rapidly increased dur-ing the past decades, in contrast to those from Europe and North America, which show decreasing and stabilized trends, respectively (Akimoto, 2003).
Changes in the emissions of pollutants to the atmosphere may have become more
5
dramatic since 2000. Space-based observations of nitrogen dioxides (NO2) from
GOME and SCIAMACHY satellite-borne sensors have revealed a rapid increase of tro-pospheric NO2columns over China since 2000, possibly as a consequence of
increas-ing anthropogenic emissions (Richter et al., 2005). In contrast, bottom-up estimates of NOx emissions inventory show an increase not as large as those obtained from the
10
satellite measurements. Indeed, there are substantial discrepancies in the trend be-tween the satellite NO2 measurements and the bottom-up NOx emissions inventory
(Akimoto et al., 2006). Accurate estimates and prompt updates of the emissions of air pollutants are thus important to assess the resulting impacts on temporal evolu-tion of primary pollutants and secondary species (e.g., photochemical O3formation) in
15
regional and hemispheric background levels.
It is however difficult to accurately follow the temporal variation in the emission field from the bottom-up emission estimates because of their inherent uncertainty and time lag in the update of statistics published by national and/or local governments. Some emission sectors have large temporal variability. For example, carbon monoxide (CO)
20
is primarily emitted by combustion of coal, oil, biofuels, and biomass in various sources including power plants, industries, vehicles, agricultural burning (which has strong sea-sonal variations) and forest fires (which have inter-annual variations). Hence it is chal-lenging to estimate emissions of CO for regions where multiple emission sectors con-tribute to a combined net CO concentration field. To overcome such difficulties,
obser-25
vations of chemical species, either in situ measurements or satellite observations, have been used to provide constraints on the strength and spatial distributions of their emis-sions. Transport and Chemical Evolution over the Pacific (TRACE-P) was conducted, in the spring of 2001, by the National Aeronautical Space Administration (NASA) to
ad-ACPD
8, 3525–3561, 2008 EAREX 2005 H. Tanimoto et al. Title Page Abstract Introduction Conclusions References Tables Figures ◭ ◮ ◭ ◮ Back Close Full Screen / EscPrinter-friendly Version Interactive Discussion
EGU
dress the issue of pollution emissions from Asia, by integrating in situ measurements by aircrafts, satellite observations from space, and chemistry transport models.
Several inversion studies to estimate CO emissions from East Asia during TRACE-P revealed that the CO emission inventory used as a priori emissions for China (Streets et al., 2003a) was significantly underestimated (∼50%) (Palmer et al., 2003; Heald et
5
al., 2004; Wang et al., 2004; Allen et al., 2004; Carmichael et al., 2003). After TRACE-P Streets et al. (2006) improved their a priori CO emissions inventory for China based on the model analysis of CO observed during the TRACE-P campaign. They exam-ined various causes for the large discrepancy between the bottom-up and top-down estimates, and found that the CO emissions from cement kilns, brick kilns, and the iron
10
and steel industry were underestimated. The updated anthropogenic CO emissions from China in 2001 are 142 Tg, 42% higher than the a priori emissions used during TRACE-P in 2000. Since industrial activities and the energy consumption in China are thought to have increased since 2001, great attention is paid to possible changes in the anthropogenic emissions of air pollutants from China, and the resulting impacts on
15
secondary species including photochemical O3formation.
In this paper we mainly focus on the following questions.
– Can we constrain regional sources for CO in 2005 by exploiting multiple surface
observations in an inverse calculation? What is the growth of CO emission from East Asia since 2001?
20
– Can we identify the causes of the observed O3-CO ratio enhancement events? Is
this quantitatively related to the transport timescale of continental pollutants?
– Can the model explain the observed O3-CO correlation well? What are the spatial
patterns of the O3-CO relationship?
We use hourly values of O3and CO simultaneously recorded at eight ground-based
25
stations, and a regional transport model that incorporates the chemistry of these species. A four-dimensional adjoint inverse model developed for East Asia is also used
ACPD
8, 3525–3561, 2008 EAREX 2005 H. Tanimoto et al. Title Page Abstract Introduction Conclusions References Tables Figures ◭ ◮ ◭ ◮ Back Close Full Screen / EscPrinter-friendly Version Interactive Discussion
EGU
to improve CO emissions inventory and to infer the spatial distribution of CO emis-sion over China up to 2005. The growth in the CO emisemis-sion from China since 2001 is discussed with the help of satellite-derived trends and recently updated bottom-up esti-mates. We select, from the observed temporal variations of O3and CO, three pollution events, which were well characterized in terms of meteorological mechanisms and the
5
CO source-receptor relationship in our previous paper (Sawa et al., 2007). We show simulated results of the regional spatial pattern of the boundary layer O3-CO correla-tion, which are often referred to as an indicator of the photochemical O3processing in
continental outflows. Ambient data off the coast of the Asian continent obtained during early spring are suitable for evaluating pollution emissions from the Asian continent,
10
since transport from the upwind source regions to the western North Pacific occurs most effectively during this time of year.
2 Coordinated ground-based observations
2.1 Integration of Networks
The EAREX 2005 campaign was conducted from the end of February to early April
15
2005 as a part of international intercomparison experiments. Measurements of CO and O3were undertaken with collaboration of four Asian research groups from Japan,
Korea, Hong Kong and Taiwan. During the campaign, we observed CO and O3mixing ratios at Gosan station (33◦17′N, 126◦10′E) located at Jeju Island in Korea. The Gosan station is one of the UNEP/ABC supersites operated by the Meteorological Research
20
Institute (METRI) of the Korea Meteorological Administration (KMA). Results from the intercomparison experiment in the EAREX 2005 showed that the ambient air measure-ments of CO and O3 from the different research groups at Gosan agreed with each
other fairly well (Tanimoto et al., 2007a, b). In order to investigate the spatio-temporal variations of CO and O3, the data obtained at seven Japanese stations were compared
25
ACPD
8, 3525–3561, 2008 EAREX 2005 H. Tanimoto et al. Title Page Abstract Introduction Conclusions References Tables Figures ◭ ◮ ◭ ◮ Back Close Full Screen / EscPrinter-friendly Version Interactive Discussion
EGU
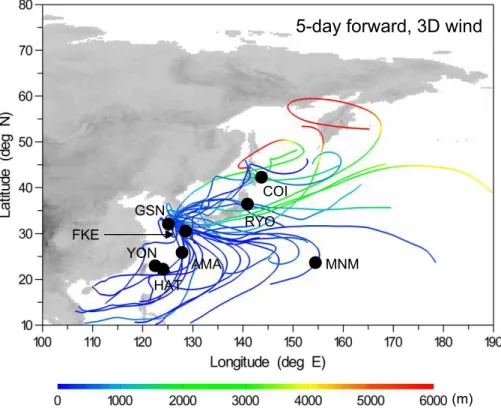
Figure 1 shows the geographical distribution of all the stations used in the present study. The stations are suitably distributed for characterizing the spreading air pollution from the Asian continent over the western North Pacific region between 43◦N to 24◦N. All these 8 surface stations are located generally in rural to remote regions where influences of local emissions are negligible.
5
The Fukuejima station (32◦45′N, 128◦41′E) located west of Japan is closest to the Gosan station, while the Amami-Oshima station (28◦26′N, 129◦41′E) is located to the south of Gosan. At these two island stations, CO and O3 measurements were col-laboratively performed by NIAES, the Research Institute for Humanity and Nature (RIHN), and the Center for Climate System Research (CCSR) under the aerosol
10
research programs of SKYNET and the National Institute for Environmental Stud-ies (NIES) LidarNet. The Japan Meteorological Agency (JMA) has been monitor-ing CO, O3 and other trace gases at Yonagunijima (24◦28′N, 123◦01′E),
Minami-torishima (24◦17′N, 153◦39′E), and Ryori (39◦02′N, 141◦49′E) for the Global
Atmo-sphere Watch programme of the World Meteorological Organization (WMO/GAW).
Mi-15
namitorishima is located the farthest from the Asian continent (about 2000 km south-east of Tokyo). The observational data at these JMA stations are available on the web site of the World Data Center for Greenhouse Gases (WDCGG) operated by JMA (http://gaw.kishou.go.jp/wdcgg.html). Trace gas measurements at Cape Ochi-ishi (43◦09′N, 145◦30′E) and Hateruma (24◦3′N, 123◦48′E), which are located at the
north-20
ernmost and southernmost positions in the network, respectively, are conducted by NIES for the Center for Global Environmental Research (CGER) monitoring program (e.g., Tohjima et al., 2002).
Also shown in Fig. 1 are the 5-day forward trajectories starting from 1000 m at Gosan during the observation period in March 2005. Forward trajectories from Gosan are
25
widely scattered from north to south. Northward trajectories are generally confined to the 2 to 5 km altitude layer, with some reaching Kamchatka Peninsula and even Aleu-tian Islands after passing over Ryori and Cape Ochi-ishi stations. Nearly all of the southward trajectories traverse within the bottom 1-km layer of the troposphere,
pass-ACPD
8, 3525–3561, 2008 EAREX 2005 H. Tanimoto et al. Title Page Abstract Introduction Conclusions References Tables Figures ◭ ◮ ◭ ◮ Back Close Full Screen / EscPrinter-friendly Version Interactive Discussion
EGU
ing over Fukuejima, Amami-Oshima, Yonagunijima, and Hateruma, with some reaching Southeast Asia including Philippine Islands. For eastward transport, many trajectories stay within the bottom 1-km layer, some reaching Minamitorishima during the 5-day transport. These transport patterns portray Gosan as one of the “export windows” of the continental pollution outflow to the western North Pacific Rim (Wong et al., 2007),
5
and thus enabling us to interpret temporal variations of O3and CO observed at other
stations downwind in terms of ambient measurements made at Gosan. It is important to keep in mind that the northbound transport occurs often in the free troposphere, while much of the southbound and eastbound transport takes place within the marine boundary layer. We will see in the following sections how this spatial difference in the
10
transport pattern is reflected in the observed temporal variations of O3and CO at each station.
2.2 Instruments and data comparability
CO mixing ratios at Gosan were measured using a non-dispersive infrared analyzer (NDIR, APMA-360 model, Horiba Co. Ltd., Japan). The NDIR analyzer was regularly
15
calibrated using a CO-free air and CO standard gas with a mixing ratio of about 1 ppmv. The CO-free air was produced by passing ambient air through a catalytic oxidation column packed with Sofnocat (514, Molecular Products Ltd., UK) to completely remove CO in the sample air. Overall uncertainty of the NDIR system was estimated to be less than 20 ppbv. Measurements of CO at Fukuejima and Amami-Oshima stations
20
were made by the gas filter correlation method (GFC) using commercially available CO analyzers (model 48C, Thermo Electron Inc., USA) combined with zero-air generators of CO-free air (model 111, Thermo Electron Inc., USA). The GFC analyzers at both stations were regularly calibrated using one CO standard gas of about 1 ppmv. The overall uncertainty of the GFC method was estimated to be about 10 ppbv based on
25
the comparison with the GC/HgO method at NIAES. NDIR analyzers (GA-360S model, Horiba Co. Ltd., Japan) were deployed by JMA for CO measurements at their three WMO/GAW stations (Watanabe et al., 2000). At Cape Ochi-ishi and Hateruma, the CO
ACPD
8, 3525–3561, 2008 EAREX 2005 H. Tanimoto et al. Title Page Abstract Introduction Conclusions References Tables Figures ◭ ◮ ◭ ◮ Back Close Full Screen / EscPrinter-friendly Version Interactive Discussion
EGU
data were obtained by the GC/HgO (RGD2, Trace Analytical Co. Ltd., USA) method, primarily based on the NIES calibration scale derived from gravimetric CO standard gases.
Measurements of O3 at these eight stations were basically based on the identical principle. Ultraviolet absorption analyzers, which are commercially available from
vari-5
ous manufactures, were deployed. At Gosan, Cape Ochi-ishi, and Hateruma a single-cell instruments (1150 model, Dylec Co. Ltd., Japan) were used. Similar instruments (1006AHJ model, Dasibi Co. Ltd., USA) were used at Fukuejima and Amami-Oshima. For Yonagunijima, Minamitorishima, and Ryori, JMA deployed ozone analyzers from a different manufacture (EG2001F model, Ebara Jitsugyo Co., Ltd., Japan). All of these
10
instruments require a sample airflow of about 1.5 L/min. Correction for temperature and pressure was applied. The overall uncertainty was typically about 1%.
Since the ambient data used in this study were obtained with instruments and cali-bration scales independently maintained by various individual groups, we made inter-comparison of standards for different trace gases. Details of the interinter-comparison
activ-15
ities are found elsewhere (Tanimoto et al., 2007a, b). Briefly, we used the gravimetric scale maintained by MRI as our primary reference. The CO gas standards at Gosan were calibrated before and after the observations using 5 gravimetric standard gases prepared as a MRI primary scale (Matsueda et al., 1998). The MRI primary standard scale used at Gosan station was applied to the gas standards used at Fukuejima and
20
Amami-Oshima in order to produce a consistent dataset. A previous intercomparison of ambient CO measurements between JMA and MRI showed a systematic difference of about 10 ppbv mainly due to the standard gas scale. Since this difference was rel-atively small compared to the large analytical error resulting from the NDIR method, CO values from the JMA system were not corrected. We concluded that the hourly CO
25
data from all of the stations used in this study were comparable and consistent to within an overall uncertainty of about 20–30 ppbv. Although a direct intercomparison between MRI and the National Oceanic and Atmospheric Administration/Global Monitoring Di-vision (NOAA/GMD, former NOAA/CMDL) has not been performed, an audit for CO
ACPD
8, 3525–3561, 2008 EAREX 2005 H. Tanimoto et al. Title Page Abstract Introduction Conclusions References Tables Figures ◭ ◮ ◭ ◮ Back Close Full Screen / EscPrinter-friendly Version Interactive Discussion
EGU
measurements at the JMA stations made by the Swiss Federal Laboratories for Ma-terials Testing and Research (EMPA) in the framework of the WMO/GAW programme suggested good agreement between the JMA and EMPA standards (Zellweger et al., 2005). Since gas standards used by EMPA are traceable to NOAA/GMD, these results indirectly suggest reasonable consistency between the MRI and NOAA/GMD scales.
5
For O3, the Standard Reference Photometer (SRP) built by the National Institute of
Standards and Technology (NIST) and maintained by NIES was used as a reference (Tanimoto et al., 2006). The O3 monitors at Gosan, Cape Ochi-ishi, and Hateruma
were directly calibrated by SRP at NIES, and those at Fukuejima and Amami-Oshima were calibrated by means of a secondary standard. Quality assurance and quality
10
control for the O3 instruments operated at the JMA stations were periodically made under the umbrella of WMO/GAW programme. These instruments are referenced to the same type of SRP built by NIST.
3 Regional chemistry transport models
3.1 Forward modeling
15
A three-dimensional regional-scale chemistry transport model (CTM) used in this study has been developed jointly by Kyushu University and NIES (Tanimoto et al., 2005; Uno et al., 2007) and is based on the Models-3 Community Multi-scale Air Quality (CMAQ) modeling system released by the United States-Environmental Protection Agency. In the present study, the model was driven by meteorological fields generated by the
Re-20
gional Atmospheric Modeling System (RAMS). The horizontal and vertical resolutions were fixed to 80 km and 14 layers (up to 23 km), respectively. The SAPRC-99 scheme was applied for gas-phase chemistry. A global chemistry transport model was used to generate 2002 monthly averaged lateral boundary conditions for CMAQ (Tanimoto et al., 2005).
25
ACPD
8, 3525–3561, 2008 EAREX 2005 H. Tanimoto et al. Title Page Abstract Introduction Conclusions References Tables Figures ◭ ◮ ◭ ◮ Back Close Full Screen / EscPrinter-friendly Version Interactive Discussion
EGU
Emission inventory in Asia (REAS) (version 1.1) for the period 2003 (Ohara et al., 2007). Emissions of sulfur dioxides (SO2), NOx, CO, non-methane volatile organic
compounds (NMVOC), black carbon (BC), and organic carbon (OC) from fuel combus-tion and industrial sources were implemented. Biomass burning sources developed by Streets et al. (2003a, b) were used for the CMAQ simulation.
5
3.2 Adjoint inverse modeling
In this study, RAMS/CTM-4DVAR (Yumimoto and Uno, 2006; Yumimoto et al., 2007) was employed for an inverse modeling of CO emissions. RAMS/CTM-4DVAR is built on a meso-scale meteorological model RAMS (version 4.3, Pielke et al., 1992) using its optional scalar transport options. The 4DVAR system consists of a forward CTM, its
10
adjoint model, and an optimization process. Details of the method have been presented in Yumimoto and Uno (2006), so we only describe aspects of the method relevant to this study.
The model domain was centered at 25◦N and 115◦E on a rotated polar stereo-graphics system encompassing East Asia (see Fig. 5), with a horizontal resolution
15
of 80 km and 23 vertical levels (the top level is 23 km; stretching from 150 m at the surface to 1800 m at the top). The a priori gridded CO emission inventory was based on Streets et al. (2003a) for 2000, which extended throughout East and Southeast Asia (emissions over Russia were not included) and was evaluated as monthly values with 1◦×1◦resolution.
20
The assimilation period was from 4 March to 10 April 2005. We used ground-based observations measured from 11 March to 10 April 2005 at 6 observational sites (Gosan, Ryori, Fukuejima, Amami-Oshima, Yonagunijima, and Hateruma, see Fig. 1) to assimi-late CO mixing ratios and optimize monthly CO emission over East Asia. Observations at Cape Ochi-ishi were used for independent validations. For the lateral boundary
con-25
dition of the model domain, simple constant CO boundary inflows (130 ppbv for the northerly inflow, 80 ppbv for the southerly inflow, 90 ppbv for the westerly inflow, and 90 ppbv for the easterly inflow) were used.
ACPD
8, 3525–3561, 2008 EAREX 2005 H. Tanimoto et al. Title Page Abstract Introduction Conclusions References Tables Figures ◭ ◮ ◭ ◮ Back Close Full Screen / EscPrinter-friendly Version Interactive Discussion
EGU
4 Observed and modeled O3and CO
4.1 Observed pollution episodes
Short-term temporal variations of O3 and CO observed at all the 8 stations in
March 2005 are shown in Fig. 2. Enhanced CO mixing rations were often observed at Gosan, with some large sharp peaks exceeding 500 ppbv. In addition, a number of
5
small CO peaks were also found. The overall CO variability was large, likely reflect-ing the downwind location of Gosan from the industrial source regions of the Asian continent. Remarkably, some of these large CO peaks were still observable, with very little change in shape and magnitude, at Japanese stations located in regions relatively close to Gosan (i.e., Fukuejima, Amami-Oshima, Yonagunijima, and Hateruma). At
10
Minamitorishima, located more than 2000 km off the Asian continent, the CO measure-ments were characteristically different (with smoother background and smaller anoma-lies) from those observed at stations upwind (i.e., Gosan, Fukuejima, Amami-Oshima, Yonagunijima, and Hateruma). At two stations located in northern Japan (Ryori and Cape Ochi-ishi), we observed relatively smooth background CO interrupted by a few
15
small anomalies. For O3, all the stations showed characteristic variations in time, with
some of the positive anomalies corresponding well to high CO episodes. The en-hancements of O3 concentration relative to CO were small at Gosan and Fukuejima, likely due to high variability in the O3 levels caused by mixing of different polluted air
masses. Increased O3concentration events were more identifiable at Amami-Oshima,
20
Yonagunijima, and Hateruma stations. Although the positively anomalous peaks be-came broader at Minamitorishima, corresponding episodes in O3 and CO were still
observable at the station.
Here we focus on three events observed at Gosan: Event I (DOY 69–71: 10– 12 March), Event II (DOY 76–78: 17–19 March), and Event III (DOY 81–83: 22–
25
24 March), and explore the evolution of the pollution plumes associated with these events as they were transported within the marine boundary layer to the western North Pacific (DOY=Day of the Year). We chose these 3 events for a detailed
examina-ACPD
8, 3525–3561, 2008 EAREX 2005 H. Tanimoto et al. Title Page Abstract Introduction Conclusions References Tables Figures ◭ ◮ ◭ ◮ Back Close Full Screen / EscPrinter-friendly Version Interactive Discussion
EGU
tion because the pollution episodes associated with these events retained relatively clear signature during their propagation to stations downwind. Furthermore, transport mechanisms triggered by cold fronts for these episodes were well analyzed with a three-dimensional global transport model in our previous paper (Sawa et al., 2007).
In Sawa et al. (2007), synoptic weather conditions and transport mechanisms of
pol-5
luted air masses from the Asian continent to the western Pacific Ocean were analyzed by utilizing CO as a tracer. They found that the positive CO anomalies of these events identified above were brought about by the passages of cold fronts associated with eastward migrating cyclonic developments. The polluted air masses exported from the continent were trapped behind the cold fronts and then merged into elongated belts of
10
enriched CO before spreading over the western North Pacific. Using a global trans-port model, they were also able to demonstrate that episodic increase in CO observed at Minamitorishima was caused by a long-range transport of pollutants emitted from various regions of East Asia (e.g., China, Korea, Taiwan, Japan).
The episodic events of CO increase observed during 25–27 March (DOY 84–86) and
15
31 March–2 April (DOY 90–92) at Gosan are not discussed in this paper since these events were not well characterized by our previous analysis. This was because these episodic events were not clearly identifiable at Minamitorishima, likely due to some complicated transport mechanisms not well represented in the transport model. Fur-thermore, peak amplitudes of O3 enhancement associated with these two events
ob-20
served at Gosan and Fukuejima were different from those observed at Amami-Oshima, Yonagunijima, and Hateruma; this difference was not well reproduced by our regional model, likely due to some unknown local sources.
We examined how the O3-CO relationship evolved in continental pollution plumes from the Asian continent. The transport time from the Asian continent to the several
25
stations in the western North Pacific Rim were approximated by the observed time lags associated with advection of the CO peaks (associated with Events I to III) from Gosan to Fukuejima (1–5 h), to Amami-Oshima (9–11 h), and to Yonagunijima/Hateruma (11– 14 h). Comparatively, it took on average 60–102 h for a pollution event to travel from
ACPD
8, 3525–3561, 2008 EAREX 2005 H. Tanimoto et al. Title Page Abstract Introduction Conclusions References Tables Figures ◭ ◮ ◭ ◮ Back Close Full Screen / EscPrinter-friendly Version Interactive Discussion
EGU
Gosan to Minamitorishima. It should be noted that these pollution events (Events I, II and III) were not clearly observed at the Ryori and Cape Ochi-ishi stations. Some plumes from the Asian continent do reach Ryori and Cape Ochi-ishi, but are affected by Japanese sources en route, and mixed influences from these sources have made clear and comparative analysis difficult, as noted in Sawa et al. (2007).
5
4.2 Model simulation
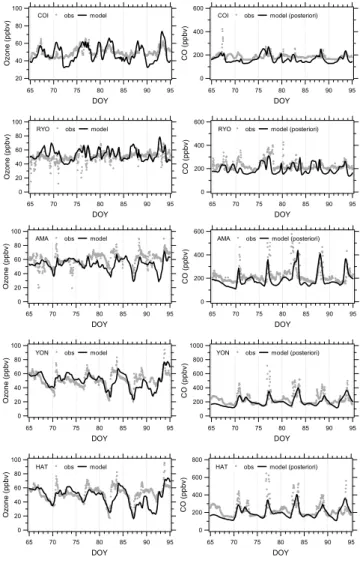
Figure 3 shows comparison of observed and modeled short-term temporal variations of O3and CO for March 2005. The modeled temporal variations for CO were assimilated by the 4-dimensional adjoint inversion. In general, the levels and variations of O3
observed at all stations were well simulated by the model. Observed CO values were
10
also reasonably well simulated with improved CO emissions inventory constrained by the observations obtained in this study. It is well known that the continental air masses from East Asia are often transported by synoptic-scale weather systems. The timing of large episodic spikes in CO observed at Amami-Oshima, Yonagunijima, and Hateruma was in particular well reproduced, along with the corresponding increase in O3.
15
Scatter plots of observed versus modeled mixing ratios of O3 and CO at 7 stations
are shown in Fig. 4. The agreement of the observed and modeled data for O3 is generally good in the range from 20 to 100 ppbv. A linear regression based on the reduced-major-axis (RMA) regression method gives a slope of 0.91±0.02 and a near-zero intercept of 3.3±1.0 ppbv for O3. For CO, assimilated CO mixing ratios provide a
20
relatively good correlation, with an overall slope of 0.85±0.03 and a near-zero intercept of 3.4±3.8 ppbv in the range of 150 to 600 ppbv. It should be noted that the model underestimated the observations in the high-CO regime, and overestimated in the low-CO regime, even after assimilations by the 4-dimensional adjoint inversion. This feature is consistent with the poor reproducibility of amplitude of the high pollution episodes
25
shown in Fig. 3. The poor reproducibility at the high and low mixing ratios was likely due to problems associated with the horizontal resolution and the lateral boundary conditions employed in the model.
ACPD
8, 3525–3561, 2008 EAREX 2005 H. Tanimoto et al. Title Page Abstract Introduction Conclusions References Tables Figures ◭ ◮ ◭ ◮ Back Close Full Screen / EscPrinter-friendly Version Interactive Discussion
EGU
5 Recent CO emissions from East Asia
5.1 A posteriori CO emissions in 2005
By using continuous observations at several surface sites as constrains for East Asian CO emissions, we estimated CO emissions from East Asia for 2005. The spatial dis-tribution of a posteriori CO emissions for 2005 inferred from the 4-dimensional adjoint
5
inversion is shown in Fig. 5. Two regions clearly show strong emissions of CO. One of the regions is located along the Chinese coastal zone from Beijing to Shanghai, and the other region is situated in the southeastern Asia around Thailand. Although the CO emissions from the southeastern Asia were stronger than those from China in 2005, the differences between a priori and a posteriori emissions are very small over
10
the region. By contrast, the coastal zone in China, which is often called the Eastern Central China (ECC), exhibits areas of notable differences between a priori and a pos-teriori emissions, suggesting an increase in the CO emission from this region. Major emission sources are apparently Beijing and Shanghai, and these two mega-cities are significant contributors to that increase, as will be discussed below.
15
5.2 Growth in Chinese CO emissions
Our inverse-model based estimates, along with the recent estimates for Chinese CO emissions by various methods, are summarized in Table 1. Two types of bottom-up estimates are available since the year 2000. As already mentioned, Streets et al. (2006) have recently updated their previous estimates (Streets et al., 2003a) for
20
Chinese anthropogenic emissions to 142 Tg, resulting in a total emission (including biomass burning) of 158 Tg for the year 2001. More recently, Ohara et al. (2007) es-timated the anthropogenic emission from China to be 137 Tg for 2000 and 158 Tg for 2003. Streets and coworkers developed an emission inventory for the INTEX-B campaign, and they estimated the Chinese anthropogenic emission for the year
25
ACPD
8, 3525–3561, 2008 EAREX 2005 H. Tanimoto et al. Title Page Abstract Introduction Conclusions References Tables Figures ◭ ◮ ◭ ◮ Back Close Full Screen / EscPrinter-friendly Version Interactive Discussion
EGU http://www.cgrer.uiowa.edu/EMISSION DATA new/index 16.html).
In this study, our adjoint inversion method calculated 170 Tg as the Chinese anthro-pogenic emission for the year 2005. Combined with the previous estimates by the same inversion method for the year 2001 (Yumimoto and Uno, 2006), we obtain an increase of 16% in the CO emission over the 5-year period (2001–2005). This is in
5
a reasonable agreement with the estimate of 18% (2001–2006) calculated by Streets and Zhang (2007), and 15% (2000–2003) by Ohara et al. (2007).
It should be noted that the previous top-down estimates of the CO emission from China showed substantial variability among the estimates, even for the same target year. This may result from differences in (1) observational data used to constrain
emis-10
sions (e.g., locations, period, altitude, etc), (2) inversion techniques, (3) model types (e.g., resolution, meteorology, chemical schemes, etc.), and (4) resolution of emissions data. Understanding the uncertainties arising from the different inversion approaches constitute a key issue in the assessment of the estimate accuracy, and will be ad-dressed in future studies.
15
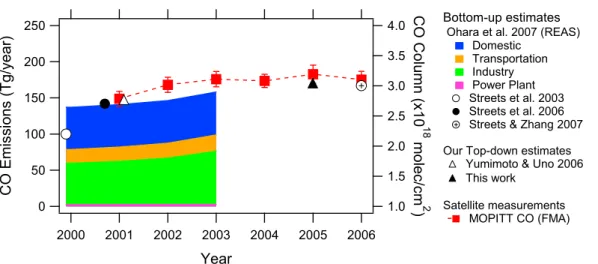
Figure 6 illustrates inter-annual variation in the annual CO emission from China esti-mated by our inversion technique for the year 2001 and 2005, as well as by the bottom-up methods, along with the CO column over ECC (30–45◦N, 113–125◦E) derived from the MOPITT (Measurements Of Pollution In The Troposphere) measurements. The MOPITT data were averaged only from austral winter to early spring (February–April),
20
since the ECC region in this period is not affected by maritime air masses, which bring low-levels of CO in the lower troposphere over the region.
The REAS-based total emissions were further deconvoluted into contributions from domestic use, transportation, industry, and power plants for the period 2000 to 2003. CO emissions from the power plants were estimated to be very low since the
com-25
bustion efficiency of power plants are usually high. Industrial and domestic usages were the two biggest anthropogenic emission sources, having almost equal contribu-tion of 58±1 Tg/year in 2000–2001. While the domestic contribucontribu-tion remained relatively steady, emissions from the industrial sector increased since 2002, reaching 73 Tg in
ACPD
8, 3525–3561, 2008 EAREX 2005 H. Tanimoto et al. Title Page Abstract Introduction Conclusions References Tables Figures ◭ ◮ ◭ ◮ Back Close Full Screen / EscPrinter-friendly Version Interactive Discussion
EGU
2003. This increase contributed a dominant portion of about 76% (16 Tg out of the total of 21 Tg) to the overall change in the CO emission since 2000. The increase in the CO emission from the industrial sector was due mainly to increased emissions from iron and steel factories. The transportation sector (mainly automobiles) contributed about 3 Tg to the overall change due to an increase in traffic.
5
The MOPITT-derived CO columns over the ECC region showed a gradually increas-ing trend from 2001 to 2006 with a slight inter-annual variation, indicatincreas-ing a 15% in-crease from 2001 to 2005. This result is in general agreement with the relative ten-dency of CO emissions estimated by the two bottom-up and our top-down approaches. The relatively small increase in the CO emission from China is in great contrast to the
10
NOx emission, which shows a dramatic increase in recent years since 2000 (Ohara et al., 2007). While the domestic sector had the largest contribution in the 1990’s, its contribution has been reduced as a result of the recent shift in energy usage for resi-dential fuels, from biofuels and hard coal to cleaner energy such as oil and electricity. Compared to the early 1990’s when the contribution from the domestic usage was at
15
a maximum (∼75 Tg/year), its contribution decreased by 20% in 2003. This reduction provides a significant offset to the recent growth in the industrial CO emission, resulting in a relatively small growth in the total CO emission since 2000.
6 Evolution of O3in continental outflow
6.1 Observed O3-CO correlation
20
The relative enhancement of O3 to CO (the ∆O3/∆CO ratio) is often used as a
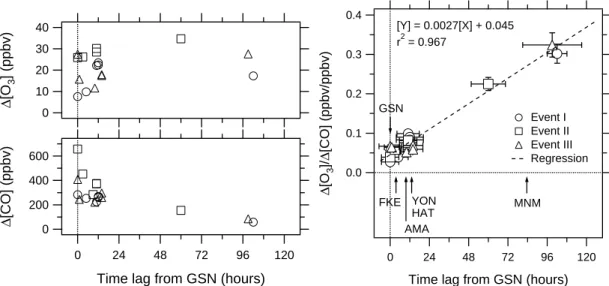
di-agnostic variable to evaluate photochemical O3 formation in air masses and pollution episodes over a period of time that may extend to months. Figure 7 shows the ab-solute enhancements in O3(∆O3) and CO (∆CO), as well as the ∆O3/∆CO ratios as
a function of transport time from the Asian continent to the downwind stations for the
25
ACPD
8, 3525–3561, 2008 EAREX 2005 H. Tanimoto et al. Title Page Abstract Introduction Conclusions References Tables Figures ◭ ◮ ◭ ◮ Back Close Full Screen / EscPrinter-friendly Version Interactive Discussion
EGU
from the Asian continent was approximated by the time each enhanced CO episode ob-served at Gosan took to reach the stations downwind. As already mentioned above, the high episodes observed at Ryori and Cape Ochi-ishi were mainly caused by polluted air masses contaminated by the Japanese sources, and hence the time lag approach referenced to Gosan was not applicable to these sites. Also polluted air masses
trans-5
ported from Gosan to northern Japan often traversed in the free troposphere, resulting in a very little correlational relationship between the measurements at Gosan and the surface air quality at Ryori and Cape Ochi-ishi.
The magnitude of enhanced CO peak measured at any one of the Japanese sta-tions clearly depends on the transport time from Gosan. Although the magnitude of
10
CO peaks observed at Gosan often exceeded 300 ppbv, they decayed quickly during the 3–4 days of eastward transport as the polluted air masses from the Asian continen-tal sources mixed with relatively clean marine air. By contrast, the magnitude of high O3 episodes remained relatively constant at 10 to 30 ppbv at all the sites. In fact, the O3 enhancement showed a slight increase during transport from Gosan to
Minamitor-15
ishima. As shown in Fig. 2, the temporal variability of O3 is characteristically different
from Event to Event, reflecting the roles various chemical processes play at different times in the production and destruction of O3. For a particular Event, the magnitude of
the O3 enhancement, ∆O3, remained not only relatively constant during its eastward
transport, in spite of mixing with clean background maritime air, but showed some
in-20
crease, unlike CO, even though the lifetime of O3 is much shorter than CO. The slight
increase in ∆O3 indicates a net positive O3 production compensating the loss due to
the dilution effects during transport.
The contrasting changes of O3 and CO as a function of transport time resulted in
a clear variation in the ∆O3/∆CO ratios at different stations. The ∆O3/∆CO ratio at
25
Gosan ranged from 0.03 to 0.07. The ratio increased slightly to 0.05–0.1 after the 10–14 h of transport to Amami-Oshima, Yonagunijima, and Hateruma. At Minamitor-ishima, the ratio was significantly enhanced, ranging from 0.22 to 0.32. Having elimi-nated the influence of the dilution effect due to mixing with the background air during
ACPD
8, 3525–3561, 2008 EAREX 2005 H. Tanimoto et al. Title Page Abstract Introduction Conclusions References Tables Figures ◭ ◮ ◭ ◮ Back Close Full Screen / EscPrinter-friendly Version Interactive Discussion
EGU
transport by taking the ratio of O3 to CO, the increase in the ∆O3/∆CO ratio clearly
point to the formation of O3during the transport. It is to be noted that the several
spike-like peaks observed near the source regions (i.e., Amami-Oshima, Yonagunijima, and Hateruma for Events II and III) could be “washed” into the broader peaks observed at Minamitorishima after the polluted air masses from different sources in China, Korea,
5
and Japan were trapped and mixed, and then transported by cold fronts. Indeed, this could affect the absolute values of ∆O3or ∆CO. However, considering the similarity of
the ∆O3/∆CO ratios near the source regions, this mixing effect would cause little bias
in the ∆O3/∆CO ratios observed at Minamitorishima, and hence dependency on the
transport time.
10
6.2 Modeled O3-CO correlation
Although the O3-CO correlation may become obscured by including different processes
and air mass types on a short-time scale, the monthly O3-CO correlation still provides
a valuable test for model predictions of anthropogenic influence on O3, particularly if the period of interest is dominated by specific meteorological conditions. This would be
15
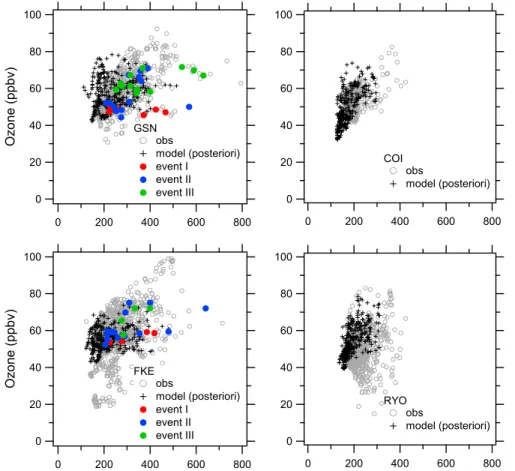
the case for spring season in East Asia since synoptic-scale transport basically dictates regional spatial patterns and temporal variability of trace gases such as CO and O3. Figure 8 shows scatter plots of observed and modeled O3 versus CO mixing ratios at the 8 stations. The plots show a general positive correlation between O3 and CO at
all the stations. Although the model failed to reproduce groups of several high O3and
20
CO peaks, the overall monthly relationships between O3and CO were reasonably well simulated. The model showed relatively poor reproducibility in predicting high O3and
CO data clusters, as was indicated in Figs. 3 and 4. This could have been caused by the limited horizontal (80 km) resolution used in the model; it is also possible that the model did not contain all the relevant CO emissions. Episodes of low O3 associated
25
with high CO observed at Ryori and Fukuejima were not well reproduced by the model, likely due to the sub-grid scale titration of O3with NO by local pollution sources around these sites. However, the overall general nature of the O3-CO correlation was well
ACPD
8, 3525–3561, 2008 EAREX 2005 H. Tanimoto et al. Title Page Abstract Introduction Conclusions References Tables Figures ◭ ◮ ◭ ◮ Back Close Full Screen / EscPrinter-friendly Version Interactive Discussion
EGU
simulated, suggesting that the mean salient features of the O3-CO variability affected by the synoptic-scale transport of pollutants were fairly well reproduced in the model. The observed O3-CO correlation at Minamitorishima is more bounded than those at
the other stations closer to the continent, suggesting that the air masses arriving at Minamitorishima were “well-aged” and negligibly perturbed by surface sources during
5
transport over the ocean from the continental source regions. The O3-CO correlation
at Minamitorishima shows a steeper slope, but the absolute O3levels are not as high as those observed at the other stations as a result of mixing with clean maritime air masses.
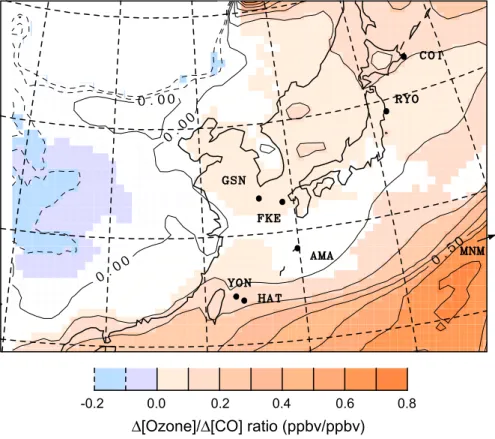
A geographical distribution the ∆O3/∆CO ratio for March 2005 calculated by the
10
model is shown in Fig. 9. Assimilated CO data were used. The spatial pattern is in general consistent with the observations. The pattern over East Asia in particular is in good quantitative agreement with the results from a previous global model study (Mauzerall et al., 2000). Values of the ratio less than 0.1 (but greater than zero) are located near the Asian continent, increasing to more than 0.5 over the Pacific Ocean.
15
Compared to the observed values at Minamitorishima, the latter is an overestimate. Near-zero or even negative ∆O3/∆CO ratios over and near the source regions are
likely due to large short-term variability in CO emitted by the surface sources. Large perturbations in CO emissions also result in poor statistical significance around that region.
20
Zhang et al. (2006) recently showed strong positive O3-CO correlations in the
mid-dle troposphere downwind of continental source regions such as East Asia, by utilizing the Tropospheric Emission Spectrometer (TES) observations. Based on aircraft obser-vations, Kondo et al. (2004) showed that a net O3 production occurred in the marine
boundary layer at the mid-latitude region (in particular 30◦N–45◦N) over the western
25
Pacific in the spring of 2001, due to relatively high NO levels combined with strong westerly advection during this season. The net O3production was also positive in the
upper troposphere due to high NO and low H2O levels. These results add to the
ACPD
8, 3525–3561, 2008 EAREX 2005 H. Tanimoto et al. Title Page Abstract Introduction Conclusions References Tables Figures ◭ ◮ ◭ ◮ Back Close Full Screen / EscPrinter-friendly Version Interactive Discussion
EGU
confirming that East Asia is an important O3source region during spring.
Liang et al. (2004) found that a majority of trans-Pacific transport events of Asian pol-lution reaching the northeast Pacific below 2 km altitude was caused by advection in the marine boundary layer associated with cold fronts. We have found that the polluted air masses are initially trapped in the boundary layer over Asia before being transported
5
to the Pacific Ocean by cold fronts. They also attributed several elevated CO peaks ob-served at Minamitorishima to long-range transport in the boundary layer of Asian CO, based on tagged tracer experiments. Price et al. (2004) analyzed photochemical evolu-tion of O3in air masses transported from Asia to the northwest United States, based on
the ratio of excess O3to excess CO observed at Cheeka Peak Observatory (CPO) and
10
by aircraft measurements. They obtained values of ∆O3/∆CO ranging from −0.06 to
1.52. They also found that ∆O3/∆CO ranged from 0.1 to 0.5 in pollution plumes (mainly
from combustion sources such as industrial and/or biomass burning) transported in lay-ers 2 – 5 km high. Plumes with lower ∆O3/∆CO values (<0.10) were characteristic of
long-range transport in the boundary layer or of an environment with substantial
pres-15
ence of mineral dust. The lower∆O3/∆CO ratios likely resulted from shorter lifetime
of O3at lower altitude and/or heterogeneous reaction associated with sea salt or dust aerosols. The ∆O3/∆CO ratios observed at Minamitorishima, ranging from 0.2 to 0.35,
are in a good agreement with those observed in trans-Pacific plumes of combustion origins, but significantly higher than those observed in the plumes reaching the
north-20
west United States. One possible explanation for this is that the net photochemical production of O3is active during the first 3–4 days of the boundary layer transport
af-ter leaving the pollution sources in Asia, but the production decreases thereafaf-ter due to very low NO levels over remote Pacific Ocean, showing noticeably lower values of ∆O3/∆CO by the time the pollution plume reaches west coast of the United States.
ACPD
8, 3525–3561, 2008 EAREX 2005 H. Tanimoto et al. Title Page Abstract Introduction Conclusions References Tables Figures ◭ ◮ ◭ ◮ Back Close Full Screen / EscPrinter-friendly Version Interactive Discussion
EGU
7 Concluding remarks
We coordinated simultaneous observations of O3 and CO at 8 surface sites located
in the East Asia Pacific Rim from 24◦N to 43◦N during March 2005 when continental outflow plays a dominant role in transporting air pollutants from East Asia to the Pacific Ocean. We analyzed these continuous data using a 3-dimensional regional
chem-5
istry transport model, to diagnose recent changes in CO emissions from East Asia and photochemical evolution of O3 in air masses transported in the marine boundary
layer exported from the Asian continent. From the hourly data, three major pollution episodes were selected for detailed analyses since these episodic events were well characterized by Sawa et al. (2007).
10
A 4-dimensional adjoint inverse model was first used to improve CO emissions from East Asia for the year 2005, constrained by highly time-resolved continuous measure-ments at the 6 surface sites. With the a posteriori CO emissions inventory, the model was able to reproduce observed levels and temporal variations of O3 and CO fairly
well. The inversion analysis indicated an annual anthropogenic CO emission of about
15
170 Tg from China in 2005, a 16% increase since 2001 (based on the same inverse model used in this study). These emission estimates are in good agreement with those obtained by two bottom-up approaches, as well as with the recent changes derived from MOPITT satellite observations of CO column over the industrial regions in China. We also performed various analyses of the O3-CO relationship as a function of
trans-20
port time from the source regions to the monitoring sites for 3 major pollution events observed at all the stations and denoted as Events I, II and III. The ∆O3/∆CO ratios
increased with age of the polluted air masses over the course of 3–4 days from the source regions. This feature was quantitatively simulated by the model. It is suggested that en-route photochemical O3 formation occurred during the transport of
continen-25
tal pollution from the Asian continent to the western North Pacific, confirming that this region is an important source for tropospheric O3during spring.
ACPD
8, 3525–3561, 2008 EAREX 2005 H. Tanimoto et al. Title Page Abstract Introduction Conclusions References Tables Figures ◭ ◮ ◭ ◮ Back Close Full Screen / EscPrinter-friendly Version Interactive Discussion
EGU
Acknowledgements. We thank J. C. Nam, S. Young Bang, C. Cho at Meteorological Research
Institute, Korean Meteorological Administration, K.-R. Kim at Seoul National University, and G. Lee at Hankuk University of Foreign Studies for logistical support at Gosan. This study was financially supported by Global Environmental Research Fund of the Ministry of the Environ-ment, Japan (FS-11). The CO and O3 data observed at Ryori, Yonagunijima and
Minamitor-5
ishima were taken from the WDCGG. Many thanks go to K. Higuchi for valuable comments on the manuscript. H. T. acknowledges D. Jacob at Harvard University for the use of the Harvard resources in MOPITT data analysis.
References
Akimoto, H.: Global air quality and pollution, Science, 302, 1716–1719, 2003.
10
Akimoto, H., Ohara, T., Kurokawa, J., and Horii, N.: Verification of energy consumption in China during 1996-2003 by satellite observation, Atmos. Environ., 40, 7663–7667, 2006.
Allen, D., Pickering, K., and Fox-Rabinovitz, M.: Evaluation of pollutant outflow and CO sources during TRACE-P using model-calculated, aircraft-based, and measurements Of pollution in the troposphere (MOPITT)-derived CO concentrations, J. Geophys. Res., 109, D15S03,
15
2004.
Arellano, A. F., Kasibhatla, P. S., Giglio, L., van der Werf, G. R., and Randerson, J. T.: Top-down estimates of global CO sources using MOPITT measurements, Geophys. Res. Lett., 31(1), L01104, 2004.
Carmichael, G. R., Tang, Y., Kurata, G., Uno, I., Streets, D. G., Thongboonchoo, N., Woo, J.-H.,
20
Guttikunda, S., White, A., Wang, T., Blake, D. R., Atlas, E., Fried, A., Potter, B., Avery, M. A., Sachse, G. W., Sandholm, S. T., Kondo, Y., Talbot, R. W., Bandy, A., Thorton, D., and Clarke, A. D.: Evaluating regional emissions estimates using the TRACE-P observations, J. Geophys. Res., 108(D21), 8810, doi:10.1029/2002JD003116, 2003.
Heald, C. H., Jacob, D. J., Jones, D. B. A., Palmer, P. I., Logan, J. A., Streets, D. G., Sachse, G.
25
W., Gille, J. C., Hoffman, R. N., and Nehrkorn, T.: Comparative inverse analysis of satellite (MOPITT) and aircraft (TRACE-P) observations to estimate Asian sources of carbon monox-ide, J. Geophys. Res., 109, D23306, doi:10.1029/2004JD005185, 2004.
Kondo, Y., Nakamura, K., Chen, G., Takegawa, N., Koike, M., Miyazaki, Y., Kita, K., Crawford, J., Ko, M., Blake, D. R., Kawakami, S., Shirai, T., Liley, B., Wang, Y., and Ogawa, T.:
ACPD
8, 3525–3561, 2008 EAREX 2005 H. Tanimoto et al. Title Page Abstract Introduction Conclusions References Tables Figures ◭ ◮ ◭ ◮ Back Close Full Screen / EscPrinter-friendly Version Interactive Discussion
EGU
tochemistry of ozone over the western Pacific from winter to spring, J. Geophys. Res., 109, D23S02, doi:10.1029/2004JD004871, 2004.
Liang, Q., Jaegl ´e, L., Jaffe, D. A., Weiss-Penzias, P., Heckman, A., and Snow, J. A.: Long-range transport of Asian pollution to the northeast Pacific: Seasonal variations and transport pathways of carbon monoxide, J. Geophys. Res., 109, D23S07, doi:10.1029/2003JD004402,
5
2004.
Matsueda, H., Inoue, H. Y., Sawa, Y., and Tsutsumi, Y.: Carbon monoxide in the upper tro-posphere over the western Pacific between 1993 and 1996, J. Geophys. Res., 103(D15), 19 093–19 110, 1998.
Mauzerall, D. L., Narita, D., Akimoto, H., Horowitz, L., Walters, S., Hauglustaine, D. A., and
10
Brasseur, G.: Seasonal characteristics of tropospheric ozone production and mixing ratios over East Asia: A global three-dimensional chemical transport model analysis, J. Geophys. Res., 105, 17, 895–17,910, 2000.
Ohara, T., Akimoto, H., Kurokawa, J., Horii, N., Yamaji, K., Yan, X., and Hayasaka, T.: An Asian emission inventory of anthropogenic emission sources for the period 1980–2020, Atmos.
15
Chem. Phys., 7, 4419–4444, 2007,
http://www.atmos-chem-phys.net/7/4419/2007/.
Palmer, P. I., Jacob, D. J., Jones, D. B. A., Heald, C. L., Yantosca, R. M., Logan, J. A., Sachse, G. W., and Streets, D. G.: Inverting for emissions of carbon monoxide from Asia using aircraft observations over the western Pacific, J. Geophys. Res., 108(D21), 8828,
20
doi:10.1029/2003JD003397, 2003.
P ´etron, G., Granier, C., Khattatov, B., Yudin, V., Lamarque, J.-F., Emmons, L., Gille, J., and Edwards, D. P.: Monthly CO surface sources inventory based on the 2000–2001 MOPITT satellite data, Geophys. Res. Lett., 31(21), L21107, 2004.
Pielke, R. A., Cotton, W. R., Walko, R. L., Tremback, C. J., Lyons, W. A., Grasso, L. D., Nicholls,
25
M. E., Moran, M. D., Wesley, D. A., Lee, T. J., and Copeland, J. H.: A comprehensive mete-orological modeling system: RAMS, Meteor. Atmos. Phys., 49, 69–91, 1992.
Price, H. U., Jaffe, D.A., Cooper, O. R., and Doskey, P. V.: Photochemistry, ozone produc-tion, and dilution during long-range transport episodes from Eurasia to the northwest United States, J. Geophys. Res., 109, D23S13, doi:10.1029/2003JD004400, 2004.
30
Richter, A., Burrows, J. P., Nuss, H., Granier, C., and Niemeier, U.: Increase in tropospheric nitrogen dioxide over China observed from space, Nature, 437, 129–132, 2005.
ACPD
8, 3525–3561, 2008 EAREX 2005 H. Tanimoto et al. Title Page Abstract Introduction Conclusions References Tables Figures ◭ ◮ ◭ ◮ Back Close Full Screen / EscPrinter-friendly Version Interactive Discussion
EGU
Tsuruta, H., Tohjima, Y., Mukai, H., Kikuchi, N., Katagiri, S., and Tsuboi, K.: Widespread pollution events of carbon monoxide observed over the western North Pacific during the East Asian Regional Experiment (EAREX) 2005 campaign, J. Geophys. Res., 112, D22S26, doi:10.1029/2006JD008055, 2007.
Streets, D. G., Bond, T. C., Carmichael, G. R., Fernandes, S. D., Fu, Q., He, D., Klimont,
5
Z., Nelson, S. M., Tsai, N. Y., Wand, M. Q., Woo, J.-H., and Yarber, K. F.: An inventory of gaseous and primary aerosol emissions in Asia in the year 2000. J. Geophys. Res. 108(D21), 8809, doi:10.1029/2002JD003093, 2003a.
Streets, D. G., Yarber, K. F., Woo, J.-H., and Carmichael, G. R.: Biomass burning in Asia: Annual and seasonal estimates and atmospheric emissions, Global Biogeochem. Cy., 17(4),
10
1099, doi:10.1029/2003GB002040, 2003b.
Streets, D. G., Zhang, Q., Wang, L. He, K., Hao, J., Wu, Y., Tang, Y., and Carmichael, G. R.: Revisiting China’s CO emissions after the Transport and Chemical Evolution over the Pacific (TRACE-P) mission: Synthesis of inventories, atmospheric modeling, and observations, J. Geophys. Res., 111, D14306, doi:10.1029/2006JD007118, 2006.
15
Tanimoto, H., Sawa, Y., Matsueda, H., Uno, I., Ohara, T., Yamaji, K., Kurokawa, J., and Yone-mura, S.: Significant latitudinal gradient in the surface ozone spring maximum over East Asia, Geophys. Res. Lett., 32, L21805, doi:10.1029/2005GL023514, 2005.
Tanimoto, H., Mukai, H., Hashimoto, S., and Norris, J. E.: Intercomparison of ultraviolet pho-tometry and gas-phase titration techniques for ozone reference standards at ambient levels,
20
J. Geophys. Res., 111, D16313, doi:10.1029/2005JD006983, 2006.
Tanimoto, H., Mukai, H., Sawa, Y., Matsueda, H., Yonemura, S., Wang, T., Poon, S., Wong, A., Lee, G., Jung, J. Y., Kim, K. R., Lee, M. H., Lin, N. H., Wang, J. L., Ou-Yang, C. F., Wu, C. F., Akimoto, H., Pochanart, P., Tsuboi, K. Doi, H., Zellweger, C., and Klausen, J.: Direct assessment of international consistency of standards for ground-level ozone:
Strat-25
egy and implementation toward metrological traceability network in Asia, J. Environ. Monit., doi:10.1039/b701230f, 9, 1183-1193, 2007a.
Tanimoto, H., Sawa, Y., Matsueda, H., Wada, A., Yonemura, S., Mukai, H., Wang, T., Poon, S., Wong, A., Lee, G., Jung, J. Y., Kim, K. R., Lee, M. H., Lin, N. H., Wang, J. L., Ou-Yang, C. F., and Wu, C. F.: Evaluation of standards and methods for continuous measurements of carbon
30
monoxide at ground-based sites in Asia, Pap. Met. Geophys., doi:10.2467/mripapers.58.85, 58, 85–93, 2007b.
Analy-ACPD
8, 3525–3561, 2008 EAREX 2005 H. Tanimoto et al. Title Page Abstract Introduction Conclusions References Tables Figures ◭ ◮ ◭ ◮ Back Close Full Screen / EscPrinter-friendly Version Interactive Discussion
EGU
sis and presentation of in situ atmospheric methane measurements from Cape Ochi-ishi and Hateruma Island, J. Geophys. Res., 107(D12), 4148, doi:10.1029/2001JD001003, 2002. Uno I., He, Y., Ohara, T., Yamaji, K., Kurokawa, J.-I., Katayama, M., Wang, Z., Noguchi, K.,
Hayashida, S., Richter, A., and Burrows, J. P.: Systematic analysis of interannual and sea-sonal variations of model-simulated tropospheric NO2 in Asia and comparison with
GOME-5
satellite data, Atmos. Chem. Phys., 7, 1671–1681, 2007,
http://www.atmos-chem-phys.net/7/1671/2007/.
Wang, Y. X., McElroy, M. B., Wang, T., and Palmer, P. I.: Asian emissions of CO and NOx: Constraints from aircraft and Chinese station data, J. Geophys. Res., 109, D24304, doi:10.1029/2004JD005250, 2004.
10
Watanabe, F., Uchino, O., Joo, Y., Aono, M., Higashijima, K., Hirano, Y., Tsuboi, K., and Suda, K.: Interannual variation of growth rate of atmospheric carbon dioxide concentration ob-served at the JMA’s three monitoring stations: Large increase in concentration of atmo-spheric carbon dioxide in 1998, J. Meteorol. Soc. Jpn., 78, 673–682, 2000.
Wong, H. L. A., Wang, T., Ding, A., Blake, D. R., Nam, J. C.: Impact of Asian continental outflow
15
on the concentrations of O3, CO, NMHCs and halocarbons on Jeju Island, South Korea during March 2005, Atmos. Environ., 41, 2933–2944, doi:10.1016/j.atmosenv.2006.12.030, 2007.
Yumimoto, K. and Uno, I.: Adjoint inverse modeling of CO emissions over the East Asian region using four dimensional variational data assimilation, Atmos. Environ., 40, 6836–6845, 2006.
20
Yumimoto, K., Uno, I., Sugimoto, N., Shimizu, A., and Satake, S.: Adjoint inverse mod-eling of dust emission and transport over East Asia, Geophys. Res. Lett., 34, L08806, doi:10.1029/2006GL028551, 2007.
Zellweger, C., Klausen, J., and Buchmann, B.: System and Performance Audit for Surface Ozone, Carbon Monoxide and Methane at JMA GAW Facilities, Part A: Regional GAW station
25
Ryori, Japan, November 2005, WCC-Empa Report 05/4 – Part A., 40 pp., Empa D ¨ubendorf, Switzerland, 2005.
Zhang, L., Jacob, D. J., Bowman, K. W., Logan, J. A., Turquety, S., Hudman, R. C., Li, Q., Beer, R., Worden, H. M., Worden, J. R., Rinsland, C. P., Kulawik, S. S., Lampel, M. C., Shephard, M. W., Fisher, B. M., Eldering, A., and Avery, M. A.: Ozone-CO correlations determined by
30
the TES satellite instrument in continental outflow regions, Geophys. Res. Lett., 33, L18804, doi:10.1029/2006GL026399, 2006.
ACPD
8, 3525–3561, 2008 EAREX 2005 H. Tanimoto et al. Title Page Abstract Introduction Conclusions References Tables Figures ◭ ◮ ◭ ◮ Back Close Full Screen / EscPrinter-friendly Version Interactive Discussion
EGU
Table 1. Comparison of recent estimates of Chinese CO emissions.
Study Chinese Emissions (Tg/year) Year Anthropogenic Biomass burning
Bottom-up Estimates
Streets et al. (2003a) 100 16 2000 Streets et al. (2006) 142 16 2001 Streets and Zhang (2007) 167 – 2006 Ohara et al. (2007) 137 – 2000 Ohara et al. (2007) 158 – 2003
Inverse Model
Yumimoto and Uno (2006) 147 2001
This work 170 2005 Palmer et al. (2003) 163–173 12 2001 P ´etron et al. (2004) 132–194 – 2000–2001 Arellano et al. (2004) 195–222 – 2000 Wang et al. (2004) 166 2001 Heald et al. (2004) 173 2001 Forward Model Allen et al. (2004) 113–177 – 2001 Carmichael et al. (2003) 169–228 – 2001
ACPD
8, 3525–3561, 2008 EAREX 2005 H. Tanimoto et al. Title Page Abstract Introduction Conclusions References Tables Figures ◭ ◮ ◭ ◮ Back Close Full Screen / EscPrinter-friendly Version Interactive Discussion
EGU
5-day forward, 3D wind
GSN COI MNM YON HAT RYO FKE AMA (m)
Fig. 1. Geographical locations of the ground-based stations, along with 5-day forward
trajecto-ries starting from Gosan, Jeju Island during the EAREX 2005 campaign period in March, 2005 (COI, Cape Ochi-ishi; RYO, Ryori; GSN, Gosan; FKE, Fukuejima; AMA, Amami Oshima; YON, Yonagunijima; HAT, Hateruma; MNM, Minamitorishima). Trajectory altitudes are color-coded. Topographic elevations are expressed by different shades of gray.
ACPD
8, 3525–3561, 2008 EAREX 2005 H. Tanimoto et al. Title Page Abstract Introduction Conclusions References Tables Figures ◭ ◮ ◭ ◮ Back Close Full Screen / EscPrinter-friendly Version Interactive Discussion
EGU
Fig. 2. Observed hourly time series of O3(blue, left axis) and CO (orange, right axis) mixing ratios at each station. Three pollution episodes observed are gray-shaded and labeled by the episode number (i.e., I, II, and III). These three episodes were identified and characterized by Sawa et al. (2007). Time unites are Local Time (UTC+9).
ACPD
8, 3525–3561, 2008 EAREX 2005 H. Tanimoto et al. Title Page Abstract Introduction Conclusions References Tables Figures ◭ ◮ ◭ ◮ Back Close Full Screen / EscPrinter-friendly Version Interactive Discussion EGU 100 80 60 40 20 O z o n e ( p p b v ) 95 90 85 80 75 70 65 DOY GSN obs model 1000 800 600 400 200 0 C O ( p p b v ) 95 90 85 80 75 70 65 DOY
GSN obs model (posteriori)
100 80 60 40 20 0 O z o n e (p p b v ) 95 90 85 80 75 70 65 DOY
FKE obs model
800 600 400 200 0 C O ( p p b v ) 95 90 85 80 75 70 65 DOY
FKE obs model (posteriori)
Fig. 3. Comparison of observed (hourly, gray circles) and modeled (3-hourly, black lines) time
series of O3and CO mixing ratios at all stations. Data at Minamitorishima are not shown here because it is out of the model domain. Time unites are Local Time (UTC+9).
ACPD
8, 3525–3561, 2008 EAREX 2005 H. Tanimoto et al. Title Page Abstract Introduction Conclusions References Tables Figures ◭ ◮ ◭ ◮ Back Close Full Screen / EscPrinter-friendly Version Interactive Discussion EGU 100 80 60 40 20 O z o n e (p p b v ) 95 90 85 80 75 70 65 DOY
COI obs model
600 400 200 0 C O (p p b v ) 95 90 85 80 75 70 65 DOY
COI obs model (posteriori)
100 80 60 40 20 0 O z o n e (p p b v ) 95 90 85 80 75 70 65 DOY
RYO obs model
600 400 200 0 C O ( p p b v ) 95 90 85 80 75 70 65 DOY
RYO obs model (posteriori)
100 80 60 40 20 0 O z o n e (p p b v ) 95 90 85 80 75 70 65 DOY
AMA obs model
100 80 60 40 20 0 O z o n e (p p b v ) 95 90 85 80 75 70 65 DOY
YON obs model
600 400 200 0 C O (p p b v ) 95 90 85 80 75 70 65 DOY
AMA obs model (posteriori)
1000 800 600 400 200 0 C O ( p p b v ) 95 90 85 80 75 70 65 DOY
YON obs model (posteriori)
100 80 60 40 20 0 O z o n e (p p b v ) 95 90 85 80 75 70 65 DOY
HAT obs model
800 600 400 200 0 C O (p p b v ) 95 90 85 80 75 70 65 DOY
HAT obs model (posteriori)
ACPD
8, 3525–3561, 2008 EAREX 2005 H. Tanimoto et al. Title Page Abstract Introduction Conclusions References Tables Figures ◭ ◮ ◭ ◮ Back Close Full Screen / EscPrinter-friendly Version Interactive Discussion EGU 120 100 80 60 40 20 0 Mo d e le d O 3 (p p b v) 120 100 80 60 40 20 0 Observed O3 (ppbv) [mod]=(0.91+/-0.02)[obs]+(3.3+/-1.0) r=0.484 GSN FKE COI RYO AMA YON HAT 1:1 Fit 600 500 400 300 200 100 0 Mo d e le d C O (p p b v) 600 500 400 300 200 100 0 Observed CO (ppbv) [mod]=(0.85+/-0.02)[obs]+(3.4+/-3.8) r=0.567 GSN FKE COI RYO AMA YON HAT 1:1 Fit
Fig. 4. Scatter plots of observed versus modeled mixing ratios of O3 (left panel) and CO (a posteriori, right panel) at seven stations. Both observed and modeled data are 3-hourly means. Data at Minamitorishima are not shown because it is outside the model domain. The regression lines (solid lines) are obtained by the reduced-major-axis (RMA) regression method. The dashed lines depict 1:1 correspondence. Error limits of the slope and intercept represent 95% confidence levels.
ACPD
8, 3525–3561, 2008 EAREX 2005 H. Tanimoto et al. Title Page Abstract Introduction Conclusions References Tables Figures ◭ ◮ ◭ ◮ Back Close Full Screen / EscPrinter-friendly Version Interactive Discussion
EGU
Fig. 5. Spatial distribution of a posteriori (left panel) and the difference between a posteriori
and a priori CO emissions (right panel) for 2005, as inferred from the adjoint inverse model. Unites are µg/m2/s. Box denotes Eastern Central China (30–45◦N, 113–125◦E).
ACPD
8, 3525–3561, 2008 EAREX 2005 H. Tanimoto et al. Title Page Abstract Introduction Conclusions References Tables Figures ◭ ◮ ◭ ◮ Back Close Full Screen / EscPrinter-friendly Version Interactive Discussion EGU 250 200 150 100 50 0 C O Emi s si o n s (T g /ye a r) 2006 2005 2004 2003 2002 2001 2000 Year 4.0 3.5 3.0 2.5 2.0 1.5 1.0 C O C o lu mn (x 1 0 1 8 mo le c /c m 2 ) Bottom-up estimates
Ohara et al. 2007 (REAS) Domestic Transportation Industry Power Plant Streets et al. 2003 Streets et al. 2006 Streets & Zhang 2007 Our Top-down estimates
Yumimoto & Uno 2006 This work
Satellite measurements MOPITT CO (FMA)
Fig. 6. Comparison of Chinese CO emissions derived from bottom-up and top-down estimates
(left axis), and trends of MOPITT-derived CO column over Eastern Central China (right axis). The MOPITT data are averaged from austral winter to early spring (February–April). Error bars represent 1 standard deviations. Bottom-up estimates are only for anthropogenic emissions.
ACPD
8, 3525–3561, 2008 EAREX 2005 H. Tanimoto et al. Title Page Abstract Introduction Conclusions References Tables Figures ◭ ◮ ◭ ◮ Back Close Full Screen / EscPrinter-friendly Version Interactive Discussion EGU 600 400 200 0 ∆ [CO] (ppbv) 120 96 72 48 24 0
Time lag from GSN (hours)
40 30 20 10 0 ∆ [O 3 ] (ppbv) 0.4 0.3 0.2 0.1 0.0 ∆ [O 3 ]/ ∆ [CO] (ppbv/ppbv) 120 96 72 48 24 0
Time lag from GSN (hours) FKE AMA YON MNM HAT GSN Event I Event II Event III Regression [Y] = 0.0027[X] + 0.045 r2 = 0.967
Fig. 7. ∆O3, ∆CO, and ∆O3/∆CO ratios as a function of elapsed time from Gosan to other
stations for the three pollution episodes. Error bars are based on the uncertainties in peak-width and regression analysis. Pollution Events I, II, and III are hatched in Fig. 2.