HAL Id: hal-02958650
https://hal.archives-ouvertes.fr/hal-02958650
Submitted on 6 Oct 2020
HAL is a multi-disciplinary open access
archive for the deposit and dissemination of sci-entific research documents, whether they are pub-lished or not. The documents may come from teaching and research institutions in France or abroad, or from public or private research centers.
L’archive ouverte pluridisciplinaire HAL, est destinée au dépôt et à la diffusion de documents scientifiques de niveau recherche, publiés ou non, émanant des établissements d’enseignement et de recherche français ou étrangers, des laboratoires publics ou privés.
Thermal and vibrational biomarkers of porcine oral
mucosa
Camille Ober, Valérie Samouillan, Marie-Hélène Lacoste-Ferré, Jany
Dandurand, Colette Lacabanne
To cite this version:
Camille Ober, Valérie Samouillan, Marie-Hélène Lacoste-Ferré, Jany Dandurand, Colette Lacabanne. Thermal and vibrational biomarkers of porcine oral mucosa. Journal of Thermal Analysis and Calorimetry, Springer Verlag, 2020, pp.1-10. �10.1007/s10973-020-09655-2�. �hal-02958650�
OATAO is an open access repository that collects the work of Toulouse
researchers and makes it freely available over the web where possible
Any correspondence concerning this service should be sent
This is a Publisher’s version published in:
http://oatao.univ-toulouse.fr/26613
To cite this version:
Ober, Camille
and Samouillan, Valérie
and Lacoste-Ferré,
Marie-Hélène
and Dandurand, Jany
and Lacabanne, Colette
Thermal and
vibrational biomarkers of porcine oral mucosa. (2020) Journal of Thermal
Analysis and Calorimetry. 1-10. ISSN 1388-6150
Vol.:(0123456789)
1 3
Journal of Thermal Analysis and Calorimetry https://doi.org/10.1007/s10973-020-09655-2
Thermal and vibrational biomarkers of porcine oral mucosa
Influence of localization on hydric organization and physical structure
Camille Ober1 · Valérie Samouillan1 · Marie‑Hélène Lacoste‑Ferré1,2 · Jany Dandurand1 · Colette Lacabanne1
Abstract
The aim of this study was to develop an experimental protocol to determine specific and reproducible biomarkers of the oral mucosa using a combination of thermal and vibrational techniques. This works deals with the characterization of mandible and maxilla biopsies, 4 mm by diameter, from porcine mucosa in both the hydrated and lyophilized state. Thermogravimet-ric analysis was carried out to measure hydration level of these tissues and to define the onset of proteins degradation. By differential scanning calorimetry, thermal transitions of water and proteins were evidenced and used to quantify the hydric organization (unfreezable/freezable waters) and to evaluate collagen thermal stability (through denaturation parameters). To complete this protocol, Fourier transform infrared spectroscopy was also used to identify specific vibrational signatures of the main layers of oral mucosa. Total and freezable water amounts are significantly higher in maxilla, due to morphologi-cal differences at the macroscopic level, while unfreezable water amount is independent upon localization. Denaturation temperature (in peculiar the temperature corresponding to 50% of collagen denaturation) largely increases with dehydration. This temperature denaturation is also dependent upon localization whatever the hydration, possibly due to differences in cross-links or interactions with other proteins of oral mucosa. The acquisition of thermal and vibrational biomarkers of oral mucosa will contribute to a better knowledge of these soft tissues for further studies on aging.
Keywords Oral mucosa · DSC · Hydric organization · Freezable water · Collagen denaturation · FTIR-ATR
Introduction
With the growth of an elderly population, the theme of aging is becoming a major societal challenge. The problem of teeth loss in the elderly is currently compensated by the wearing of removable dental prostheses based on toothless ridges and more particularly on the oral mucosa. This is an area subject to chewing forces and mechanical stress [1]. The wearing of removable dental prostheses weakens gum tissue, and aging intensifies this fragility [2, 3].
As described in the literature [4], the thickness of the masticatory mucosa varies between 0.7 and 2 mm depend-ing on the location within the oral cavity. The oral mucosa consists of two major layers, the epithelium and the lamina
propria. The epithelium covers the lamina propria, attached
to the alveolar bone via the periosteum.
The epithelium is an orthokeratinized laminated layer [5, 6]. Its thickness, estimated at around 0.3 mm by coherent optical tomography techniques [7], is quite variable from one individual to another, particularly with regard to the effects of medication, stress and local inflammation [8]. The epithelium is characterized by a stack of keratin-rich cells. With keratinocyte differentiation, cells accumulate lipids such as phospholipids, ceramides and cholesterol [9]. Through interactions between cells, the epithelium is described as a biological barrier against chemical and micro-bial aggression but also as a means of protecting the lamina
propria against inflammatory reactions [10]. In this case, the
epithelium reforms and acts as a protective barrier to ensure
optimal healing.
* Valérie Samouillan
valerie.samouillan@univ-tlse3.fr
1 CIRIMAT UMR 5085, Institut Carnot, Equipe Physique Des Polymères, Université de Toulouse, Université Paul Sabatier, 118 route de Narbonne, 31062 Toulouse Cedex, France 2 Gérontopôle- CHU Toulouse, Hôpital Garonne, 224 avenue
de Casselardit - TSA 40031, 31059 Toulouse Cedex 9, France
The lamina propria is a connective tissue layer. In total, 60% of the lamina propria protein fraction is composed of collagen, whom 80–90% is type I collagen [11], the rest including type III collagen (10–15%) and type IV col-lagen (less than 5%) [12–15]. Fibrillar collagens I and III are mainly involved in the mechanical strength of this layer [16]. Elastin, another structural protein of the extracellular matrix, represents less than 6% of the total amount of pro-teins within connective human gingival tissue [17]. The fact that this layer is anchored to the periosteum of the under-lying bone allows the dental crowns to resist the shearing forces associated with chewable foods. Collagens I, III and elastin constitute a network of fibers spaced with multiple polysaccharides chains named glycosaminoglycans (GAGs). The three majors GAGs in the oral mucosa of mammals are chondroitin 4-sulfate, dermatan sulfate and hyaluronic acid [18]. GAGs play a key role in a wide variety of tissue physiological properties, such as the absorption of mechani-cal stress, the maintenance of tissue hydration and the cell migration and proliferation [19]. Richly vascularized, the
lamina propria allows the diffusion of nutrients and oxygen
to the epithelial cells [20] through many exchanges with
epithelium. Containing fibroblasts, vessels, nerves and cells,
this layer also participates in the immune defenses, in par-ticular with regard to inflammatory reactions.
Numerous histological studies have been conducted on the aging of the oral mucosa [21–25]. However, few works have been performed at the molecular and structural lev-els. A large database of vibrational, thermal and dielectric markers has been identified on dermis and was relevant to discriminate between intrinsic and extrinsic aging [26, 27]. Based on this know-how, we propose in this work to develop an experimental protocol susceptible to determine specific molecular biomarkers of the oral mucosa using a combina-tion of characterizacombina-tion techniques such as FTIR-ATR, TGA and DSC. Because of the morphological and histological similarity between porcine oral soft tissues to human oral tissues [28], this study characterizes the vibrational and ther-mal behavior of porcine tissues as a representative model.
Material and methods
Samples
Oral mucosa samples were collected postmortem from the fresh mandible and maxilla on three pigs of 4–6 months old (pigs conditioned for food industry originating from slaughterhouse). A mucoperiosteum flap was sampled in full thickness of the lingual or vestibular attached gingival [29]. The six resulting samples were immediately placed in pure water. They were transported to the laboratory at 4 °C and then deposed on absorbent paper to eliminate excess
water and directly stored at − 20 °C. Five punch biopsies, 4 mm by diameter, were removed from each initially frozen
mucoperiosteum flap. Biopsies from mandible and maxilla
were tested for DSC, TGA and FTIR-ATR measurements. Defrosted samples: For a mild thawing, frozen samples were placed at 5 °C prior to characterization measurements.
Lyophilized samples: another set of frozen biopsies was freeze-dried during 12 h to study porcine oral mucosa in the dehydrated state.
Methods
Fourier transform infrared‑attenuated total reflectance (FTIR‑ATR)
FTIR-ATR spectra were performed using a Nicolet 5700 (Thermo Fisher Scientific, Waltham, MA) equipped in ATR accessory (Smart Orbit with a type IIA diamond crystal, refractive index 2.4) with a KBr beam splitter and a MCT/B detector. For the attenuated total reflectance, the penetration depth of the evanescent wave into the biopsies was estimated between 0.4 and 3.6 µm.
Hydrated samples (N = 12) were laid on the ATR device and covered by a hermetic cap with an “O” ring to avoid dehydration of the sample during spectra acquisition. In order to obtain spectra of each oral mucosa layers (lamina
propria and epithelium layers), both sides of the biopsy were
successively placed onto the crystal.
Lyophilized samples (N = 6) were also laid on the ATR device, and a slight pressure was applied to samples using a PTFE tip in order to improve the contact of the sample with the crystal.
Measurements were recorded over the region of 4000–450 cm−1 with a spectral resolution of 2 cm−1 and 32
accumulations. Background spectrum was recorded before each experiment and subtracted from the sample spectra.
Data were collected using Omnic 8.0 (Thermo Fisher Scientific, Waltham, MA). Then spectra were baseline cor-rected, smoothed (11 points Savitzky–Golay) and normal-ized to the amide II (1540–1550 cm−1).
Thermogravimetric analysis (TGA)
TGA experiments were performed with a thermogravimetric analyzer Q50 (TA Instrument, New Castle, DE). Initially defrosted (N = 3) or lyophilized samples (N = 3), 10 mg by mass, were placed in alumina cups. The loss of sample mass during a linear increase in temperature was recorded between 30 and 800 °C at 10 °C min−1 under nitrogen atmosphere.
Thermal and vibrational biomarkers of porcine oral mucosa
1 3
Differential scanning calorimetry (DSC)
As for FTIR, DSC experiments were carried out in both the hydrated and freeze-dried state.
DSC measurements on defrosted samples (N = 12) were taken with a DSC Pyris calorimeter (PerkinElmer, Waltham, MA) using an empty pan as reference.
Defrosted samples (5–15 mg by mass) were sealed in hermetic aluminum pans and then submitted to a tem-perature program under helium atmosphere: A first step of cooling scan was performed from 20 to − 100 °C at 10 °C min−1 followed by a heating scan from − 100 to 85 °C
at 10 °C min−1 (1st heating). The samples were then cooled
at − 10 °C min−1 to − 100 °C and next heated at 10 °C min−1
to 85 °C (2nd heating). After completing the DSC measure-ments, pans were reweighted to check that they had been correctly sealed. The sample pans were pierced and dried to constant mass at 105 °C for 14 h to determine the sam-ple dry mass and by difference the total amount of water in defrosted samples.
DSC measurements on freeze-dried samples (N = 6) were taken with a DSC Q2000 (TA Instrument, New Castle, DE). Samples were submitted to different program temperatures under helium atmosphere: a first heating scan at 10 °C min−1
from 25 to 245 °C (1st heating), followed by a cooling scan from 245 to 25 °C and then reheated at 10 °C min−1 to
245 °C (2nd heating).
Statistical analysis
Statistical analysis has been done with R Commander 2.5–1 software. Quantitative values are shown as mean ± standard deviation (SD). After checking the conditions for application (normality and variance homogeneity), the Student’s test has been used to compare data between mandible and maxilla mucosa. It is considered statistically significant threshold of
p value less than 0.05.
Results and discussion
Main components of the oral mucosa
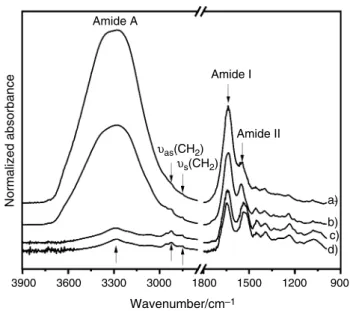
As observed in Fig. 1, the FTIR-ATR spectra of the two constitutive layers of hydrated mucosa in different regions from oral cavity (maxilla and mandible), are characterized by an intense vibration mode between 3600 and 3000 cm−1
(Amide A), with the predominant answer of free and bound hydroxyl groups of water. The intensity of this mode logi-cally decreases in freeze-dried mucosa.
In the 3000–2800 cm−1 range, corresponding to –CH 2 and
–CH3 stretching, νas(CH2) and νs(CH2) modes, respectively,
located at 2927 cm−1 and 2850 cm−1 are mainly due to lipids
and usually used to quantify these components [30]. The spectral region in the 1800–1500 cm−1 is dominated by
pro-teins absorption with Amide I and Amide II bands. Amide I is mainly due to C=O stretching and is very sensitive to secondary structures in proteins [31, 32]. It is noteworthy that O–H bending vibration of water is located in the same zone and superimposed to the Amide I vibration compo-nent in hydrated mucosa. In contrast with Amide I, Amide II, mainly associated with N–H bending coupled to C–N stretching, is not sensitive to water [33] and largely used as a normalization peak [34]. The absorptions at 1452 cm−1
(methylene bending) and 1392 cm−1 (COO− stretching)
originate from both proteins and lipids. Since the fingerprint region in the 1350–900 cm−1 is hardly detectable in the
spec-tra of hydrated samples when compared with freeze-dried samples, we chose afterward to present FTIR spectra from freeze-dried samples.
This fingerprint region can reveal more subtle molecular differences in biological tissues as shown in Fig. 2.
As previously observed for the FTIR spectra from dermis [26], the specific absorption bands of collagen at 1201 cm−1,
1280 cm−1 and 1338 cm−1, respectively, assigned to
δ(C–OH) of tyrosine, δ(CH3) and δw(CH2) of proline are
clearly detectable on the lamina propria spectra, from both mandible and maxilla. The mean area ratio A(1338 cm−1)/
A(Amide II), widely used to evaluate the collagen content in biological tissues [26], was compiled from the spectra of maxilla and mandible. No significant difference is evidenced for this ratio.
In contrast, this specific triplet is missing in the spectra of epithelium from both mandible and maxilla. A similar
3900 3600 3300 3000 1800 Wavenumber/cm–1 1500 Amide II υas(CH2) υs(CH2) Amide I Amide A a) b) c) d) 1200 900 Normalized absorbance
Fig. 1 FTIR-ATR spectra of oral mucosa in the 3900–900 cm−1 spec-tral region; (a) hydrated epithelium, (b) hydrated lamina propria, (c) lyophilized lamina propria and (d) lyophilized epithelium
spectral trend was observed on human periodontal tissues [35]. These important differences in the spectra of the two layers of the oral mucosa can be explained in terms of composition: Lamina propria is a connective tissue with a high proportion of collagens and GAGs. Strong absorp-tions at 1031 cm−1 and 1085 cm−1, respectively, assigned
with ν(C–O–C) of carbohydrates residues, collagen and gly-cosaminoglycans [26] confirm the presence of these mac-romolecules in the lamina propria layer. These bands also reflect a high content of glycogen within lamina propria. Furthermore, it has been shown that the glycogen amount was inversely proportional to the degree of keratinization due to its key role in keratinization process [36]. Since this layer is not keratinized, the accumulation of glycogen in this layer is coherent.
Epithelium spectra show a specific shoulder at around
1310 cm−1 that could be associated with adenine as
previ-ously assigned in biological tissues [37]. Adenine is known to participate in the healing of the epithelial layer [38]. Another specific band of epithelium spectra is the vibrational mode νas(CO–O–C) at 1171 cm−1 associated with
phos-pholipids and cholesterol esters. The bands at 1122 cm−1
(ν(C–O)) and 1060–1040 cm−1 (ν(CH
2OH) could be mainly
associated with mucin [39]. This anchoring glycoprotein on
the upper surface of epithelial cells permits salivary pellicle stabilization and so an epithelium layer protection [40].
In addition, a multivariate statistical analysis of the FTIR spectra of both layers from mandible and maxilla mucosa has been performed using the principal component analysis in the 1350–900 cm−1 zone. This method permits to reduce
the large number of variable (wave numbers) to a new set of uncorrelated small number of variables called principal components (PC). It allows the graphical representation of each spectrum as a scatter plot in the new base of PC. In this representation (not shown), the spectral differences between the two layers are clearly confirmed, while the localization (mandible or maxilla) does not have influence.
Hydric organization
Thermogravimetric analysis was performed on hydrated samples to set the temperature limits prior further DSC experiments and to estimate hydration level of this kind of tissues.
Figure 3 shows the typical TG and DTG curves recorded for hydrated and lyophilized oral mucosa. By comparison with other biological tissues [41, 42], the complex step of mass loss recorded between 30 and 150 °C can be ascribed to dehydration. It accounts for 71.6 ± 2.3% of the total mass
Wavenumber/cm–1 1400 1300 Amide III a) b) c) d) 1200 1100 1000 1306 1338 1280 1201 1079 1031 Normalized absorbance 1171 1053 1122 Amide III
Fig. 2 FTIR-ATR spectra of the lamina propria and epithelium from
lyophilized maxilla/mandible in the 1400–950 cm−1 region; (a) max-illa—lamina propria, (b) mandible—lamina propria, (c) mandible—
epithelium and (d) maxilla—epithelium
100 Hydrated water loss[69–74%] degradation
[10–16%] [18–20%] [63–68%] Lysophilized 80 60 10 °C min–1 40 20 Water loss Hydrated Lyophilized Proteins degradation 0 0.8 0.6 0.4 0.2 0 75 150 225 300 375 450 525 600 Temperature/°C TG/% DTG/% °C –1
Fig. 3 Thermogravimetric (TG) curves and first derivative thermo-gravimetric curves (DTG) of defrosted and lyophilized mandibles
Thermal and vibrational biomarkers of porcine oral mucosa
1 3
in defrosted mandibles. It consists of a first step of mass loss between 30 and 70 °C that mainly corresponds to free water evaporation. In the case of freeze-dried samples, this loss of mass is obviously reduced (between 10 and 16%) and corresponds to residual water and/or water uptake after the freeze-drying process. The second step of dehydration occurring between 70 and 150 °C for defrosted mandibles is associated with the loss of water strongly bound to pro-teins and more particularly to collagen, the main component of the lamina propria. In fact, the DTG curve shows two reproducible peaks at 80 °C and 135 °C, indicative of the presence of different types of bound water. The offset of the dehydration temperature to high temperatures in both the defrosted and freeze-dried mandibles could be addressed to more confined water, such as water molecules within the initial collagen triple helix.
This loss of mass is followed by a quasi-plateau between 180 and 250 °C. The third step of loss mass, between 250 and 450 °C, is due to proteins degradation by a complex process of deamination and decarboxylation [43].
According to these TGA results, DSC measurements have been taken below 85 °C using hermetic pans for defrosted samples and below 240 °C for freeze-dried samples.
In Fig. 4 are reported the typical DSC curves (normalized to the initial mass) of defrosted oral mucosa corresponding to the first cooling to − 100 °C and the successive heating up to 85 °C.
As previously observed in dermis [26], the exothermic peak recorded between 0 and − 10 °C during cooling cor-responds to the crystallization of freezable water, while the endothermic peak between 0 and 20 °C recorded during heating is associated with the melting of this previously
frozen water. This endothermic peak is largely used to estimate the amount of total freezable water in hydrated proteins and tissues (by dividing the area of the measured endothermic peak by 334 J g−1, corresponding to the
melt-ing enthalpy of pure ice at 0 °C) [44]. Once determined the total amount of water by dehydration overnight at 105 °C, the amount of unfreezable water is obtained by difference. This quantification was performed for all the samples, and results are reported in Table 1.
The total hydration of oral mucosa (from both maxilla and mandible), in agreement with TGA quantification, is coherent with the literature data on biological tissues [26, 44], with values between 68 and 80%. No data have been reported until yet on the total water amount of the oral mucosa; it roughly corresponds to about 2–4 g of water per g of dry mass, and this high value is due, as in skin, to a combination of structural and chemical factors including interconnected gaps and the hydrophilicity of collagen and GAG in the lamina propria [26].
In the same way, the literature does not specify the quantification of the different kinds of water (free, i.e., freezable and bound, i.e., unfreezable) in the oral mucosa. In previous studies on human skin [45] we explained the use of “freezable” instead of “free” water rather reserved to vibrational or relaxational techniques. This thermal study indicates that the freezable water, including both bulk water and confined water in mesopores, represents approximately two-third of the total water in oral mucosa, such as in skin [26]. Another third of water is unfreezable water, corresponding to the filling of the first hydration shell of proteins [46] and other hydrophilic components such as the GAGs of the lamina propria [18, 19].
The amount of unfreezable water is not dependent upon the localization (maxilla or mandible), and this fact can be explained by the similarity of the extracellular matrix composition in such tissues. In contrast, it must be pointed that the amount of both freezable water and total water is significantly higher in maxilla than in mandible. This variation in the hydric organization with the localization could be due to the physiological organization of the oral mucosa. First, the samples were collected in full thickness and maxillary samples were thicker than mandibular ones. Second, since maxillary bone is a spongy bone, osteo-mucous vascularization is more intense than in mandible [47].
– 100 – 75 Endo
Step 1: Cooling at 10 °C min–1
1 W g–1
– 50 – 25 0 25 50 75 100
Temperature/°C
Normalized heat flow/W
g
–1
Step 2: Heating at 10 °C min–1
Fig. 4 Typical DSC curves of defrosted oral mucosa, first and second heating
Table 1 Hydric quantification of defrosted oral mucosa
Mean ± SD Total water/% Freezable water/% Unfreezable water/% Maxilla 79.7 ± 5.2 54.8 ± 4.5 25 ± 3.5
Mandible 68.7 ± 5 43.2 ± 9.5 25.5 ± 5.3
Physical structure of proteins
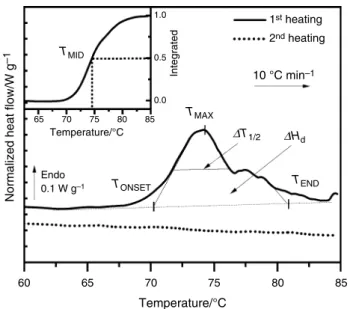
Figure 5 shows the enlargement of the DSC curves of a defrosted oral mucosa in the 60–85 °C window.
As already evidenced in previous works on skin [45, 48], pericardium [49, 50], a similar endothermic phenomenon recorded in this zone on the first heating is due to the irre-versible thermal denaturation of type I and type III colla-gens. Since no thermal events are observed in this zone on successive scans, we can undoubtedly ascribe the complex endotherm of the first scan to collagen denaturation in oral mucosa. As a matter of fact, other components such as lipids possess thermal transitions in the [30–80 °C] window [51], but these transitions are reversible. This thermal behavior allows us to confirm that the oral mucosa contains few lipids, particularly within the majority layer, the lamina propria.
The collagen denaturation—distinct from degrada-tion—is a thermally activated process implying rupture of hydrogen bonds coupling the three α-chains and a rear-rangement of the triple helix into a random chain con-figuration [52], named gelatin. We can observe that the denaturation endotherm of collagen in porcine oral mucosa is constituted of multiple denaturation peaks, as already reported in the literature data [53, 54]. This sequential
“melting” can be attributed to a distribution of colla-gen molecules with a distinct degree of thermal stability [55]. According to some authors [56], there is a correla-tion between the multiplicity of this denaturacorrela-tion and the presence of different cross-links (labile cross-links and thermally stable cross-links) in the protein.
As defined in previous studies [26, 45, 57–59], the pri-mary characteristics of the denaturation peak are TONSET,
TMAX, TMID, TEND and ΔT1/2. These five values of tem-perature are necessary to describe the distribution of the complex denaturation endotherm. TMID is the temperature
at which 50% of collagen is denatured (determined from the integral of the denaturation endotherm), and it varies with the amount of the different cross-links in collagen. ΔT1/2 corresponds to the half-width of the denaturation
endotherm and can be used to evaluate the cooperativity of the transition [59–61]. Mean values of the denaturation temperatures and half-width for mandible and maxilla are reported in Table 2.
The characteristic denaturation temperatures TONSET,
TMAX, TMID, TEND well fit with the denaturation tempera-ture range recorded for hydrated collagenic tissues such as pericardium tissue [49, 50], skin [48, 62]. ΔT1/2 values
are found in the same range as complex collagenic tissues, namely cornea and meniscus [59]. Another important ther-mal parameter of the denaturation is ΔH, the area under the endotherm. Once normalized to the dry mass, it gives a measure of the specific heat/enthalpy of denaturation ΔHd. These values are also reported in Table 2.
Contrary to TONSET, TMAX and TEND temperatures, TMID
is significantly higher for mandible than for maxilla. The heat/enthalpy of denaturation ΔHd is similar in the two series of biopsies, as well as ΔT1/2. We could argue that denaturation temperatures TMID in maxilla were lower than
for mandible due to an increased hydration [63] in the for-mer case. However, previous DSC studies on differently hydrated collagenic tissues [63, 64] showed that the dena-turation temperature becomes independent on water con-tent hydration above 1 g of water per g of dry tissue, what is checked for the studied samples, with a total amount of water of 2–4 g per g of dry mass.
So we completed the thermal characterization of oral mucosa in the lyophilized state. In this case, information on hydric organization of the tissue is lost, but we can access the parameters of the intrinsic thermal transitions of collagen [54, 65].
60 65
TMID
Temperature/°C
Normalized heat flow/W
g –1 Endo 0.1 W g–1 1.0 10 °C min–1 1st heating 2nd heating 65 70 75 80 85 0.5 0.0 70 75 Temperature/°C 80 85 Integrated TMAX ∆T1/2 ∆Hd TONSET TEND
Fig. 5 Typical DSC curves of defrosted oral mucosa in the 60–85 °C zone, first and second heating
Table 2 Thermal parameters
of collagen denaturation in defrosted oral mucosa
Mean ± SD TONSET/°C TMID/°C TMAX/°C TEND/°C ΔT1/2/°C ΔHd/J g−1 Maxilla 64.6 ± 6.6 69.6 ± 3.1 71.4 ± 3.6 74 ± 3.5 4.3 ± 0.4 8.7 ± 4.2 Mandible 71.3 ± 4 75.5 ± 3.6 75.5 ± 3.8 79.6 ± 4.6 5.4 ± 2.1 9.1 ± 2.7
Thermal and vibrational biomarkers of porcine oral mucosa
1 3
The typical DSC curves of freeze-dried oral mucosa cor-responding to the first and second heating between 20 and 240 °C are reported in Fig. 6.
The global feature of DSC curves is similar to that previ-ously reported for rich collagenic tissues [49]. On the first scan, the broad endothermic event occurring between 25 and 150 °C is associated with the loss of tightly bound water remaining after freeze-drying or regained during storage. The thermal event characteristic of this loss of bound water was also visible between 25 and 150 °C on the DTG curves from TGA on the series of lyophilized samples.
Figure 7 shows the enlargement of the typical DSC curves of lyophilized oral mucosa in the 170–240 °C zone. The endothermic phenomenon in the 200–240 °C zone is ascribed to the denaturation of collagen with its character-istic parameters TONSET, TMAX, TEND, TMID, ΔT1/2 and ΔHd
listed in Table 3. As for the hydrated state, the multiplicity of the denaturation phenomenon is detectable with a shoulder in the high-temperature tail of denaturation.
The values found for TMAX are in good agreement with
the literature data on freeze-dried collagen and collagenic tissues, and the considerable shift of the denaturation tem-perature with dehydration confirms the well-known sensitiv-ity of collagen denaturation with dehydration [45, 63], due to the compaction of fibers with the decrease in intrafibril-lar water and to the substitution of protein–water hydrogen bonds by protein–protein hydrogen bonds.
This denaturation phenomenon, irreversible, is not detected on successive scans. It is evidenced on second and successive scans (not shown) a pseudo-second-order transition between 170 and 220 °C ascribed to the glass
transition of denatured collagen, i.e., gelatin, with its characteristic parameter Tg. It is interesting to note that
the glass transition of gelatin was not detected in the sec-ond heating in the hydrated state. Previous calorimetric investigations performed on differently hydrated gelatins have demonstrated a strong decrease in the glass transition temperature with hydration [66]. Extrapolated for 80% of water, the glass transition of gelatin is located at around 0 °C, and therefore, it must be hidden under the melting peak in our experiments in the hydrated state.
In the lyophilized state, TMAX and TMID temperatures are
significantly higher in mandibles than in maxima, while ΔT1/2 has a significant and opposite variation. We had pre-viously assumed that the denaturation temperature TMID
of collagen in the maxilla and mandible recorded in the hydrated state could be significantly different due to their different hydration. Since there remains a difference in the totally lyophilized state, the hydration level in maxilla and mandible cannot explain the difference of denaturation temperature TMID. Other factors must be considered such
as a difference in covalent collagen cross-links, or a slight difference in the molecular composition of the maxillary and mandibular mucosa (since proteins like elastin influ-encing the thermal denaturation of collagen as previously observed for perimysial collagen [57]). The decrease in the peak width could reflect a better organization and homo-geneity of collagen triple helices, as previously stated for other collagenic tissues [59]. In a similar way as the dena-turation temperatures shift, a significant variation of the endotherm width can be interpreted in terms of differences in composition and organization of tissue matrix.
20 40 60 80 100 120 140 10 °C min–1 1st heating 2nd heating 160 180 200 220 240 Temperature/°C Endo ∆Hd Tg 1W g–1
Normalized heat flow/W
g
–1
Fig. 6 DSC curves of lyophilized oral mucosa, first and second heat-ing, scanning rate 10 °C min−1 between 20 and 240 °C
10 °C min–1
1st heating
2nd heating
Temperature/°C
170 180 190 200 210 220 230 240
Normalized heat flow/W
g –1 Endo 1W g–1 TMID Temperature/°C 1.0 65 0.5 0.0 200 210 220 230 240 Integrated TMAX ∆T1/2 ∆Hd TONSET Tg TEND
Fig. 7 Typical DSC curves of lyophilized oral mucosa in the 170–
The glass transition Tg remains unchanged, what is coher-ent because of the disruption of the collagen triple helix structure after the first heating.
Conclusions
This exploratory study led on porcine oral mucosa allowed us to determine a whole set of vibrational and thermal bio-markers from the nanometric to the mesoscopic scale in biopsies 4 mm by diameter.
FTIR-ATR spectroscopy is proved efficient to obtain molecular information on lamina propria and epithelium, which possess specific vibrational signatures. This technique should permit a quantitative analysis of the main compo-nents of these two main layers, in peculiar collagens and GAGs of the lamina propria and cells and lipids of the
epithelium.
This work highlights the suitability of DSC/TGA to evaluate the hydric organization of biological tissue like oral mucosa, giving reproducible results. For the first time, the amounts of total, bound and free water in maxilla and mandible are clarified. The higher proportion of free and total water in maxilla could be associated with the higher vascularization and thickness of maxilla. DSC is also a well-suited technique to probe the physical structure of these small biopsies in both the hydrated and dehydrated state. In peculiar, the different thermal markers associated with the multiple denaturation endotherm of collagen were carefully compiled and compared. The denaturation temperature of collagen was shown to logically increase with dehydration, as already checked in various collagenic tissues. It was also highlighted that the denaturation temperature TMID,
consid-ered as a reliable biomarker including the multiplicity of the endotherm, was significantly higher in mandible than in maxilla, irrespective of the hydration. Further investigations are necessary to check whether the dependence of collagen denaturation upon localization is due to differences in col-lagen cross-linking or monitored by interactions with other proteins of the oral mucosa.
Since this protocol on the oral mucosa has been vali-dated, it opens promising perspectives to follow the evolu-tion of these molecular, hydric and structural markers with aging and other factors as inflammation and pathologies. As a matter of fact, DSC thermal markers have been suc-cessfully used to evidence significant differences between
degenerated and inflamed human tissues [67]. Moreover, the evolution of vibrational, thermal and dielectric markers of human dermis with intrinsic and extrinsic aging contributed to a better knowledge of hydric and molecular modification with aging [26, 27]. For example, the increase in the col-lagen denaturation temperature TEND with intrinsic aging in
human dermis was attributed due to glycation phenomena and age-induced carbonyl changes. From a clinical aspect, the gingival collagen network densifies with age, progres-sively leading to tissue fibrosis [23], while the occurrence of specific pathologies weakens the oral tissues [68]; it could induce modification of the different DSC parameters from biopsies of aged patients. Moreover, in elderly patients, the salivary flow reduction might impact the biophysical param-eters associated with matrix hydric organization.
In this way, a clinical study including patient groups of different ages is scheduled in a near future to extract the distribution of such markers.
References
1. Wertz PW, Swartzendruber DC, Squier CA. Regional variation in the structure and permeability of oral mucosa and skin. Adv Drug Deliv Rev. 1993;12:1–12.
2. Lacoste-Ferré MH, Demont P, Dandurand J, Dantras E, Blandin M, Lacabanne C. Thermo-mechanical analysis of dental silicone polymers. J Mater Sci. 2006;41:7611–6.
3. Kydd WL, Daly CH, Waltz M. Biomechanics of oral mucosa. Front Oral Physiol Physiol Oral Tissues. 1976;2:108–29. 4. Müller HP, Schaller N, Eger T, Heinecke A. Thickness of
mastica-tory mucosa. J Clin Periodontol. 2000;27:431–6.
5. Cruchley AT, Bergmeier LA. Structure and functions of the oral mucosa. In: Bergmeier LA, editor. Oral mucosa heal dis. Cham: Springer; 2018. p. 1–18.
6. Squier C, Brogden KIMA. Human oral mucosa. In: Squier C, Brogden KA, editors. Hum oral mucosa. 1st ed. West Sussex: Wiley; 2011. p. 19–52.
7. Prestin S, Rothschild SI, Betz CS, Kraft M. Measurement of epi-thelial thickness within the oral cavity using optical coherence tomography. Head Neck. 2012;34:1777–811.
8. Shinkawa T, Hayashida N, Mori K, Washio K, Hashiguchi K, Taira Y, et al. Poor chewing ability is associated with lower mucosal moisture in elderly individuals. Tohoku J Exp Med. 2009;219:263–7.
9. Dawson DV, Drake DR, Hill JR, Brogden KA, Fischer CL, Wertz PW. Organization, barrier function and antimicrobial lipids of the oral mucosa. Int J Cosmet Sci. 2013;35:220–3.
10. Groeger S, Meyle J. Oral mucosal epithelial cells. Front Immunol. 2019;10:208.
Table 3 Thermal parameters of collagen denaturation in lyophilized oral mucosa
Mean ± SD TONSET/°C TMAX/°C TMID/°C TEND/°C Tg/°C ΔT1/2/°C ΔHd/J g−1 Maxilla 206.6 ± 0.4 217.5 ± 0.3 219.1 ± 0.3 235.6 ± 0.4 198.1 ± 1.3 16.8 ± 0.6 14.7 ± 0.2 Mandible 209.2 ± 1.3 220.4 ± 0.3 221.2 ± 0.4 236.4 ± 0.8 197.1 ± 1.6 14.9 ± 0.3 15.9 ± 0.5
Thermal and vibrational biomarkers of porcine oral mucosa
1 3
11. Katafuchi M, Matsuura T, Atsawasuwan P, Sato H, Yamauchi M.Biochemical characterization of collagen in alveolar mucosa and attached gingiva of pig. Connect Tissue Res. 2007;48:85–92. 12. Kamath V, Rajkumar K, Kumar A. Expression of type I and type
III collagens in oral submucous fibrosis: an immunohistochemical study. J Dent Res Rev. 2015;2:161.
13. Chavrier C, Couble ML, Magloire H, Grimaud JA. Connective tissue organization of healthy human gingiva. J Periodontal Res. 1984;19:221–9.
14. Romanes GE, Schroter-Kermani C, Hinz N, Wachtel HC, Berni-moulin J-P. Immunohistochemical localization of collagenous components in healthy periodontal tissues of the rat and marmoset (Callithrix jacchus). J Periodontal Res. 1992;27:101–10. 15. Bartold PM. Connective tissues of the periodontium. Research
and clinical implications. Aust Dent J. 1991;36:255–68. 16. The R-B, Family C. The collagen family. Cold Spring Harb
Per-spect Biol. 2011;3:a004978–a00497804978.
17. Chavrier C. The elastic system fibres in healthy human gingiva. Arch Oral Biol. 1990;35:S223–S22525.
18. Sakamoto N, Okamoto H, Okuda K. Qualitative and quantitative analyses of bovine gingival glycosaminoglycans. Arch Oral Biol. 1978;23:983–7.
19. Fujita M, Okazaki J. Glycosaminoglycans in the lamina propria and submucosal layer of the monkey palatal mucosa. J Osaka Dent Univ. 1992;26:67–77.
20. Schroeder HE, Listgarten MA. The gingival tissues: the architecture of periodontal protection. Periodontol. 2000;2007(13):91–120.
21. Elias WY. Age-dependent differential expression of apop-totic markers in rat oral mucosa. Asian Pac J Cancer Prev. 2018;19:3245–50.
22. Nakagawa K, Sakurai K, Ueda-Kodaira Y, Ueda T. Age-related changes in elastic properties and moisture content of lower labial mucosa. J Oral Rehabil. 2011;38:235–41.
23. Séguier S, Bodineau A, Folliguet M. Vieillissement des muqueuses buccales: aspects fondamentaux et cliniques. NPG. 2010;10:237–42.
24. Muthu Rama Krishnan M, Shah P, Pal M, Chakraborty C, Paul RR, Chatterjee J, et al. Structural markers for normal oral mucosa and oral sub-mucous fibrosis. Micron. 2010;41:312–20. 25. Pelosse J-J, Pernier C. Bases physiologiques propres à l’adulte.
L’Orthodontie Française. 2011;82:5–22.
26. Tang R, Samouillan V, Dandurand J, Lacabanne C, Lacoste-Ferre M-H, Bogdanowicz P, et al. Identification of ageing biomarkers in human dermis biopsies by thermal analysis (DSC) combined with Fourier transform infrared spectroscopy (FTIR/ATR). Ski Res Technol. 2017;23:573–80.
27. Samouillan V, Tang R, Dandurand J, Lacabanne C, Lacoste-Ferré M-H, Villaret A, et al. Chain dynamics of human dermis by ther-mostimulated currents: a tool for new markers of aging. Ski Res Technol. 2019;25:12–9.
28. Appleton J, Heaney TG. A scanning electron microscope study of the surface features of porcine oral mucosa. J Periodontal Res. 1977;12:430–5.
29. Lacoste-Ferré MH, Demont P, Dandurand J, Dantras E, Duran D, Lacabanne C. Dynamic mechanical properties of oral mucosa: comparison with polymeric soft denture liners. J Mech Behav Biomed Mater. 2011;4:269–74.
30. Olsztyńska-Janus S, Pietruszka A, Kiełbowicz Z, Czarnecki MA. ATR-IR study of skin components: lipids, proteins and water. Part I: temperature effect. Spectrochim Acta A Mol Biomol Spectrosc. 2018;188:37–49.
31. Surewicz WK, Mantsch HH, Chapman D. Determination of pro-tein secondary structure by Fourier transform infrared spectros-copy: a critical assessment. Biochemistry. 1993;32:389–94.
32. Zohdi V, Whelan DR, Wood BR, Pearson JT, Bambery KR, Black MJ. Importance of tissue preparation methods in FTIR micro-spectroscopical analysis of biological tissues: ‘traps for new users’. PLoS ONE. 2015;10:e0116491.
33. Yakimets I, Wellner N, Smith AC, Wilson RH, Farhat I, Mitchell J. Mechanical properties with respect to water content of gelatin films in glassy state. Polymer (Guildf). 2005;46:12577–85. 34. Güler G, Acikgoz E, Karabay Yavasoglu NÜ, Bakan B,
Goor-maghtigh E, Aktug H. Deciphering the biochemical similarities and differences among mouse embryonic stem cells, somatic and cancer cells using ATR-FTIR spectroscopy. Anal R Soc Chem. 2018;143:1624–34.
35. Hynes A, Scott DA, Man A, Singer DL, Sowa MG, Liu K-Z. Molecular mapping of periodontal tissues using infrared micro-spectroscopy. BMC Med Imaging. 2005;5:2.
36. Weisberger D, Fischer CJ. Glycogen content of human normal buccal mucosa and buccal leukoplakia. Ann N Y Acad Sci. 2006;85:349–50.
37. Krafft C, Codrich D, Pelizzo G, Sergo V. Raman and FTIR micro-scopic imaging of colon tissue: a comparative study. J Biophoton-ics. 2008;1:154–69.
38. Dignass B, Spiegler G. Adenine nucleotides modulate epithelial wound healing in vitro. Eur J Clin Invest. 1998;28:554–61. 39. Wong PTT, Lacelle S, Fung MFK, Senterman M, Mikhael NZ.
Characterization of exfoliated cells and tissues from human endocervix and ectocervix by FTIR and ATR/FTIR spectroscopy. Biospectroscopy. 1995;1:357–64.
40. Ukkonen H, Pirhonen P, Herrala M, Mikkonen JJW, Singh SP, Sormunen R, et al. Oral mucosal epithelial cells express the mem-brane anchored mucin MUC1. Arch Oral Biol. 2017;73:269–73. 41. Puett D. DTA and heals of hydration of some polypeptides.
Biopolymers. 1967;5:327–30.
42. Samouillan V, Dandurand-Lods J, Lamure A, Maurel E, Lac-abanne C, Gerosa G, et al. Thermal analysis characterization of aortic tissues for cardiac valve bioprostheses. J Biomed Mater Res. 1999;46:531–8.
43. Dandurand J, Samouillan V, Lacoste-Ferre MH, Lacabanne C, Bochicchio B, Pepe A. Conformational and thermal characteriza-tion of a synthetic peptidic fragment inspired from human tropoe-lastin: signature of the amyloid fibers. Pathol Biol. 2014;62:100–7. 44. Heys KR, Friedrich MG, Truscott RJW. Free and bound water in
normal and cataractous human lenses. Investig Opthalmol Vis Sci. 2008;49:1991.
45. Tang R, Samouillan V, Dandurand J, Lacabanne C, Nadal-Woll-bold F, Casas C, et al. Thermal and vibrational characterization of human skin. J Therm Anal Calorim. 2017;127:1143–54. 46. Kerch G, Zicans J, Merijs Meri R, Stunda-Ramava A, Jakobsons
E. The use of thermal analysis in assessing the effect of bound water content and substrate rigidity on prevention of platelet adhe-sion. J Therm Anal Calorim. 2015;120:533–9.
47. Kaya Y, Alkan Ö, Alkan EA, Keskin S. Gingival thicknesses of maxillary and mandibular anterior regions in subjects with dif-ferent craniofacial morphologies. Am J Orthod Dentofac Orthop. 2018;154:356–64.
48. Wiegand N, Naumov I, Nőt LG, Vámhidy L, Lőrinczy D. Differ-ential scanning calorimetric examination of pathologic scar tissues of human skin. J Therm Anal Calorim. 2013;111:1897–902. 49. Samouillan V, Delaunay F, Dandurand J, Merbahi N, Gardou J-P,
Yousfi M, et al. The use of thermal techniques for the charac-terization and selection of natural biomaterials. J Funct Biomater. 2011;2:230–48.
50. Samouillan V, Dandurand J, Lacabanne C, Thoma RJ, Adams A, Moore M. Comparison of chemical treatments on the chain dynamics and thermal stability of bovine pericardium collagen. J Biomed Mater Res A. 2003;64:330–8.
51. Babita K, Kumar V, Rana V, Jain S, Tiwary A. Thermotropic and spectroscopic behavior of skin: relationship with percutaneous permeation enhancement. Curr Drug Deliv. 2006;3:95–113. 52. Miles CA, Burjanadze TV, Bailey AJ. The kinetics of the
ther-mal denaturation of collagen in unrestrained rat tail tendon determined by differential scanning calorimetry. J Mol Biol. 1995;245:437–46.
53. Wallace DG, Condell RA, Donovan JW, Paivinen A, Rhee WM, Wade SB. Multiple denaturational transitions in fibrillar collagen. Biopolymers. 1986;25:1875–93.
54. Badea E, Della Gatta G, Budrugeac P. Characterisation and evaluation of the environmental impact on historical parchments by differential scanning calorimetry. J Therm Anal Calorim. 2011;104:495–506.
55. Shnyrov VL, Lubsandorzhieva VC, Zhadan GG, Permyakov EA. Multi-stage nature of the thermal denaturation process in collagen. Biochem Int. 1992;26:211–7.
56. Flandin F, Buffevant C, Herbage D. A differential scanning calo-rimetry analysis of the age-related changes in the thermal stability of rat skin collagen. Biochim Biophys Acta Protein Struct Mol Enzymol. 1984;791:205–11.
57. Latorre ME, Velázquez DE, Purslow PP. Differences in the ener-getics of collagen denaturation in connective tissue from two mus-cles. Int J Biol Macromol. 2018;113:1294–301.
58. Wiegand N, Vámhidy L, Kereskai L, Lőrinczy D. Differential scanning calorimetric examination of the ruptured Achilles tendon in human. Thermochim Acta. 2010;498:7–10.
59. Trębacz H, Szczęsna A, Arczewska M. Thermal stability of col-lagen in naturally ageing and in vitro glycated rabbit tissues. J Therm Anal Calorim. 2018;134:1903–11.
60. Wiegand N, Vámhidy L, Lőrinczy D. Differential scanning calo-rimetric examination of ruptured lower limb tendons in human. J Therm Anal Calorim. 2010;101:487–92.
61. Sillinger T, Lőrinczy D, Kocsis B, Kereskay L, Nöt LG, Wiegand N. Differential scanning calorimetric measurement of cartilage destruction caused by gram-negative septic arthritis. J Therm Anal Calorim. 2014;116:747–52.
62. Miles CA, Avery NC. Thermal stabilization of collagen in skin and decalcified bone. Phys Biol. 2011;8:026002.
63. Miles CA, Ghelashvili M. Polymer-in-a-box mechanism for the thermal stabilization of collagen molecules in fibers. Biophys J. 1999;76:3243–52.
64. Sun WQ, Leung P. Calorimetric study of extracellular tissue matrix degradation and instability after gamma irradiation. Acta Biomater. 2008;4:817–26.
65. Budrugeac P. Phase transitions of a parchment manufactured from deer leather. J Therm Anal Calorim. 2015;120:103–12.
66. Tseretely GI, Smirnova OI. DSC study of melting and glass transi-tion in gelatins. J Therm Anal. 1992;38:1189–201.
67. Wiegand N, Naumov I, Vámhidy L, Kereskai L, Lőrinczy D, Nöt LG. Comparative calorimetric analysis of 13 different types of human healthy and pathologic collagen tissues. Thermochim Acta. 2013;568:171–4.
68. Lacoste-Ferré M-H, Hermabessière S, Jézéquel F, Rolland Y. Oral ecosystem in elderly people. Gériatrie Psychol Neuropsychiatr du Viellissement. 2013;11:144–50.
Publisher’s Note Springer Nature remains neutral with regard to