HAL Id: hal-02378544
https://hal.archives-ouvertes.fr/hal-02378544
Submitted on 28 Nov 2019
HAL is a multi-disciplinary open access
archive for the deposit and dissemination of
sci-entific research documents, whether they are
pub-lished or not. The documents may come from
teaching and research institutions in France or
abroad, or from public or private research centers.
L’archive ouverte pluridisciplinaire HAL, est
destinée au dépôt et à la diffusion de documents
scientifiques de niveau recherche, publiés ou non,
émanant des établissements d’enseignement et de
recherche français ou étrangers, des laboratoires
publics ou privés.
Microstructure changes during solidification of cast irons
- Effect of chemical composition and inoculation on
competitive spheroidal and compacted graphite growth
A Regordosa, U de la Torre, A Loizaga, J Sertucha, J. Lacaze
To cite this version:
A Regordosa, U de la Torre, A Loizaga, J Sertucha, J. Lacaze. Microstructure changes during
so-lidification of cast irons - Effect of chemical composition and inoculation on competitive spheroidal
and compacted graphite growth. International Journal of Metalcasting, Springer Verlag, In press,
�10.1007/s40962-019-00389-y�. �hal-02378544�
* Corresponding author. Tel.: +34946215470. E-mail address: jsertucha@azterlan.es
Microstructure changes during solidification of cast irons -
Effect of chemical composition and inoculation on competitive
spheroidal and compacted graphite growth
A. Regordosa
a, U. de la Torre
a, A. Loizaga
a, J. Sertucha
a*, J. Lacaze
ba
Investigación y Desarrollo de Procesos Metalúrgicos, Fundación Azterlan, Durango (Bizkaia), Spain
bCIRIMAT, ENSIACET, Université de Toulouse, Toulouse, France
KEYWORDS
compacted graphite iron magnesium fading inoculation solidification
ABSTRACT
Amongst the most important graphite shapes, nodules and compacted particles are of particular interest as they can coexist in castings with relevant changes in properties. In this context, it has been often reported that the compacted shape is an intermediate form between nodules and graphite lamellas that may be seen as a degeneracy from the nodular one. The present work shows the microstructure evolution of an initially ductile iron alloy with a silicon content of about 2.4 wt.% when reducing progressively the magnesium content by holding a large melt batch in a nitrogen-pressurized pouring unit for 8 hours. Thermal cups with and without inoculant were cast at a regular time interval together with a sample for chemical analysis. Interestingly, the thermal records of the inoculated samples show no significant changes with time while the structure evolved from fully spheroidal to half spheroidal half compacted graphite. Conversely, the thermal curves of the non-inoculated samples showed two arrests, one at nearly the same temperature as for inoculated alloys and a second one at a temperature decreasing with holding time until being below the metastable eutectic temperature. Microstructure observations showed the presence of a limited number of compacted cells which decreases as well with holding time. These observations suggest that these cells start developing during the temperature interval between the first and second arrests, leading to a bulk eutectic transformation either above or below the metastable eutectic temperature. These results support the view that a fully compacted structure can be obtained only with a controlled inoculation which should not be too high to avoid too high nodularity.
1. INTRODUCTION
Compacted graphite cast irons (CGI) have generated an important interest due to the combined properties of these alloys in comparison to spheroidal graphite irons (SGI) and lamellar graphite irons (LGI) [1-4]. This has led to improved physical properties of castings and components normally produced with LGI. However, satisfactory production of CGI is somehow difficult as the intended microstructure, namely a mixture of compacted and spheroidal graphite, is highly sensitive to casting section (cooling rate) [2-5], chemical composition (especially in case of some minor alloying elements as Al, Ti, S, etc.) and inoculation level [6]. Consequently, requirements from customers are mainly focused on defining a correct range of nodularity so as to guarantee the appropriate properties of the produced alloy while casting procedures try to fit them. Successive reviews on
compacted graphite cast irons [7-9] show that: i) controlling melt preparation for achieving an appropriate low nodularity and maximum compactness is quite demanding; ii) a clear understanding of compacted graphite formation has not yet been achieved.
Though various methods of melt preparation to produce CGI have been proposed [10], the cheapest and most common one consists in using low level of a nodularizing alloy similar to those used for producing SGI, i.e. mostly a FeSiMg alloy containing some level of rare earths. That the proper amount of nodularizer is present in the melt before pouring may be controlled by checking the oxygen level [11] or by usual methods as spectrometry and thermal analysis [12].
Mampaey [13] studied the mushy zone evolution during solidification of a CGI by quenching semi-liquid semi-solid samples and compared the results to those obtained on LGI and SGI. At the start of solidification, the mushy zone of CGI follows
2 2ND
CARL LOPER CAST IRON SYMPOSIUM
the same behaviour as for SGI, but then behaves more as that of LGI. These results are in line with the description of the microstructure evolution by Pan et al. [14] on the basis of observations on samples quenched during thermal analysis. Emphasis has been put on the maximum undercooling experienced by CGI at the start of solidification, which is similar to that encountered with SGI, sometimes larger [15] and sometimes smaller [16]. It has thus been proposed that graphite precipitation in CGI starts with spheroidal graphite as in SGI; after some time, protuberances appear on the spheroids which lead to the development of two-phase austenite compacted graphite eutectic cells [14]. During this stage, the two phases are in contact with the liquid as in LGI solidification and the thermal records generally show a marked recalescence.
Because of the deep undercooling at the start of solidification, CGI must be inoculated when casting thin sections with the risk of a significant increase in nodularity [9]. Unless laboratory experiments that are carried out on small melt batches, the present study was dedicated at studying the effect of time and inoculation on the formation of compacted graphite with a large industrial melt maintained for hours in a pressurized pouring unit. Thermal analysis was performed at regular time intervals with two standard thermal analysis (TA) cups, one containing an inoculant and the other not. The evolution of the thermal records and of the microstructure is presented and then discussed.
2. EXPERIMENTAL PROCEDURE
Melt samples analysed in this work were obtained from an 8 t in capacity nitrogen pressurized pouring unit (press-pour) used to fill green sand moulds produced in a high-pressure vertical moulding line. These moulds were used to manufacture series of ductile iron castings with 0.030-0.040 wt.% magnesium and <0.008 wt.% sulphur contents. Melt batches of about 2000 kg were regularly produced adding 17–18 kg of a FeSiMg alloy (grain size 5–25 mm, Si = 45.7, Mg = 5.50, Al = 0.43, Ca = 2.16, Ce = 1.45, La = 0.79 and Fe balance, wt.%), 8 kg of a FeSi alloy (grain size 2–15 mm, Si = 74.6, Al = 0.89, Ca = 0.38, C = 0.10, P = 0.02 and Fe balance, wt.%) and 5 kg of return scraps in a ladle according to the tundish-cover method. The Mg-treated batches were then added to the press-pour in order to support a continuous filling of the moulds.
After finishing regular production in the foundry shop, 4 t of melt were stored in the main holder of the press-pour, keeping some level of heating to maintain the temperature of the liquid alloy. Then, 19 melt samples were gradually taken from the pouring basin (area were the stopper is located) after raising the melt level from inside the main holder of the press-pour. In all cases, the melt contained in the pouring unit was mixed by filling the pouring basin two times before sampling to promote the best homogenization of composition and to avoid uneven magnesium fading phenomena.
In each set of analyses, the melt sample taken out from the pouring basin was used to fill two TA cups and to obtain a medal sample which was then used to determine the chemical composition of the alloy. One of the TA cups was empty when it was filled while the other one contained 0.35 g of a commercial
inoculant (grain size 0.2–0.5 mm, Si = 69.9, Al = 0.93, Ca = 1.38, Bi = 0.49, RE = 0.37 and Fe balance, wt.%), i.e. about 0.10 wt.% of the sample weight poured in the cup. Time at which all sampling steps were carried out was rigorously controlled so as to monitor the evolution of the alloy during holding for 8 hours in the press-pour. The 19 castings were identified with a letter from A to S and a subscript “no-inoc” and “inoc” for not inoculated and inoculated alloys respectively.
All cooling curves were recorded from the poured TA cups by means of Thermolan® software that was then used to determine the values of the most relevant characteristics in each case, i.e. maximum temperature recorded, liquidus temperature, minimum eutectic temperature, recalescence and solidus temperature. The samples poured in the TA cups were then cut and the obtained surfaces properly polished for carrying out metallographic inspections. Micrographs at 100x magnification of three different fields were obtained from the central area of each sample and the shape of the graphite particles was then evaluated by determining the count and area fractions of class III graphite related to compacted shape, respectively fIII_C and fIII_A, class V irregular
nodules, respectively fV_C and fV_A, and class VI well-shaped
nodules, respectively fVI_C and fVI_A with an image analysis
software. These fractions are relative in the sense they are normalized with the total count and area of graphite, i.e. fIII_C +
fV_C + fVI_C = 1 and fIII_A + fV_A + fVI_A = 1. Nodule count values
were then obtained as the sum of class V and VI count values, and the sum fV_C + fVI_C was used to express nodularity. The structure
of the samples was checked by etching the polished surfaces with Nital 5% reactant. In case of those samples without inoculant addition, the carbide area fractions (fcarbides_A) were also
determined on the etched surfaces.
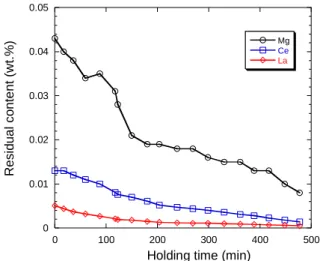
Fig. 1 - Evolution of the content of the melt in Mg, Ce and La. The evolution of the chemical composition of the alloy remaining in the press-pour was determined by analysing the collected medals. Carbon and sulphur contents were measured by combustion analysis (LECO CS300) and the rest of elements by spark spectrometry (SPECTROLAB). The first measured composition (wt.%) was 3.75 C, 2.45 Si (not including the contribution of the inoculant addition), 0.64 Mn, 0.85 Cu, 0.021 Ti, 0.023 P, 0.043 Mg, 0.013 Ce, 0.0051 La, and less than 0.005 S. During holding, the Mn, Cu, P and Ti contents remained constant, while the C and Si contents decreased slightly to 3.65 wt.% and
0 0.01 0.02 0.03 0.04 0.05 0 100 200 300 400 500 Mg Ce La R e s id u a l c o n te n t (w t. % )
2.39 wt.% respectively. The carbon equivalent of the melt was calculated as:
CE = wC + 0.28·wSi + 0.007·wMn + 0.092·wCu + 0.303·wP
where the term wi is the content in wt.% of element “i” [17]. CE
decreased from 4.53 wt.% to 4.41 wt.% during the holding, thus remaining hypereutectic. The only noticeable evolution was that of Mg, Ce and La that is presented in figure 1.
3. RESULTS
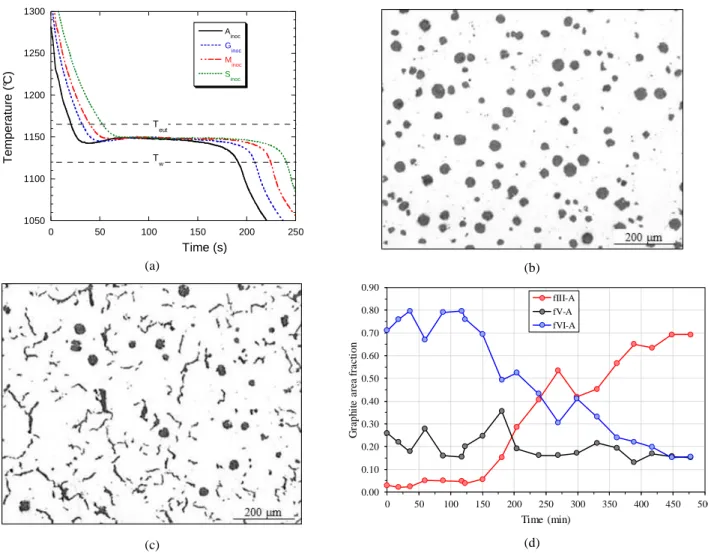
Thermal records for the inoculated alloys are illustrated with those for Ainoc, Ginoc, Minoc and Sinoc samples in figure 2-a, and the
graphite distribution of the first (Ainoc) and last (Sinoc) samples
appear in figure b and c respectively. On the graph of figure 2-a, the calculated stable and metastable eutectic temperatures, Teut
and TW, determined as indicated in the annex have also been
drawn as dotted horizontal lines. The TA records for inoculated alloys were all very similar, showing solidification proceeded along one single eutectic plateau with a maximum temperature that appears nearly the same for all records. It was noticed some recalescence which decreased slowly from the first to the last cast.
The corresponding microstructures showed however a continuous evolution from a fully SGI microstructure to a nearly CGI one. It could further be noticed that small nodules appearing in alloy Ainoc
are totally replaced by compacted graphite particles in alloy Sinoc.
This suggests graphite precipitation in the inoculated alloys started with primary spheroids that became engulfed in austenite and give the large nodules that appear similarly in all samples. This is demonstrated in figure 2-d where the evolutions of the relative area fractions fIII_A, fV_A and fVI_A with time are reported and
where it is seen that fV_A is nearly constant.
In figure 3-a, a similar selection of TA records from the series of non-inoculated alloys is shown; they appear more at change than those for inoculated samples. This is in agreement with the strong change seen in the microstructures illustrated with samples A no-inoc, Eno-inoc and Sno-inoc in figures 3-b, 3-c and 3-d respectively. As
a matter of fact, sample Ano-inoc is fully graphitic with mostly
spheroidal graphite, and its TA record is just alike the ones in figure 2-a. On the contrary, all other non-inoculated alloys showed a two-step solidification with a short plateau at 1139-1149°C and a main plateau at a temperature that decreased with holding time.
(a) (b)
(c) (d)
Fig. 2 - Inoculated samples: cooling curves of a few selected trials (a), graphite distribution in samples Ainoc (b) and Sinoc (c), and evolution of the relative fractions of compacted and nodular graphite (d).
1050 1100 1150 1200 1250 1300 0 50 100 150 200 250 Ainoc G inoc Minoc Sinoc T e m p e ra tu re ( °C ) Time (s) T eut T w 0.00 0.10 0.20 0.30 0.40 0.50 0.60 0.70 0.80 0.90 0 50 100 150 200 250 300 350 400 450 500 G ra p h it e a re a f ra ct io n Time (min) fIII-A fV-A fVI-A
4 2ND CARL LOPER CAST IRON SYMPOSIUM
(a) (b)
(c) (d)
Fig. 3 - Non-inoculated samples: cooling curves of a few selected trials (a) and graphite distribution in samples Ano-inoc (b), Eno-inoc (c) and Sno-inoc (d).
(a) (b)
Fig. 4 - Time evolution of the graphite and cementite area fractions (a) and of the relative fraction fIII_A, fV_A and fVI_A (b) in the non-inoculated samples.
After Nital etching, samples from Cno-inoc to Sno-inoc did show a
significant and increasing amount of white eutectic as seen in figure 4-a where the evolution of the area fractions of graphite and of cementite with time are plotted. For sample Cno-inoc, the
minimum temperature before the second plateau was above TW,
meaning cementite appeared in that sample at the end of solidification. This sample thus demonstrates that the growth of compacted graphite cells gets strongly impeded and slowed down
0 0.02 0.04 0.06 0.08 0.1 0 0.1 0.2 0.3 0.4 0.5 0 100 200 300 400 500 Graphite fraction Cementite fraction G ra p h it e f ra c ti o n C e m e n tit e fr a c tio n Time (min) 0.00 0.10 0.20 0.30 0.40 0.50 0.00 0.10 0.20 0.30 0.40 0.50 0.60 0.70 0.80 0.90 0 50 100 150 200 250 300 350 400 450 500 C ar b id es fr a ct io n G ra p hi te a re a fr ac ti o n Time (min) fIII-A fV-A fVI-A fcarbides-A
at late solidification stage, in contrast to the case of lamellar graphite. For all other samples, the minimum temperature before recalescence was below TW so that cementite may have appeared
both before and after the second plateau. Also, for samples H to S, the second plateau was entirely located below TW. In some cases,
a small but abrupt increase in recalescence during this second plateau was observed which could possibly be associated with nucleation of ledeburite.
In figure 4-b is shown the parallel time evolution of the area fraction of cementite and the relative area fractions fIII_A, fV_A and
fVI_A for non-inoculated samples. During the first 50 minutes, the
relative amount of both types of spheroidal graphite (V and VI classes) decreases while that of compacted graphite strongly increases. Then, the relative amounts of the different types of graphite remain almost constant and the changes seen in figures 3 and 4-a relate to the decrease of the graphite fraction and the associated increase of cementite.
4. DISCUSSION
This discussion deals with the shape of the thermal records in relation with the sequence of graphite precipitation. The description of the cooling curves follows the experimental approach by Pan et al. [14] and the modelling description by Lesoult et al. [18-19].
Owing to the hypereutectic composition of the samples, one expects primary precipitation of graphite when the temperature decreases below the graphite liquidus. However, this precipitation is not predicted to show up with a thermal arrest because the corresponding amount of graphite is low even for inoculated alloys. As the temperature further decreases, the extrapolation of the austenite liquidus is reached and austenite starts precipitating without significant undercooling. At that time, those graphite spheroids which are large enough get surrounded with an austenite envelop while the others continue their growth in the liquid until they could get encapsulated. For the inoculated alloys, it is seen in figure 2-a that there were enough large spheroids at the time austenite appeared for bulk eutectic solidification to take place immediately. The small increase in the minimum eutectic temperature from sample Ainoc to sample Sinoc may be due to the
slight decrease with time of both the CE and the liquid cooling rate (increase of the maximum temperature). It is worth stressing that the evolution from fully spheroidal to spheroidal half-compacted microstructure cannot be noticed on the thermal records.
The first non-inoculated sample, Ano-inoc, showed the same type of
record as the inoculated samples, with solidification showing up with a single plateau. It may be safely assumed that there were enough exogenous particles left in the melt to trigger graphite nucleation at the time of pouring this sample without any inoculant addition. This nucleation capacity then disappeared progressively during holding of the melt, leading to a continuous decrease of the number of primary graphite spheroids in non-inoculated samples as it can be seen from the micrographs shown in figure 3. The thermal records then showed solidification to proceed in two steps marked by two successive plateaus. The first plateau was denoted as TL (TLA) for liquidus arrest temperature by
Pan et al. [14], which appears a misleading labelling owing to the hypereutectic composition of the alloy and to the fact that graphite was already present as primary spheroids. Note that the temperature of this first arrest slightly increases with holding time as for the inoculated samples.
Except for alloy Ano-inoc, the primary graphite nodules in the case
of the non-inoculated alloys were however not numerous enough to generate bulk eutectic solidification so that the first arrest is followed by a further decrease of the sample temperature until a minimum temperature (TEU) was reached at which bulk
solidification could take place. This TEU temperature was found to
decrease first rapidly and then more slowly from sample Bno-inoc to
sample Sno-inoc which clearly shows that less and less graphite had
appeared during the first part of solidification. In turn, this demonstrates that the first arrest is not only related to austenite deposition. This is also seen in figure 3-a by observing that there is an inflexion point in between the first arrest and the minimum temperature, which Pan et al. [14] denoted TE and associated to
the start of coupled eutectic growth. It is interesting to note that the shape of the first arrest remains anyway the same from samples Bno-inoc to Sno-inoc until the inflexion point is reached while
less and less graphite is involved. This may be easily understood by means of the modelling approach [18-19] in which the mass balances showed that less eutectic is compensated for by more off-eutectic austenite, and vice versa.
Attempt was then made to understanding the evolution of the primary spheroidal graphite particles during the stage between the first arrest and TEU. Figure 5-a shows a micrograph of sample
Gno-inoc after light etching where spheroids are seen isolated and
embedded in ledeburite or included in compacted graphite cells. Accordingly, after deep etching, several spheroids could be observed amongst which a few were clearly connected to compacted graphite as in figure 5-b and others were not. This suggests that primary graphite spheroids could be associated with the formation of compacted graphite cells during the first solidification stage or remained growing free in the liquid until bulk solidification.
In figure 6 an extended metallographic field with some marked compacted cells and a detailed SEM image after deep etching of sample Sno-inoc. are shown. Much less spheroids could be identified
in this sample as expected, but the most interesting was that the compacted graphite cells appeared either rounded or elongated. It may easily be inferred that the growth of the rounded cells occurred mostly before the white eutectic developed while the elongated cells were due to their growth being hindered by ledeburite.
To sum up, the following schematic can be suggested for the non-inoculated samples which mostly agrees with previous work by Pan et al. [14]. There is no doubt that the stable eutectic solidification started at the first thermal arrest with primary spheroids getting encapsulated by austenite provided they had a large enough size. Upon further cooling, spheroids remaining in the liquid grew further and then started developing protuberances from which compacted graphite cells develop, as already considered by several authors [20-22]. In samples Bno-inoc to E no-inoc, there were enough of these cells for bulk solidification to take
place before the eutectic white temperature (TEW) was reached.
6 2ND
CARL LOPER CAST IRON SYMPOSIUM
solidification. For samples Fno-inoc to Sno-inoc, compacted graphite
cells started to grow to some extent during cooling before TEU was
reached, but then were competing with fast growing white eutectic leading to some of them appearing elongated. This above schematic still misses a criterion for the formation of
protuberances, which cannot be undercooling as compacted graphite develops in inoculated samples at a temperature very close to TEU.
(a) (b)
Fig. 5 - Sample Gno-ino: light optical micrograph (a) and SEM micrograph after deep etching (b).
(a) (b)
Fig. 6 - Sample Sno-inoc: light optical micrograph (a) and SEM micrograph after deep etching (b). It has been reported previously that the growth rate of compacted
graphite cells is comparable though slower than that of lamellar graphite cells [23]. That it is slower at the start of growth may be in relation with the low capability of compacted graphite to branch [24], and thus to the increased distance between graphite worm-like flakes as compared to the flakes in LGI. At the end of solidification, the slowing down of the growth rate of the compacted graphite cells could possibly be related to the accumulation of magnesium rejected by austenite, which has been suggested to leading to austenite closing up around graphite precipitates [25].
In case of the hypereutectic inoculated samples, graphite nucleation is favoured, and high nodule count values lead to a limitation in the growth of primary nodules. This fact minimizes the early formation of protuberances from the rounded shape and avoid the formation of lebeburite (metastable solidification) leading to the one single plateau observed in the thermal records (see figure 2-a).
5. CONCLUSIONS
Inoculated samples show solidification reactions that proceeded along one single eutectic plateau due to the comparatively high graphite nucleation and the hypereutectic composition of the studied alloys. The solidification on these samples starts with the primary nodules formation which first grow from the liquid and become then surrounded by austenite shells when the metastable extrapolation of the austenite liquidus is reached. For the first cast samples with high magnesium content, new nodules formed during the eutectic reaction get also encapsulated in austenite. As the magnesium content gradually decreases, primary nodules formed similarly but less and less nodules nucleated during eutectic solidification. Instead, more and more compacted graphite particles could be observed which demonstrate that more and more compacted graphite cells have developed. It is interesting to notice that cooling curves shape does not show any evidence of decreasing nodularity of samples.
In case of the non-inoculated samples, it was unexpected that the first one showed a high graphite nucleation. Accordingly, the corresponding thermal record is similar to the ones obtained from the inoculated samples. However, solidification of the rest of non-inoculated samples occurs in two successive steps. In a first small arrest, austenite appears and start interacting with a limited number of primary nodules that have nucleated before. With further cooling, the nodules start developing protuberances that originate compacted graphite cells. With increasing time, bulk reaction takes place at lower and lower temperature in relation with an overall decrease of graphite. During this second arrest, the compacted graphite cells develop further but white eutectic also appears which becomes more and more important as time increases. The present results may be first seen as demonstrating again that inoculation is the second key to master CGI casting together with chemical alloying and cooling rate. Inoculation must be lower in CGI than in SGI to suppress the tendency to form spheroidal graphite [26-27] but yet it is necessary for avoiding chilling. In the non-inoculated samples studied here, the increase of the undercooling before bulk eutectic solidification has been related to the progressive disappearance of remaining graphite nuclei. As a consequence, there were not enough compacted graphite cells developing to avoid the formation of ledeburite. With increasing holding time, the recalescence rate decreased which is also associated with a decrease in the number of eutectic cells competing with the ledeburitic eutectic. Even when bulk solidification started before the TEW
temperature was reached and showed a marked recalescence, ledeburite was observed which must have formed at the end of solidification. This demonstrates that the growth rate of compacted graphite cells slows down significantly during eutectic solidification. The present analysis suggests that the formation of compacted graphite is strongly related to degeneracy of nodules having reached a certain size. This is well in line with the effect of inoculation which limits the maximum size of the spheroids, thus delaying the degeneracy to the very last stage of solidification. Acknowledgements
Discussion with V. Anjos and W. Menk during and after the 2019 European Cast Iron Meeting in Ljubljana is greatly acknowledged. Annex
The calculated stable eutectic temperature may be estimated as Teut = 1154.02 + 4.24·wSi + 4.87·wCu − 4.98·wMn [17], where the
temperature is in Celsius. For the alloy composition indicated in the text, one has Teut varying from 1165.3ºC to 1165.1ºC along the series of
castings. The calculated metastable eutectic temperature is given as TW = 1150 − 12.5·wSi [28], i.e. increasing from 1119.4°C to 1120.1°C
during the series of castings. References
[1] Dawson, S., Schroeder, T., “Practical applications for compacted graphite iron.” AFS Trans., Vol 112, 2004, paper 04-047.
[2] König, M., Wessén, M., “Influence of alloying elements on microstructure and mechanical properties of CGI,” Int. J. Cast Met.
Res., Vol 23, 2010, pp 97-110.
[3] Selin, M., Holmgren, D., Svensson, I. L., “Influence of alloying additions on microstructure and thermal properties in compact graphite irons,” Int. J. Cast Met. Res., Vol 22, 2009, pp 283-285.
[4] Murthy, V. S. R., Sesham, S., “Characteristics of compacted
graphite cast iron,” AFS Trans., Vol 92, 1984, pp 373-380.
[5] Charoenvilaisiri, S., Stefanescu, D. M., Ruxanda, R., Piwonka, T. S., “Thin wall compacted graphite iron castings,”AFS Trans., Vol 110, 2002, paper 02-176.
[6] Loizaga, A., Larrañaga, P., Asenjo, I., Sertucha, J., Suárez, R., “An experimental methodology based on solidification curves for controlling the manufacture of compacted graphite irons”, AFS Trans., Vol 120, 2012, paper 12-006.
[7] Franklin, S. E., “A study of graphite morphology control in cast iron”, PhD thesis, Loughborough University, 1996, https://dspace.lboro.ac.uk/2134/32998
[8] König, M., “Literature review of microstructure formation in compacted graphite iron”, Int. J. Cast Metals Res., Vol 23, 2010, pp 185-192.
[9] Gorny, M., “Cast iron: compacted graphite”, Encyclopedia of Iron, steel, and their alloys, Taylor and Francis, 2015, pp 718-734.
[10] Nechtelberger, E., Puhr, H., Nesselrode, J. B., Nakayasu, A., “Cast iron with vermicular/compacted graphite – State of the art. Development, production, properties, applications”, Int. Foundry Congress, CIATF, Chicago, 1982, pp 1-37.
[11] Mampaey, F.; Habets, D.; Plessers, J.; Seutens, F., “Online oxygen activity measurements to determine optimal graphite form during compacted graphite iron production”, Int. J. Metalcast., Vol Spring 2010, 42, pp 25-40.
[12] Dawson, S., “Controlling the production of compacted graphite iron”, Mod. Cast., Vol 88, 1998, pp 38-41.
[13] Mampaey, F., “Influence of compacted graphite on solidification morphology of cast iron”, AFS Trans., Vol 108, 2000, pp 11-17. [14] Pan, E. N., Ogi, K., Loper, C. R., “Analysis of the solidification process of compacted/vermicular graphite cast iron”, AFS Trans., Vol 90, 1982, pp 509-527.
[15] Stefanescu, D. M., Martínez, F., Chen, I. G., “Solidification behaviour of hypoeutectic and eutectic graphite cast irons. Chilling tendency and eutectic cells”, AFS Trans., Vol 91, 1983, pp 205-216. [16] Backerud, L., Nilsson, K., Steen, M., “Study of nucleation and growth of graphite in magnesium-treated cast iron by means of thermal analysis”, The Metallurgy of Cast Iron, Georgi Pub. Co., Saint-Saphorin, 1975, pp 625-637.
[17] Castro, M., Herrera, M., Cisneros, M. M., Lesoult, G., Lacaze, J., “Simulation of thermal analysis applied to the description of the solidification of hypereutectic SG cast irons”, Int. J. Cast Met. Res., Vol 11, 1999, pp 369-374.
[18] Lesoult G., Castro, M., Lacaze, J., “Solidification of spheroidal graphite cast iron. Part I: physical modelling”, Acta Mater., Vol 46, 1998, pp 983-995.
[19] Lacaze, J., Lesoult, G., Castro, M., “Solidification of spheroidal graphite cast iron. Part II: numerical simulation”, Acta Mater., Vol 46, 1998, pp 997-1010.
[20] Stefanescu, D. M., Loper, C. R., Voigt, R. C., Chen, I. G., “Cooling curve structure analysis of compacted/vermicular graphite cast irons produced by different melt treatments”, AFS Trans., Vol 90, 1982, pp 333-348.
[21] Guilemany, J. M., Llorca-Isern, N., “Metallographic differences between compacted graphite cast iron and vermicular graphite cast iron”, Prakt. Metallogr., Vol 21, 1984, pp 299-306.
[22] López, M. G., Rivera, G. L., Massone, J. M., Boeri, R. E., “Study of the solidification structure of compacted graphite cast iron”, Int. J.
Cast Met. Res., Vol 29, 2016, pp 266-271.
[23] König, M., “Microstructure formation during solidification and solid state transformation in compacted graphite iron”, PhD thesis, Chalmers University of Technology, Gothenburg, 2011.
[24] Lacaze, J., Sertucha, J., “Some paradoxical observations about spheroidal graphite degeneracy”, China Foundry, Vol 15, 2018, pp 457-463.
8 2ND
CARL LOPER CAST IRON SYMPOSIUM
[25] Chen, J. Y., Wu, D. H., Liu, P. C., Loper, C. R., “Liquid metal channel formation in compacted/vermicular graphite cast iron solidification”, AFS Trans., Vol 94, 1986, pp 537-544.
[26] Subramanian, S. V., “Process for producing compacted graphite iron castings”, US patent 4, 806, 157,1989.
[27] Dawson, S., Popelar, P., “Thermal analysis and process control for
compacted graphite iron and ductile iron”, K. Millis Symp., 2013, pp 32-39.
[28] Lacaze, J., “Solidification of spheroidal graphite cast irons. Part III: microsegregation related effects”, Acta Mater., Vol 47, 1999, pp 3779-3792.