Publisher’s version / Version de l'éditeur:
ASHRAE Transactions, 99, 2, pp. 1044-1056, 1993
READ THESE TERMS AND CONDITIONS CAREFULLY BEFORE USING THIS WEBSITE.
https://nrc-publications.canada.ca/eng/copyright
Vous avez des questions? Nous pouvons vous aider. Pour communiquer directement avec un auteur, consultez la première page de la revue dans laquelle son article a été publié afin de trouver ses coordonnées. Si vous n’arrivez pas à les repérer, communiquez avec nous à [email protected].
Questions? Contact the NRC Publications Archive team at
[email protected]. If you wish to email the authors directly, please see the first page of the publication for their contact information.
NRC Publications Archive
Archives des publications du CNRC
This publication could be one of several versions: author’s original, accepted manuscript or the publisher’s version. / La version de cette publication peut être l’une des suivantes : la version prépublication de l’auteur, la version acceptée du manuscrit ou la version de l’éditeur.
Access and use of this website and the material on it are subject to the Terms and Conditions set forth at
Laboratory methods for measuring low-frequency sound emission
Chu, W. T.; Warnock, A. C. C.
https://publications-cnrc.canada.ca/fra/droits
L’accès à ce site Web et l’utilisation de son contenu sont assujettis aux conditions présentées dans le site
LISEZ CES CONDITIONS ATTENTIVEMENT AVANT D’UTILISER CE SITE WEB.
NRC Publications Record / Notice d'Archives des publications de CNRC:
https://nrc-publications.canada.ca/eng/view/object/?id=6e53ba1b-c350-4fbf-ac08-1b1c3c994286 https://publications-cnrc.canada.ca/fra/voir/objet/?id=6e53ba1b-c350-4fbf-ac08-1b1c3c994286
La bora t ory m e t hods for m e a suring low -fre que nc y sound e m ission
N R C C - 3 6 1 0 6
C h u , W . T . ; W a r n o c k , A . C . C .
J u n e 1 9 9 3
A version of this document is published in / Une version de ce document se trouve dans:
ASHRAE Annual Meeting Rumble Noise : Control, Rating, and Measurement,
Denver, CO, USA, 93, pp. 1044-1056, 93 (Also presented at the ASHRAE
Annual Meeting held in Denver, CO, USA on June 26-30, 1993)
http://www.nrc-cnrc.gc.ca/irc
The material in this document is covered by the provisions of the Copyright Act, by Canadian laws, policies, regulations and international agreements. Such provisions serve to identify the information source and, in specific instances, to prohibit reproduction of materials without written permission. For more information visit http://laws.justice.gc.ca/en/showtdm/cs/C-42
Les renseignements dans ce document sont protégés par la Loi sur le droit d'auteur, par les lois, les politiques et les règlements du Canada et des accords internationaux. Ces dispositions permettent d'identifier la source de l'information et, dans certains cas, d'interdire la copie de documents sans permission écrite. Pour obtenir de plus amples renseignements : http://lois.justice.gc.ca/fr/showtdm/cs/C-42
LABORATORY METHODS FOR MEASURING
LOW-FREQUENCY SOUND EMISSION
W.T.
Chu, Ph.D.ABSTRACT
ASHRAE research project 624-RP investigated セ。ᆳ
surement procedures for extending the frequency range of sound power tests in reverberation rooms down to the 63-Hz and 31-Hz octave bands bothfor broad-band and discrete frequency sound sources. There were four main areas of
investigation: (1) a literature review, (2) a detailed study of the sound field in a model reverberation room, (3) a study of the reproducibility of the substitution セエィッ、@ for both one-third-octave and single-frequency セ。ウオイ・ュ・ョエウ@ in a number of reverberation rooms with different sizes and configurations, and (4) calibration of the sound sources used in the investigation by the intensity scan method. The project results suggest that the substitution セエィッ、@ is the most suitable method for セ。ウオイゥョァ@ sound power at low frequencies in reverberation rooms. The reproducibility arid accuracy of the セエィッ、L@ while larger than the values at frequencies of 100Hz and above, appear to be acceptable.
INTRODUCTION
Recent changes in building design and construction have created significant noise problems from air-condition-ing equipment at frequencies below the 125-Hz octave band. ASHRAE TC 2.6 felt there was a need to extend current ANSI sound power standards for use down to the 31-Hz octave band in reverberation rooms typical of those used by many testing laboratories, rooms with volumes of
around 7,000
ttl
(200m3). ASHRAE Research Project624-RP investigated possible techniques for the measurement of sound power in reverberation rooms and attempted to establish the uncertainties associated with the measurements. This paper summarizes the results of this investigation. Full details are given in the project report.
Before describing the results, some background information on the behavior of sound fields in reverberation rooms at low frequencies will be helpful. Above a frequen-cy known as the Schroeder frequenfrequen-cy (Schroeder 1962), the sound field generated by a broad-band source in a room is quite uniform; it does not vary much from point to point. Below this frequency, typically about 400Hz in a 7 ,OOO-rt3
(200-m3) room, the sound fields become progressively less
uniform, until at very low frequencies, where only a few room resonances exist, the fluctuations from point to point become very large. This is why standards specify proce-dures to be sure that reverberation rooms have sound fields
A.C.C. Warnock, Ph.D.
Member ASHRAE
that are sufficiently uniform and why measurements are only required down to 100Hz (ANSI 1990a, 1990b). At low frequencies, not only does the sound field vary strongly from place to place but the power emitted by the source can change markedly as it is moved from place to place in the room. Hence, sound power measurements at low frequen-cies can be expected to have large uncertainties or bias. The aim of the project was to determine if the uncertainties and bias were acceptable, remembering that, at present, no information at all usually exists for sound power below 100
Hz. The investigation was for sources radiating broad-band
sound and for those with spectra containing discrete frequency components.
Two methods are routinely used to measure sound power in reverberation rooms. With the direct method, the average sound pressure levels and reverberation times in the room are used to calculate sound power. With the
sub-stitution method, a source of known power replaces the unknown source. The resulting change in sound pressure levels corresponds to the difference in sound power between the sources.
OUTLINE OF PROJECT
Following a review of the literature, the following topics were chosen for study:
1. The direct method, using the room-average sound pressure levels calculated from measurements made throughout the entire room volume, not just in the central room volume as is customarily done.
2. A direct method where sound pressure levels were measured in room comers only.
3. The substitution method, using different methods of sampling the sound field.
4. The sound intensity scanning method for measuring the
"true" sound power of the sources.
Using loudspeaker sources, the first two topics were
studied in a 1 to 2.5 scale model of an 8,829-rt3 (250-m3)
reverberation chamber. Thus the model room had a volume
of 568 rt3 (16.1 m3). Results in a full-size room can be
predicted by dividing model frequencies by 2.5. The substitution method was investigated in greater detail using
a number of room configurations and four different types of
sources. The power of each source was calculated from sound intensity measurements made in an anechoic room
Wing T. Chu and Alfred C. C. Warnock arc senior research officers at the Acoustics Laboratory ,.Institute for Research in Construction,
National Research Council Canada, OttAwa, Ontario.
THIS PREPRINT IS FOR DISCUSSION PURPOSES ONLY, FOR INCLUSION IN ASHRAE TRANSACTlONS 1993, V. 99, Pt. 2. Not to be reprinted in wnole or In
part withoUI written pefmlsalon of the American Soclecy of Healing, RefrigeiB!ing, and Air.Conditioning Engi,._., Inc., 1791 Tullia Circle, NE. Atlanta. GA 30329. Opinions, findings, conclusions. or recommendations expressod in this paper are thoee of the author(s) and do not necessarily reflect the views of ASHRAE. Written
and a reve"rneration chamber with sound-absorbing material
added to it to greatly reduce the reverberant field. These
investigations and results are presented in the following sections.
SOUND POWER MEASUREMENTS AT LOW FREQUENCY USING THE DIRECT METHOD
Detailed Sound Field
Measurements in Model Room
Usually, the average sound pressure level in a room is determined from measurements in the central volume only.
Calculations are made to correct for expected concentration
of sound close to the room surfaces (Waterhouse 1958). To
determine the "true" room-average sound pressure levels
in the model room, the whole room, including points on the
surfaces of the room, was sampled at 3,040 regularly spaced grid points with a traversing microphone system. The grid points were about 6.8 in. (17.2 em) apart. Micro-phone signals were measured with a one-third octave-band real-time analyzer.
The loudspeaker source comprised two 6.5-in. (16.5-cm) woofers set on opposite sides of a 10 in. (25.4 em) diameter plastic globe. A partition inside the globe sepa-rated the two speakers, and the inner spaces were filled
with glass fiber. The two speakers were driven in phase to
simulate a monopole or in anti-phase to simulate a dipole.
These are referred to as the small monopole and dipole.
Two source positions (one comer and one mid-floor lo-cation) were studied. The sound power of each source was computed using the "true" room-average sound pressure level and the average reverberation time. The latter was measured using interrupted sound from the same source in the same position.
The cases with the sound source located at a comer were compared with similar measurements made according
to ANSI (1990a) in the full-size, 8,829-ftl (250-m3) room,
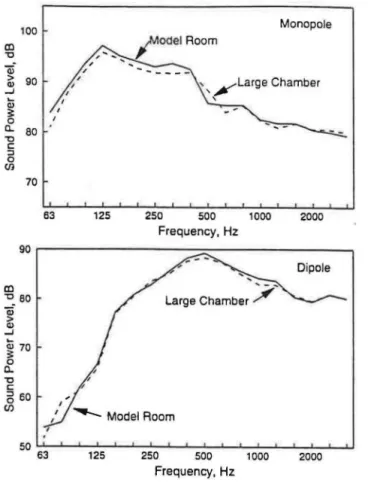
which was fitted with fixed and rotating diffusers. Results of the 63- and 80-Hz bands for the full-size room were questionable because of the inadequacy of the Waterhouse correction term at low frequencies (Maa 1989). A modal analysis (Morse 1948) showed that in the 63-Hz, 80-Hz, and 100-Hz bands, there are only one, two, and three modes, respectively, in the model room, but there are 7, 14, and 29 modes, respectively, in the full-size room. Nevertheless, Figure 1 shows fair agreement between the sound powers measured in the two rooms. Scaling the
model room results to the full-size room (dividing
frequen-cies by 2.5) suggested that there was a possibility of making reliable sound power measurements down to the 25-Hz band
in
reverberation rooms of 250 m3 where there is only asingle mode! 100 CD "0 Q) > 90 Q) ..J .... Q) 5: 0 Cl.
eo
"'0 c: ::1 0 en 70 90 CD -o eo Q) > Q) ..J lii 70 5: 0 Cl. "0 c:5
so en Monopole 63 125 250 500 1000 2000 Frequency, Hz Dipole Large Chamber / -,' , . _ Model Room UPキ⦅セセMlMlMlセセセセセセ セセセセセセ@ 63 125 250 500 1 000 2000Figure 1
Frequency, HzComparison of the sound power leveLs of the
small monopole and the small dipole measured
a1 the corners of the RUセイイヲ@ room and the
model room.
Corner SPL vs ... True .. Room-Average Sound Pressure Level
As well as the detailed survey of the sound field, sound
pressure levels were measured at all eight comers of the model room. Comer microphones are often suggested for the measurement of sound pressure level (SPL) in a room because the room eigenmodes have pressure anti-nodes there. According to theory, the SPL in the comer where three infinite planes meet should be 9 dB greater than the SPL far from the comer. This theory is not expected to apply to sound fields in rooms at low frequencies where there are only a few eigenmodes. Also, when the room is not resonant, the SPL is not the same in each comer.
Figure 2 shows the difference between the room-average SPL and the room-average comer SPL for the small monopole and dipole located in a comer. For comparison, the result computed from normal mode theory (Chu 1980) for rectangular rooms is also shown. A simple point source
9 8 7 []) "0
- 6
Q) 0c
Q) 5 ... Q) -:!:: 0 _j 4a..
Cf) 3 2 1 63Figurt2
./ Monopole.
'
- ··-·"'"'
.
/
··- ··- ··,,,
;·<
//
... , , . ' ' , ,'-
·.
/ "·-.... .. - ·., / I
'
'../ "• I _.,../_ ..,,
, ',. .r ,'
,
',_-1 I I I I I I I I I1/ :'
' - oipole • Ii ,'
,
,
,,
125 250 500 1 000 2000Frequency, Hz
Comparison of differences between average corner SPL and room-average SPL for two different noise sources in a corner of the model room. '17u! theoretical result is for a monopole at the same position.
simulated the actual source. The agreement between theory
and measurement is only fair. This is possibly due to the
inadequate representation of the real finite source by an ideal point source.
Ignoring the difference between theory and measure-ment, it is still evident that there is no simple relationship between the room-average and comer SPL. Empirical relationships would be needed for individual rooms if the direct method of sound power measurement using comer
SPL were to be adopted. These relationships would have to
be determined with a number of sources having different
」セエ・イゥウエゥ」ウN@
Reverberation Time
Measurements in Model Room
With the small monopole and dipole located at the same comer and floor position used in the SPL measurements,
reverberation times were measured at 20 microphone
positions in the central volume of the room and at the eight
comers. For a fixed source location, reverberation times
measured by the comer and the spatial microphones were
similar. However, for frequencies below 800 Hz
(corre-sponding to 315 Hz in the full-size room), the measured
reverberation times depended significantly on the source
type and location (Figure 3). This is not surprising because the sound field is not diffuse below 800Hz. (For the model room, the Schroeder frequency [Schroeder 1962], based on a modal overlap of 3, is about 1,000 Hz.) The maximum
difference in reverberation time at 63 Hz corresponds to a
3. 8-d.B difference in the computed sound power of the source.
At low frequencies, where the number of room modes is small, loudspeakers in arbitrary positions in the room
cannot reliably measure reverberation times for use in
sound power calculations. Not only does the reverberation time depend on microphone and source position, but it also depends on source type. If the loudspeakers do not excite the room in the same way as the source being tested, the reverberation times may not be valid.
In the previous section, the sound powers of the small
monopole and dipole sources were calculated using rever-beration times measured using interrupted sound from the sources themselves. Agreement with sound powers mea-sured in the large reverberation room was good. This suggests that the correct reverberation time to use is the one measured with the same source at the same location where
SPL is measured. However, it is not always feasible to
abruptly stop the sound from a source being tested. Thus, the direct method presents two difficulties at low frequen-cies:
10
NMMMMMMMMMMMMMMMMMMMMMMMMMMMMMMMMMMMMMMMセ@ (IJ Q)E
F
c
0"§
Q)..c
...
Q)>
Q)a:
Figurt3
8 6 42
Random Mics \ / ·. / \ Monopole on Floor' V,
I I : / }.\ \ / \.- -Dipole on Floor .·· ,··.'.\ i , ) . I •. \ • .:. , \ \ , •• \ \ 1. • ... , • ' •• ; I • ."t ·. ; " . I \ ": Iv:· ·. :
"·! •• Dipole at Corner ··.\ !.\\1
· ..• ! ··.' \ ᄋMセ[@ ·.•...,
.··
...
ᄋᄋᄋᄋᄋ ᄋセ|@..
·.
'··
.
.--
.
\ Monopole at Corner
ᄋM|セ NZセ ZZセ ZZZ@
63
125
250
500 1 000 2000
Frequency, Hz
Comparison of space-average reverberation time in the model room for four different excitation conditions.
1. Measurement of room-average sound pressure level: Our data show that comer microphones do not make this task any easier, in contrast to other opinions (Bartel et al. 1983; Baade 1988).
2. Measurement of appropriate reverberation times. Because of these problems, the substitution method was chosen as most likely to be viable for sound power
mea-surements at very low frequencies. It requires no calibration
of microphones and no measurement of reverberation time. It does, however, need a reliable calibration of the
refer-ence sound source at low frequencies. It also assumes that
one type of reference sound source is applicable for the
measurement of all other types of sources.
SOUND POWER MEASUREMENTS AT LOW
FREQUENCY USING THE SUBSTITUTION METHOD The precision and accuracy of the substitution method for both one-third octave-band and single-frequency applica-tions were studied extensively in four rooms of different sizes and configurations using different microphone ar-rangements and source positions. Four different sources were investigated for one-third octave-band excitation and three for single-frequency excitation.
Room Configurations
The test rooms were basically rectangular
parallelepi-peds except as noted below:
1. The model room had a volume of 568
tt3
(16m3) andwas tested empty, with a rotating vane located in a comer, with a rotating vane located near the center, and with two low-frequency tuned absorbers mounted on the rotating vane in a comer.
2. The model room was altered by making two pairs of its walls nonparallel. This reduced the volume to 419 ft3 (12m3). Measurements were made in this room with it empty and with two low-frequency tuned absorbers placed against one pair of nonparallel walls.
3. The large chamber had a volume of 8,857 ft3 (250m3).
It was used in its normal configuration with fixed and
rotating diffusers. For single-frequency measurements, four additional 80-Hz low-frequency tuned absorbers were hung from the four walls.
4. The small chamber had a volume of 2,349
tt3
(67 m3)and was
used
in its regular configuration with fixeddiffusers. This room has two recessed niches about 18 in. (0.5 m) deep where wall and floor specimens are mounted for sound transmission loss tests. These niches added eight extra comers to the "natural" comers in the room.
Sampling Methods
Four methods of sampling the sound field in the rooms were investigated.
1.
Corner microphones:
In
the model room and the alteredmodel room experiments, eight 1/4-in. (6.4-mm) microphones were placed about 0.4 in. (1 em) from each of the eight comers of the room. (The exact location of the microphone is not important for the substitution method as long as it remains unchanged for measuring both the reference and the unknown solirce.)
In the large chamber experiments, only six comer
posi-tions could be used. In the small chamber experiments,
five natural comers were used and three other micro-phones were placed in comers inside the wall niche.
2.
Circle microphones:
In the model room and the smallchamber experiments, eight 114-in. (6.4-mm) micro-phones were equally spaced in a 3.3 ft (1m) diameter circle near the center of the room. The plane of the circle was not parallel to the floor. This arrangement . was meant to simulate a microphone on a rotating
boom.
In
the large chamber experiments, 10micro-phones were used in an 8.2 ft (2.5 m) diameter circle.
3.
Random microphones:
In
the model room experiments,eight 1/4-in. (6.4-mm) microphones were placed
randomly in the central region of the room.
In
the largechamber experiments, one l-in. (25. 4-mm) microphone was moved under computer control to sample nine selected positions in the central part of the room.
4.
Edge microphones:
In the model room experiments,eight 1/4-in. (6.4-mm) microphones were equally spaced along the longest edge of the room including the two comers at the ends.
Sound Sources
Five different sources were used for this investigation.
In most cases, six source positions were used.
1. A monopole was formed from two 10-in. (25.4-cm)
speakers set on opposite faces of a 12-in. (30.5-cm) cubical plywood box and driven in phase. The interior of the box was filled with glass fiber. This is referred to as the large monopole.
2. A dipole was formed from the monopole by driving the speakers in anti-phase. This is referred to as the large dipole.
3. A 12 X 18 X 18 in. (30.5 X 45.7 X 45.7 em) metal
box was made by bending and welding panels of 0.02 in. (0.05 em) thick sheet metal. Two 6.5-in. (16.5-cm) woofers resting _on a foam pad inside generated noise, which was then radiated from the box surfaces. To minimize transmission of low-frequency vibrations to the floor in the anechoic room during sound power
calibration, the box was suspended on rubber bands attached to a wooden frame.
4. A standard fan reference source was modified to
mini-mize the generation of tones at low frequencies. In its normal configuration, the tones emitted by this refer-ence source caused unacceptably large variations in the sound fields in the 40-Hz band.
5.
A second vertically mounted fan source with a 12 in. (30.5 em) diameter fanwheel ran at about half the speed of the standard fan source. This moved trouble-some tones below 25 Hz.Only the monople, the dipole, and the metal box were
used for single-frequency measurements.
Calculations
For each source and source position, the average sound pressure level (Lm) and the standard deviation (sm) of individual sound pressure levels (L1) were calculated for
each sampling method following ANSI (1990a):
Lm "'
10 log [ -1-セュ@
10Li110] , (1) Nm i=1s
m "' 10 log [ 1i"
(L1 -<
L1> )
2]
112
, (
2) (Nm - 1) j:lwhere Nm is the number of microphone positions and
<L
1>
is the arithmetic mean of the individual sound pressure levels L1•For sound power computation using the substitution method, a comprehensive sound pressure level (Lp) aver-aged over microphone and source positions was computed for each source using
LP
= 10log[_!_
.i
lO(L,.)/10] (3)Ns;=1
where (Lm)j is the average sound pressure level obtained using Equation 1 when the source is located at the jth position. The corresponding standard deviation (s 5) of the
average sound pressure levels was calculated according to
{
1
Ns
}1/2
(4)ss "'
(Ns
-1)ェセQ@
[(Lm)j-<Lm
>
]2where
<Lm>
is the arithmetic meanofLm,
averaged overall the source positions, and N5 is the number of source positions.
The sound power for each source was also determined independently using the sound intensity scan technique. Sound intensity measurements were made in an anechoic chamber and in the large reverberation room, which was suitably deadened with sound-absorptive material.
Strictly, standard deviations calculated as above cannot be used for the assessment of the measurement precision at the low frequencies of interest because the microphones are
too close together to give independent samples. However, the standard deviations still serve as a qualitative indicator of the relative merit o,f the different sampling methods.
RESULTS AND DISCUSSIONS
In the following sections, the precision of measured sound pressure levels for a single source position is dis-cussed first. A discussion of the precision of measured average sound pressure levels obtained with a number of source positions follows. Then, the reproducibility and the accuracy of the substitution method for sound power measurements are discussed.
One-Third Octave-Band Results, Single Source Position
When only a single position of a sound source emitting broad-band noise was used, examination of the results for different sources in different rooms led to the following general conclusions:
1. Comer microphones gave the lowest variance of sound pressure level (SPL) in the rooms that were rectangular parallelepipeds.
2. Comer microphones did not give as low variances in the two rooms that were not rectangular parallelepipeds as in the rooms that were.
3. Adding the rotating vanes bad no significant effect on the spatial variance of SPL.
4. Adding the low-frequency absorbers did not significant-ly decrease the spatial variance of SPL.
One-Third Octave-Band Results, Multiple Source Positions
Since the sound power emitted at low frequencies by a source in a reverberation room depends on the position of the source in the room, to get a good average of the source sound power, sound pressure levels should be averaged over several source positions. This is termed here the global average sound pressure level. When this is done, the vari-ance in the average SPL due to changes in source position is much greater than the spatial variance of SPL for a single source position. This means that any advantages due to the use of comer or edge microphones are lost. Figure 4, for the empty model room, shows examples of the average standard deviation due to repositioning the source for four different microphone sampling techniques. Standard deviations for the large monopole and dipole, the metal box, and the modified reference fan source were averaged to produce this graph. Similar plots for other room configu-rations suggest that there is no reason to prefer one micro-phone system over any o'ther when several source positions
CD 5 "'C
"
_J 0...4 CJ) v-
0 c::g3
ctl·s:
Q) Cl "E2 ctl "C c:: ctlCi5
Q)1
C> ctl....
Q) > <(063
Figun41 /3 Octave-Band
Microphone
Arrangement
Circle CornerRandom
Edge I / I 125 250 500 1 000 2000 4000 Frequency, HzAverage standard deviations of the average SPL, s1, obtained by four sampling methods in
the empty model room (averaged over eight microphone positions for each of four source locations for the four sources).
are
Used.
Thisc8n
be viewed as good fortune, since comer microphones are not commonly used and are more incon-venient than a single, moving microphone.To present a more comprehensive picture of the preci-sion in determining the global average sound pressure level, standard deviations from eight different room configurations are plotted on a single graph using a normalized frequency defined by
/, =
f3.;Y -!:.
n
c
セ@(5)
where V is the room volume,
f
is the frequency, and c isthe speed of sound, L =
3v'V
is the geometric meandimen-sion of the room, and セ@ is the wavelength of sound. A
normalized frequency of 0.46 corresponds to 25 Hz in the
250-m3 chamber or 63 Hz in the model.
Figure 5 shows standard deviations of average sound
pressure level as a function of normalized frequency for comer and random microphone arrangements with the modified reference fan as the sound source. The figure gives a rough indication of the precision associated with the estimation of the global average SPL in a laboratory. The main conclusions drawn from data such as these were that all microphone systems work equally well when the source position is changed and that no one room configuration was better than any other.
Reproducibility of Sound Pressure Level Measurements
Using the substitution method, the sound power level produced by a source under test can be calculated as follows:
(6)
where
= sound power level of the noise source under test
(dB);
LP
= global average sound pressure level of the noiseL wr =
source under test (dB), determined according to Equation 3;
sound power level of reference sound source (dB), known from the calibration of the source; and global average sound pressure level of the refer-ence sound source (dB), determined according to
Equation 3. 1/3 Octave-Band セ@ 8.---, セ@ Random c.. en Microphones セV@ 10 Cii セ@ 04 c .Q iii
·s:
セR@ "0 (ij "0 セ@o
L ____
...L.. ________ __.__:_ ____ ⦅NZZZセセセセセMセMセMセLNNNNセM ;;;;.;·;;;;:-_j
en Figun5 0.50 1.00 2.00 5.00 Normalized Frequency Corner Microphones Normalized Frequency 10.00 10.00One-third octave-band standard deviations of the average SPL, s1, vs. normalized frequency
for eight different room configurations excited by the modified ILG. The results are for the random and corner a"angements of the mi-crophones ..
The method relies on an accurate determination of the difference in global average sound pressure level (LP
-Lpr).
Results for the different room configurations were grouped together to give some indication of the
reproduci-bility of the difference
in
global average sound pressurelevels measured for the unknown sources and for that acting
as the reference source. An example of the spread in the
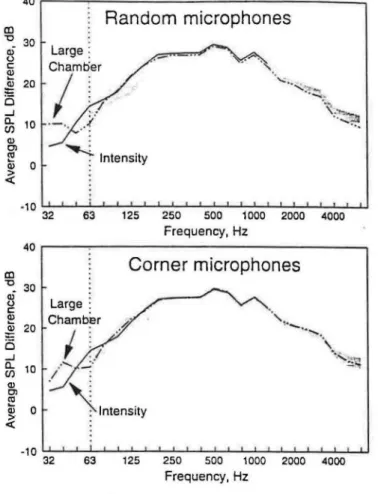
data is shown in Figure 6 for a particular pair of sources, the large monopole and the modified reference fan. Differ-ences between powers measured using sound intensity techniques are included as a reference. The agreement between this line and the shaded area indicates the accuracy of the substitution method. Accuracy and reproducibility are dealt with more fully below. These results give a
prelimi-nary overview of the measurements at low frequencies. They show that for this source
1. the large chamber results and the intensity results agree
well above 80 Hz;
2. translating the model room results to a full-size room (by dividing the frequency scale by 2.5) suggests that the reproducibility of the substitution method should be
better than 5 dB down to the 25-Hz band in full-size
rooms around 250 m3;
3. nevertheless, differences of more than 5 dB between
the large chamber results and intensity results were
seen at and below 63
Hz.
MEASUREMENT PRECISION
Measurement reproducibility is usually found from an interlaboratory or "round robin" investigation using the
same source in different rooms. In this study, different
rooms were used, but the differences in volume between the small room, the large room, and the model room are too great to consider all of them in one group. The data would not be relevant to typical rooms. The precision associated with the substitution method cannot be calculated using
normalized frequency data because, for the same
f,
indifferent rooms, the data would be related to different parts of the source spectra, effectively a different source. Hence,
the data are restricted to those from the model room
measurements. Although the range of volumes is not great, the set of experimental results in the model room is
consid-ered equivalent to an interlaboratory or ''round robin''
investigation. Nevertheless, because of the restricted range in volumes, estimates of precision should be considered as conservative.
This assumption allows approximate estimates to be
made of the precision that can be expected for a
standard-ized test based on the substitution method. The set of results used in the analysis came from the use of
1. four sources: the large monopole and dipole, the metal
box with the modified fan source acting as the refer-ence for the one-third octave-band results, and the large
1/3 Octave-Band TPイMMM MM MMMMMMMMMMMMMMMMMMMMセセセセセセ@ CD "- 30 Q) 0 c: Q) セ@ 20
5
...Jfu
10 Q)Random microphones
セ@
0セ@
Intensity セ@ ᄋQPuMセセMlセセセMlセセセMlセセセセセセ⦅オ@ 32 63 125 250 500 1000 2000 4000 Frequency, Hz 40.---.---, CD-c:
30 Q) 0 c: Q) セ@ 20 0 ...Jfu
10 Q) Cl ctl iii 0 > <(Corner microphones
Large : Chamberl
セO@
/
:
.,.
....,
... セ L NAZ@ 125 250 500 1 000 2000 4000 Frequency, HzFigure 6 Differences between the one-third octave-band average SPL for the large monopole and the modified reference fan source-random and corner arrangements of microphones. The shaded area represenrs the range ofresullsfor the six model room conjigurazions. In the corner microphone cases, the shaded area aLro includes resulls from the small chamber. The difference in intensity levels for the two sources is shown by the solid line on the graph.
monopole as the reference sound source for single-frequency results;
2. six model room configurations;
3. four source positions in each room;
4. eight microphone positions for each source position;
5.
two sampling methods: random and comer.For the substitution method, the precision in the computed power is a combination of the uncertainties associated with measurements of
1. sound pressure level for the unknown source, 2. sound pressure level for the reference source, and
3. sound power of the reference source.
The precision associated with the SPL measurements
can be considered in two parts (ISO 5725-1981 {E) and
1. the precision for measurements in the same room (within-room repeatability) and
2. the precision for measurements obtained in different rooms (between-room reproducibility).
The precision for the power measurement of the
reference source depends on the method used to measure
power. In what follows, we ignore uncertainties in
measure-ment of the sound power of the reference source using sound intensity. Statistics that apply to independent samples were used, although in this study microphones are too close together at low frequencies to provide independent samples. For each source position, the sound pressure level measurements at the different microphone positions have a
mean,
Lm,
and a standard deviation,sm,
given earlier byEquations 1 and 2.
Averaging over N6 source positions, we can define an
average
sm
as(7)
The variance of
Lm
due to changes of source positionin a room, s 6, is defined by
where
<Lm
>
is the arithmetic mean. of theLm;.
Anaverage value of
s
6 can be calculated from thes
6 values foreach of the six rooms. This is the estimate of the
within-room repeatability standard deviation and is labeled s . r
Thus,
(9)
where NR is the number of rooms used.
The standard deviation, s M• of the average SPL for
each room is a combination of the variance due to changing
2 d th . 'thin 2 Th
rooms, sL an e vanance WI a room, sr • :us,
2
s.i,
=si,
+セ@
(10)Ns
and
(11)
where
<
<Lm
> >
is the overall average value of SPL forall the rooms.
The between-room reproducibility,
sl',
is the sum ofthe within-room variance, sr2, and the between-room
. 2 th
vanance, sL , us
ウセ@
=s;
+si,.
(12)The variance associated with the substitution method is taken as the sum of the variances for measuring the mean SPL for the unknown and the reference source (Baade
1971; Luhman 1974). The parameters sr and sR, derived
from the measurements in this study, are presented in Table 1 for one-third octave and octave bands. These are average values based on results obtained for the different sources.
TABLE 1
Estimates of the One-Third Octave-Band and Octave-Band Repeatability and Reproducibility Standard Deviations for the Substitution Method
Using the Modified Fan as the Reference Sound Source
(Normalized frequency i1 defined in Equation 5.1
Corner Mit:. R:llldom 1\1 it:. Corner Mic. Random Mic. Norma1i:t.cd Frequency <s,> <Sit> <s,> <SR> <sc> <SR> <sc> <SR> 0.46 4.0 5.7 3.5 5.3 0.59 3.1 4.7 2.5 4 .0 1.7 4.0 1.3 3.1 0.73 2.4 4.9 2.(> 4.ll 0.92 2.4 4.5 2.H 4.!l 1.18 2.6 3.6 2.0 3.7 1.3 3.2 1.2 3.4 1.47 1.4 2.H l.(> 3.0 1.84 O.!l 1.9 1 .ll 1.9 2.31 0 .9 1.4 I . () 1.5 0.5 1.4 0.6 1.4 2.94 0.(> 1.5 (1.7 lA 3.67 0.7 1.3 0 .(> 1.3 4.63 0.4 1.4 0.5 1.3 0.3 1.3 0.3 1.2 5.8R 0.5 1.3 0.5 1.1 7.35 0.6 1.2 0.5 1.1 9.1H 0.3 0.9 0.3 O.!l 0.3 1.0 0.3 0.9 11.75 0.3 0. 9 0.2 0.9
ONE-THIRD OCTAVE BAND MEASUREMENTS-ACCURACY
To consider accuracy, the sound power levels of the
sources measured by the substitution method were
com-pared with the sound power levels measured by the intensity
method. In essence, the data were replotted in a different
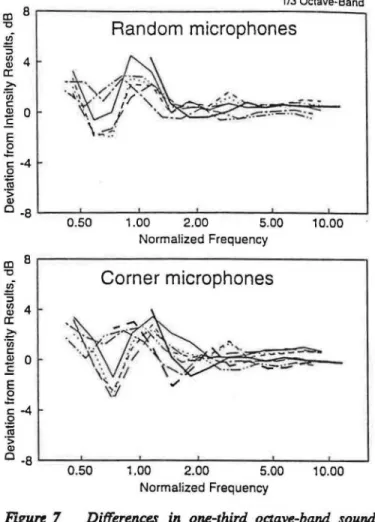
form. An example is shown in Figure 7 using normaliu:d
frequency for the same pair of sources. To provide an estimate of the bias errors one can get with different
sources
in
different rooms, the data in Figure 7 and similardata for two other sources have been averaged and are shown in Table 2. Table 3 shows the corresponding octave-band results. These data show that the bias error depends
on the type of the unknown source.
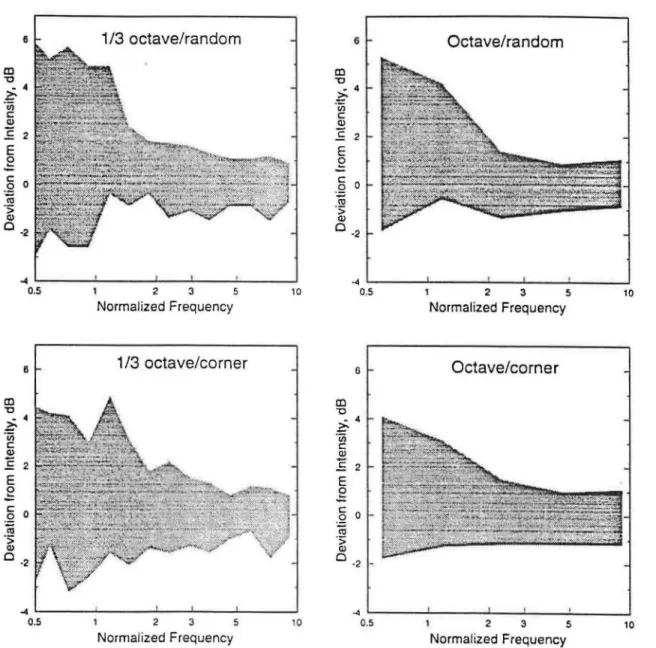
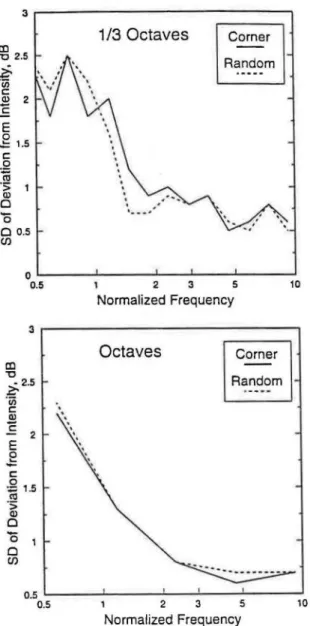
To get an overview of the accuracy and reproducibility of the substitution method, the data were condensed further. Figure 8 shows the maximum and minimum range of the differences between the power levels measured by the substitution method and those measured by the intensity method. The differences are for the large monopole and dipole and the metal box measured using the modified fan as the reference sound source in eight room configurations. Data were also analyu:d in octave bands and plotted in Figure 8. This figure gives an idea of the range of the errors one might get for unknown sources. For further insight, Figure 9 shows the standard deviations of the
differences for the same data. It is interesting that the
ranges and standard deviations for octave bands are not significantly less than those for one-third octave bands.
The following observations were made concerning the accuracy of the measured sound power levels:
1. The accuracy of the substitution method at low frequen-cies varies with the room used but not significantly with microphone arrangement.
CD "'0 !§ "S 1/) Q) a: 1!::' ·u; c: Q)
.E
Ee
8 4 0 セ@ ·4 .Q iii>
Q) 1/3 Octave-BandRandom microphones
c MX セMMMlMMMMセMMMM MM セ MMMMMMMlMMMMセMMセ@ 0.50 1.00 2.00 5.00 10.00 Normalized Frequency CD X イMMMMMMMMMMMMMMMMMMMMMMMMMMMMMMMMM MMセ@ "'0 !§ "S :(l 4 a: セ@ ·u; c: Q) 0£
Ee
セMT@ .Q iii·s:
Q)Corner microphones
」MX セMMセMMMMセ MMMM セ MMMMMMMMセMMMM セ セ@ 0.50 1.00Figure 7
2.00 5.00 10.00 Normalized FrequencyDifferences in one-third octave-band sound power level by the intensity and substitution methods for the large monopole. The modified
fan is the reference sound source. Two sam-pling merhods in eight room configurations.
TABLE 2 1/3 Octave band Nonnalized Frequencv 0.46 0.59 0.73 0.92 1.18 1.47 1.84 2.31 2.94 3.67 4.63 5.88 7.35 9.18
Means and Standard Deviations of the Bias Error of the Substitution Method Using the Modified Fan as the Reference Sound Source
(wConectw eound powerw were me . . ured by the inteneity ecan method.t
Large Dipole Metal Box Large Monopole
Comer Random Comer Random Comer Random
Mean Si!!ma Mean Siema Mean Sie:ma Mean Siema Mean Siema Mean sゥセイュ。@
-2.1 0.9 ·2.1 1.0 2.5 1.6 2.5 2.0 2.4 1.0 0.9 0.8 -0.9 0.5 -1.1 0.6 1.8 2. 1 0.8 3.0 0.7 1.1 -0.2 1.9 -1.6 1.2 -1.4 1.0 2.8 1.0 3.3 1.3 -0.5 2.5 0.6 1.9 -1.4 0.9 -1.3 1.2 1.9 1.4 2.8 1.2 1.6 1.0 1.3 1.2 -0.7 0.8 0.3 0.7 3.2 !.I 2.9 1.2 2.2 1.3 1.8 1.3 -0.1 0.2 0.1 0.4 0.7 1.7 0.9 1.0 0.3 1.3 0.5 0.5 0.6 0.9 0.8 0.8 '·0. 1 0.8 0.0 0.6 -0. 1 0.8 0.4 0.5 0.9 1.0 0.7 0.8 -0.7 0.9 -0.9 0.5 0.1 0.5 0.0 0.3 0.3 0.7 0.4 0.7 -0.5 0.7 -0.4 0.7 0.3 0.8 0.1 0.8 0.3 0.8 0.5 0.8 -0.8 0.9 -0.8 0.8 0.2 0.4 0.0 0.4 0.3 0.4 0.6 0.5 -0.3 0.5 -0.4 0.4 0.1 0.5 0.2 0.3 0.4 0.5 0.6 0.4 -0.4 0.2 -0.4 0.3 0.3 0.5 0.2 0.3 0.4 0.6 0.7 0.6 -0.8 0.8 -0.7 0.5 0.3 0.5 0.2 0.4 0.3 0.4 0.4 0.4 -0.5 0.5 -0.5 0.2 . 0.2 0.5 0. 1 0.4
Octave Band
TABLE 3
Means and Standard Deviations of the Bias Error of the Substitution Method Using the Modified Fan as the Reference Sound Source
!•Correct• aound powe,. were meaaured by the intenaity acan method.)
Large Dipole Metal Box Large monopole
Normalized Comer Random Comer Random Comer Random
Frequency Mean Sigma Mean Sigma Mean
0.59 1.18 2.31 4.63 9.18 Ill "0 6 - 4 セ@ "iii c Cll
£
2 E_g
.§
0 (ij "5 Cll 0 ·2 -1.4 -0.5 0.5 0.2 0.5 0.4 -0.8 0.7 3.2 0.5 -0.1 0.3 1.7 0.9 0.5 0.7 -0.5 0.4 0.4 0.4 -0.6 0.4 0.9 0.2 -0.51/3 octave/random
セ@ セMMMMセMMMMMMセMMセMMMMセMMMMセ@ 0.5 6 Ill "0 セT@ "iii c: Cll£
2 E_g
.§
0 (ij "5 Cll 0 ·2 1 2 3 5 10 Normalized Frequency1/3 octave/corner
セ@ セMMMMセMMMMMMセMMMlMMMMセMMMMセ@ 0.5 1 2 3 5 10 Normalized FrequencySigma Mean Sigma Mean Sigma Mean
1.0 1.0 0.8 0.5 0.7 Ill "0 3.9 2.2 -0.6 -0.6 -0.5 6
:!-4
"iii c Q)£
2 E Q.§
0 (ij "5 Cll 0 ·2 1.1 1.3 0.9 0.4 0.3 0.0 1.6 1.1 1.1 0.9 1.3 0.1 0.5 0.2 0.3 0.5 . 0.5 0.4 0.4 0.7Octave/random
·4 セMMMMセMMMMMMセMMMlMMMMセMMMMセ@ CD "0 0.5 6 - 4 セ@ "iii c: Q)£
2 E_g
.§
0 (ij "5 Q) 0 ·2 1 2 3 5 10 Normalized FrequencyOctave/corner
セ@ セMMMM⦅NMMMMMMセMMMlMMMMセMMMMセ@ 0.5 1 2 3 5 10 Normalized Frequency Sigma 1.6 0.7 0.6 0.4 0.2Figure
8
Maximum and minimum values for the differences in one-third octave-band and octave-band sound power levelby the intensity and substitution methods for the large monopole and dipole and the metal box.. The modified
Sセ MMMMMMMMMMMMMMMMMMMMMMMMMMセ@ lD "'0 2.5
;:.
"iii c: Q) 2c
E_g
1.5 c: . 2 iii ·:; 1 Q) 0 0 0 0.5 (Jj1/3 Octaves
Corner Pセ MMMMセMMMMセセMMセMMセMMMMセ@ 0.5 2 3 5 10 Normalized Frequency SセMMMMMMMMMMMMMMMMMMMMMMMMMMセ@ lD "'0 ;:. 2.5 ·v; c: Q)c
2 E_g
c:2
1.5 Cll ·:; Q) 0 0 1 0 (Jj Fzgurt9.
'Octaves
Corner Random 1 2 3 5 Normalized Frequency 10Standard deviation of the differences in one-third octave-band and octave-band sound power level by the intensity and substitution methods for the large monopole and dipole and the metal box. 1he modified fan is the reference sound source.
2. The accuracy of the substitution method at low frequen-cies depends on the similarity between the unknown and the reference sound source.
3. Taking the sound power from intensity measurements as correct, the data in Figure 9 suggest that 95% of sound power measurements made by the substitution method should be "correct" within ±2 dB above a
normalized frequency of 1.5 (80 Hz in the 250-m3
room) and within
±
5
dB below that frequency.Single-Frequency Results
Results from the single-frequency work were much less
satisfactory. In general, plots of the measured standard
deviation of sound pressure level for a single source position have a jagged appearance, with standard deviations
being much higher at frequencies that did not coincide with
the room resonance frequencies. The comer and edge microphones gave slightly lower standard deviations at the room resonance frequencies than the other microphone configurations. A rotating vane was effective only for
frequencies whose half-wavelengths were less
than
theaverage linear dimension of the vane .
Figure 10 shows the standard deviation of the average
SPL (s6) as a function ofnormali:red frequency for random
microphones and the large monopole in several different rooms. The corresponding curves for other microphone
arrangements and sources are similar; s 1 varies quite
strongly with room and source type.
To illustrate the reproducibility and accuracy of the
substitution method for single-frequency measurements, differences between average sound pressure levels from two sources for all model room configurations are plotted in Figure 11; the shaded areas indicate the range of results. Differences between the powers determined by the intensitv
method for the two sources involved are also plotted. AB
expected, the reproducibility is worse
than
the one-thirdoctave-band results, and the differences from the intensity results are larger. The following observations can be made: 1. Even with single-frequency excitation, there was no strong evidence that comer microphones were better
than randomly spaced microphones when multiple
source positions were used.
2. The accuracy of the substitution method for single
frequencies at low frequencies depends on the room
14 lD "'0 ..J 12
a..
en
セ QP@ セ@ Q) > 8 <: 0 c: .2 6-ro
·:; Q) "'0 4 "E Cll '0 c: 2 Cll Ci5 0 Fzgurt 10 0.5 Random microphones Large monopole 1 2 3 Normalized frequencySingle-frequency standard deviations of rhe average SPL,
s
1, vs. no17'1UJlizedfrequency for eight different room configurations excited by the large monopole. 1he results are for rhe random and comer 。イイ。ョァセュウ@ of theQU セセ セ セセセセセセセセセセセセセセセセ@ !g 10 ai
g
5 l!! セ@ 0 i5 セ@ -5 C/) セMQP@ セ@ セ@ -15 <( Random ·::.
MRP uMセセセセセ セ セセセセセセセセセセセセ@ 66.5 80.0 90.5 108.5 120.5 130.0 166.0 240.5 394.5 73.5 86.0 97.0 114.0 123.0 132.5 196.0 329.5 478.0 Frequency, Hz QU イMMM MMMMMMMMMMMMMMMMMMMMMMMMMMMMMM MMセ@ !g 10 ai g 5 Q)セ@
0 i5 セ@ -5 C/) セMQP@ セ@ セ@ -15 <( Corner MRP uMセセセセ セセセセセセセセセセセセセ Mw@66 .5 eo.o 90.5 1oe.5 120.5 13o.o 166.o 240.5 394.5 73 .5 66 .0 97.0 114 .0 123.0 132.5 196.0 329.5 478 .0
Frequency, Hz
Figure
11
Single-frequency average SPL differences between the large dipole and the large mono-pole obtained by the random and corner arrangements of microphones.and on the source type. Deviations from the values
obtained from intensity measurements ranged from +18 dB to -10 dB.
CONCLUSIONS
The main conclusions from the research:
1. The substitution method is the most suitable method for
measuring sound power at low frequencies in existing laboratories. No special room modifications or micro-phone sampling techniques are required. The accuracy and the reproducibility of the method seem acceptable, although an interlaboratory study is needed to verify this.
2. Requirements for microphone separation and source locations should still be governed by the existing ANSI S12.31 standard, since they would be used in normal sound power measurements. The statistical information in the body of the report can serve as a guide for establishing criteria for the acceptance of rooms for low-frequency sound power measurements.
3. Based on this limited set of results, the accuracy and repeatability standard deviation of the substitution method for one-third octave-band measurements
increases from about 2 dB at a normalized frequency of
2 (125Hz in the 8,857-ftl [250-m3] room) to about
5
dB at normalize4 frequencies of
0.5
(32 Hz in the8,857-ftl [250-m3] room).
4. Accuracy for single-frequency measurements was much
worse than that for one-third octave bands; differences
from intensity measurements ranged from
+
18 dB to-10 dB.
Some other findings from the research:
a. For a fixed source position, comer microphones gave
the lowest spatial variance of sound pressure level for both one-third octave-band and single-frequency measurements. However, when the standard deviation of these average SPI..s for different source positions was used as a criterion, no one microphone system was
found to be significantly better than any other. The
variance in mean sound pressure level caused by moving the source was so large that any benefits due to
the use of comer ュゥ」イッーィッョセ@ were lost.
b. Rotating vanes or low-frequency absorbers had no
significant effect on the spatial standard deviation of SPL for the one-third octave-band measurements, although there was some improvement for the
single-frequency measurements. It is difficult to design a
rotating vane that is effective at the lowest frequencies of interest because its size is limited by the size of the room.
c. Sources can be calibrated reasonably accurately above
63 Hz using the intensity scan method.
These conclusions apply to the procedures followed in this project, where multiple source positions were used and
the sources were all comparatively small. Where a
labora-tory must estimate the power from a fixed object, such as the outlet of a duct system, then one must expect greater bias in the measurement. It is possible that a correction
spectrum could be generated for such a laboratory that
would compensate for the use of a single source position. This is, however, speculative and needs further investi-gation.
RECOMMENDATIONS
There are unanswered questions, and further work needs to be done. Thus, we recommend the following:
1. Interlaboratory measurements of the variation of global average SPL differences between a few more loud-speaker sources and a reference source to determine the
reproducibility of the substitution method at low
2. Investigation of the calibration of reference sound sources at low frequencies using the fixed-point intensi-ty method, measurements in large hemi-anechoic rooms, or measurements in very large reverberant rooms or arenas.
3. Some investigation of methods for dealing with
situa-tions where measurements ュセエ@ be made with a single
source position.
ACKNOWLEDGMENTS
The authors are grateful for the support of the members
ofTC 2.6 in carrying out this research. We thank Dr. R.E.
Halliwell for his contributions in the design of instrumenta-tion and computer software, J.A. Birta for her assistance in
the experimental wolk:, and Dr. J.D.
Quirt
for hiscom-ments and advice.
REFERENCES
ANSI. 1990a. ANSI S12.31-1990, Precision methods for the determination of sound power levels of broad-band noise sources in reverberation rooms (revision of ANSI Sl.31-1980). American National Standards Institute. ANSI. 1990b. ANSI 512.32-1990, Precision methods for
the determination of sound power levels of discrete
fre-quency and narrow-band noise sources in reverberation
rooms (revision of ANSI Sl.32-1980). American National Standards Institute.
ASTM. 1979. ASTM E 691, Standard practice for conduct-ing an interlaboratory test program to determine the
precision of test methods. American Society for Testing of Materials.
Baade, P.K. 1971. Equipment sound power measurements
in reverberation rooms. J. Sound Vib. 16: 131-135.
Baade, P.K. 1988. Low frequency problems in the determi-nation and application of equipment sound power data.
Proc. Noise-Con 88,
pp.
441-446.Bartel, T.W., S.L. Yaniv, and D.R. Flynn. 1983. Use of comer microphones for sound power measurements in
a reverberation chamber. J. Acoust. Soc. Am. 74(6):
1794-1800.
Chu, W.T. 1980. Eigenmode analysis of the interference
patterns in reverberant sound fields. J. Acoust. Soc.
Am. 68(1): 184-190.
ISO. 1981. ISO 5725 (E), Precision of test
methods-De-termination of repeatability and reproducibility by inter-laboratory tests. International Standards Organization. Luhman, D. 1974. Review of reverberation sound power
measurement standard and recommendations for future research. National Bureau of Standards, Tech. Note 841.
Maa, D.Y. 1989. Sound power in reverberation chamber.
13th ICA 3: 185-188.
Morse, P.M. 1948. Vibration and sound. New York:
McGraw-Hill.
Schroeder, M.R. 1962. Frequency-correlation functions of
frequency
responses
in rooms. J. Acoust. Soc. Am.34(12): 1819-1823.
Waterhouse, R.V. 1958. Output of a sound source in
a
reverberation chamber and other reflecting environments.