https://doi.org/10.4224/12328438
READ THESE TERMS AND CONDITIONS CAREFULLY BEFORE USING THIS WEBSITE.
https://nrc-publications.canada.ca/eng/copyright
Vous avez des questions? Nous pouvons vous aider. Pour communiquer directement avec un auteur, consultez la
première page de la revue dans laquelle son article a été publié afin de trouver ses coordonnées. Si vous n’arrivez pas à les repérer, communiquez avec nous à PublicationsArchive-ArchivesPublications@nrc-cnrc.gc.ca.
Questions? Contact the NRC Publications Archive team at
PublicationsArchive-ArchivesPublications@nrc-cnrc.gc.ca. If you wish to email the authors directly, please see the first page of the publication for their contact information.
For the publisher’s version, please access the DOI link below./ Pour consulter la version de l’éditeur, utilisez le lien DOI ci-dessous.
Access and use of this website and the material on it are subject to the Terms and Conditions set forth at
Field Study of Ice Characteristics off the Western Coast of Newfoundland
Johnston, Michelle
https://publications-cnrc.canada.ca/fra/droits
L’accès à ce site Web et l’utilisation de son contenu sont assujettis aux conditions présentées dans le site LISEZ CES CONDITIONS ATTENTIVEMENT AVANT D’UTILISER CE SITE WEB.
NRC Publications Record / Notice d'Archives des publications de CNRC: https://nrc-publications.canada.ca/eng/view/object/?id=2635dedc-20b2-431b-9430-3db96be12746 https://publications-cnrc.canada.ca/fra/voir/objet/?id=2635dedc-20b2-431b-9430-3db96be12746
M. Johnston
Canadian Hydraulics Centre
Technical Report HYD-TR-039
12 May 1999
M. Johnston
Canadian Hydraulics Centre
Technical Report HYD-TR-039
ABSTRACT
This report is a brief description of the field program conducted off the Western Coast of Newfoundland from 7 - 22 March 1999. The intent of the field program was to characterize the ice regime in this area of the Gulf of St. Lawrence. The measured ice properties included the floe size and ridge spacing, the mechanical strength of the ice, sail block size, the ridge topography and snow depth. Ice cores were extracted to determine the ice thickness, the macrostructural properties of the ice, the salinity, temperature and density of the ice. This report documents the ice temperature, salinity, and ridge topography. Some preliminary results of the in situ mechanical strength of the ice are discussed.
TABLE OF CONTENTS
ABSTRACT ... i
TABLE OF CONTENTS ... ii
LIST OF FIGURES... iii
1. INTRODUCTION ...1
2. OBSERVATIONS BY SITE ...2
2.1 Site 1 St. Genevieve Bay (51o09′, 56o52′) ...2
2.2 Site 2 Flowers Cove (51o 18.75, 56 o 45.57)...5
2.3 Site 3 Flower’s Cove (51o 18.77, 56 o 45.44) ...9 2.4 Site 4 (51o 25.73, 56o 53.17) ...12 2.5 Site 5 (51o 10.29, 57o 52.30) ...14 2.6 Site 6 (51o 18.76, 57o 17.77) ...16 2.7 Site 7 (51o 07.24, 57o 23.96) ...18 2.8 Site 8 (51o 18.98, 57o 00.76) ...22 2.9 Site 9 (51o 19.62, 56o 48.01) ...25 2.10 Site 10 (51o04, 56o53)...28
2.11 Site 11 Otter Pond (51o04, 56o53) ...28
2.12 Site 12 Eddy’s Cove (51o25, 56o27)...29
3. DISCUSSION...31
4. CONCLUSIONS...31
5. ACKNOWLEDGEMENTS ...32
LIST OF FIGURES
Figure 1 09 March RADARSAT ScanSAR image ...2
Figure 2 Schematic of Site 1 ...3
Figure 3 Survey line 1 of the ridge profile taken perpendicular to ridge crest ...3
Figure 4 Ice salinity at Site 1 ...4
Figure 5 Schematic of Site 2 ...5
Figure 6 Line 1, Site 2 ...6
Figure 7 Line 2, Site 2 ...7
Figure 8 Line 3, Site 2 ...7
Figure 9 Site 2 (a) Ice macrostructure and (b) Ice temperature and salinity ...8
Figure 10 Examined ridge at Site 3 ...9
Figure 11 Schematic of Site 3 ...10
Figure 12 Line 1, Site 3 ...11
Figure 13 Line 2, Site 3 ...11
Figure 14 Site 3 ice temperature and salinity ...12
Figure 15 Schematic of Site 4 ...13
Figure 16 Line 1, Site 4 ...13
Figure 17 Line 2, Site 4 ...14
Figure 18 Line 3, Site 4 ...14
Figure 19 Schematic of Site 5 ...15
Figure 20 Line 1, Site 5 ...15
Figure 21 Line 2, across ridge at Site 5...16
Figure 22 Schematic of Site 6 ...17
Figure 23 Line 1, Site 6 ...17
Figure 24 Line 2 Site 6 ...18
Figure 25 Schematic of Site 7 ...19
Figure 26 Examined shear ridge of Site 7 ...19
Figure 27 Line 1, Site 7 ...20
Figure 28 Line 2, Site 7 ...20
Figure 29 Line 3, Site 7 ...20
Figure 30 Site 7 (a) Ice macrostructure and (b) temperature and salinity ...21
Figure 31 Schematic of Site 8 ...22
Figure 32 Line 1, Site 8 ...23
Figure 33 Line 2, Site 8 ...23
Figure 34 Line 3, Site 8 ...23
Figure 35 Site 8 (a) Ice macrostructure and (b) temperature and salinity ...24
Figure 36 Core of the consolidated layer of ice from Site 8 ...25
Figure 37 Schematic of Site 9 ...25
Figure 38 Line 1, Site 9 ...26
Figure 40 Line 3, Site 9 ...26
Figure 41 Site 9 (a) Ice macrostructure and (b) temperature and salinity ...27
Figure 42 Ice temperature and salinity from Site 10...28
Figure 43 Schematic of Site 12 ...29
Figure 44 Measurements on the landfast ridge of Site 12 ...29
Field Study of Ice Characteristics off the
Western Coast of Newfoundland
1. INTRODUCTION
The ice regime off the Western Coast of Newfoundland was characterized during a field program from 7 - 22 March 1999. The field program was a joint industry project that was funded by both industry and the Panel on Energy Research and Development (PERD).
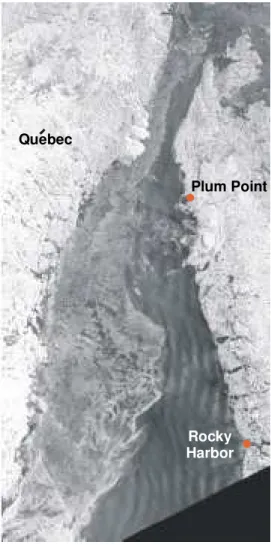
The central and southern portion of the Western Coast of Newfoundland, from Parson’s Pond to Stephenville, are of particular interest to hydrocarbon development. The 1999 field program was initially scheduled to operate from Rocky Harbor, near Cornerbrook. Since the 1998-99 winter was milder than normal, landfast ice did not become established along the central portion of the Western Coast of Newfoundland. Rather, the ice was dispersed throughout the Gulf that year, as illustrated by the RADARSAT image from 9 March 1999 in Figure 1. Since it was not feasible to work from the Cornerbrook area, base operations were moved north to Plum Point. From Plum Point, the ice that had accumulated along the Québec shore and the ice entering the Gulf through the Strait of Belle Isle could be accessed.
During the field project, the weather proved to be quite difficult. The predominant wind direction was offshore, resulting in the accumulation of ice along the Québec coastline. Of the two weeks spent in the field, only two days were clear enough to enable flying by helicopter to the ice offshore. The weather during subsequent days resulted in frequent snow showers, high winds, blizzard conditions and freezing rain. In spite of the less than favorable conditions, a significant amount of information was obtained on the general ice properties and the nature of the pack ice and first year ice ridges in the Gulf of St. Lawrence. This report provides a synopsis of some of the material collected on the ice properties from ten first year ice ridges that were examined during the Western Coast of Newfoundland field campaign.
Plum Point
Rocky Harbor Quebec
Figure 1 09 March RADARSAT ScanSAR image of the ice conditions between the Northern Peninsula of Newfoundland and Québec (courtesy of
Canadian Ice Services)
2. OBSERVATIONS BY SITE
2.1 Site 1 St. Genevieve Bay (51o09′′′′, 56o52′′′′)
On 9 March 1999, a reconnaissance was performed of the ice along a portion of the coast along the Northern Arm of Newfoundland. For the most part, there was very little landfast ice south of Plum Point. A few small ridges were noted near New Ferolle Point, outside of the bay at Plum Point, but these ridges were not sufficient for detailed analysis. A first year ridge, about 70 m long and 2 m high, in the landfast ice at the mouth of St. Genevieve Bay (north of Plum Point) was selected as Site 1. Ice blocks in the sail of the ridge were, quite uniformly, about 0.30 m thick, with some larger tabular ice blocks noted.
The field party landed at Site 1 on the afternoon of 9 March and a survey line was drawn across the centre of the ridge. The ice thickness was documented by drilling nine 50 mm auger holes every 5 m along the survey line (Figure 2). Ice thickness profiling revealed that the level ice thickness of Site 1 was about 0.40 m. The profile of the ridge sail was also surveyed at 5 m intervals along Line 1. The results of the ridge topography are presented in Figure 3, which shows that the ridge crest was 2.6 m. The ridge keel was over 8 m thick (the maximum length of auger taken that day) at a distance of 15 m on either side of the ridge crest. VV VVVVVVVV VVV VVVVVVVVVVVVVVVVVVVVV VVVVVVVVVVVVVV V V V VVV VV
Line 1 End of survey
line
ice auger holes, every 5 m ridge survey line
ridge profile surveyed every 5 m Sampling station 3
0.66 m of solid core retrieved for ice salinity measurements
Sampling station 2 core auger produced
broken pieces of ice
Sampling station 1, 0.40 m thick level ice
45 m
0 m
Figure 2 Schematic of Site 1
0 1 2 3 4 0 10 20 30 40 50 Distance (m) S ai l hei ght ( m ) Site 1 - Line 1
core for salinity measurements
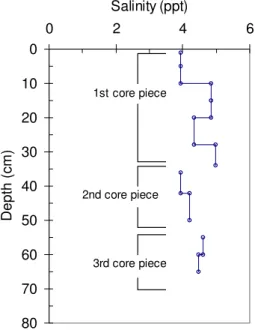
A mechanical core auger was used to extract an ice core 10 m from the start of the survey line, as noted in Figure 2. The core that was retrieved from that station consisted of numerous broken pieces of ice. To obtain a less fractured core, a second core was extracted from the 15 m station along the survey line. The second core produced three pieces of ice, with a total length of 0.66 m. The temperature profile of the solid ice fragments (and occasionally slush) was measured. A hand saw was used to section the core fragments into 50 mm sections, which were sealed in individual plastic bags for salinity measurements. The temperature profile and ice sectioning process were performed as quickly as possible to avoid air temperature effects and to minimize brine drainage from the ice. Frequently, the unused portion of the core was returned to the auger hole until it was ready to be sectioned for salinity samples, thereby further minimizing brine drainage. The coring process continued until the full thickness of the ice had been sampled.
After transporting the ice salinity samples from Site 1 to the hotel, the bags were taken from the cooler and the ice was left to melt at room temperature. A calibrated conductivity meter was used to measure the ice salinity. Figure 4 shows that the ice salinity of the top 0.66 m of core was between 4 - 5 ppt. The notation of open circles and broken lines used to represent the salinity profile in Figure 4 reflects the length of ice core that was melted (for instance 0 - 50 mm, 50 - 100 mm, etc.). Breaks in the line show where the core had fragmented in the core auger.
0 10 20 30 40 50 60 70 80 0 2 4 6 Salinity (ppt) Dept h (c m) 1st core piece 2nd core piece 3rd core piece
2.2 Site 2 Flowers Cove (51o
18.75, 56 o
45.57)
Site 2 was a first year ridge that was located in the landfast ice (about 1 km from Anchor Point lighthouse) near Flower’s Cover, north of St. Genevieve Bay. The morning of 10 March 1999 was spent sampling the ridge. The weathered appearance of the ridge at Site 2 indicated that it was older than the ridge at Site 1. The ridge topography was measured by surveying the sail on three survey lines, at various intervals (Figure 5).
0 m
V
VVVV
VVVVVVVV
V
V
V
V
VVVVVVVVVVVVVVVVV
VVVVVV
VVVV
VVVV
VVVV
V
20 m 20 m 34 m 24 m Line 1 Line 2 Line 3 Ridge End of survey line 0 m 0 m 90 m 110 m 80 mice auger holes ridge survey line ridge profile surveyed every 5 m ice core removed
for salinity, temperature
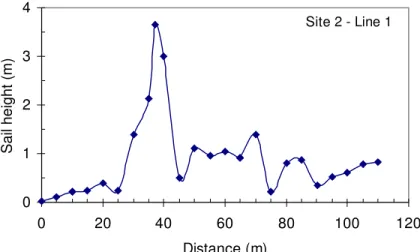
Figure 6 and Figure 7 show profiles of the ridge, which had a height of about 3.5 m. The dimensions of 50 sail blocks were measured. The ice thickness was measured by drilling 13 auger holes on survey line 1 and 5 auger holes on survey line 2. The auger holes revealed that Site 2 was a grounded ridge, with 7 m water depth on one side and less than 1 m water depth on the opposite side.
An ice core was extracted from Line 1 (see Figure 5). A vertical profile of the ice macrostructure (Figure 9a) was determined from comments made during core extraction, the amount of retrieved core and the state of the retrieved core (slush, corn ice, solid core, etc.). Since the retrieved core consisted of fragmented pieces of solid ice, voids, and compressed slush, it became progressively difficult to determine the true depth of the ice core with increasing ice depth. As the core was being retrieved, the person taking the core would comment upon the “feel” of the ice and, knowing the length of the core barrel, would estimate the depth of ice being cored. The barrel was emptied and the amount of solid core that was retrieved was noted. The ice fragment was assigned a depth, the ice temperature was measured and the core fragment was sectioned for salinity and density measurements. Profiles of the ice temperature and salinity are presented in Figure 9b. 0 1 2 3 4 0 20 40 60 80 100 120 Distance (m) Sai l hei ght ( m ) Site 2 - Line 1
0 1 2 3 4 0 20 40 60 80 100 Distance (m) S ai l hei ght ( m ) Site 2 - Line 2
Figure 7 Line 2, Site 2
0 1 2 3 4 0 20 40 60 80 Distance (m) Sail height (m ) Site 2 - Line 3
0 50 135 170 200 240 250 320 390 corn ice/ snow ice that fell apart as the core barrel was emptied soft ice about 25 cm core recovered after drilling 40 cm of ice
solid with some voids
very soft ice
solid ice reached water at 200 cm
void
soft when drilling mixture of soft and and hard small pieces of ice retrieved from barrel
90
soft ice, barrel full between 250 and 320 cm (a) 0 50 100 150 200 250 300 350 -2 0 2 4 6 Ice temperature (oC) and salinity (ppt) D ept h (c m ) Salinity Temperature corn ice that fell apart
soft ice
no core retrieved
(b)
Figure 9 Site 2 (a) Ice macrostructure obtained from comments during drilling and (b) Ice temperature and salinity
2.3 Site 3 Flower’s Cove (51o
18.77, 56 o
45.44)
A first year ice ridge in Flower’s Cove was selected as Site 3 (about 1 km south of Site 2). Site 3 was examined on four different days (11, 14, 15 and 16 March), allowing an extensive amount of work to be done on that site. The ridge at Site 3 was grounded on a shoal (in about 5.5 m of water) and had a large (15 m x 15 m) slab of smooth ice to the north. Figure 10 shows Site 3 and the four large ice blocks (about 1 m thick) that were excavated from the ridge.
Figure 10 Examined ridge at Site 3 (image taken on 14 March)
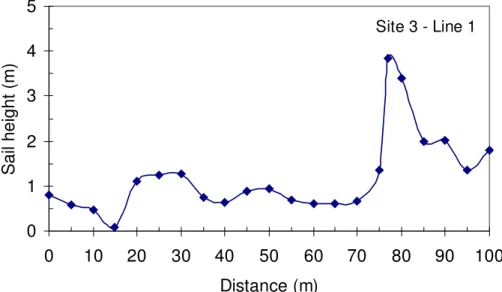
Figure 11 presents a schematic of Site 3. Two survey lines were drawn to determine the surface profile of the 3.5 m high ridge, as shown in Figure 12 and Figure 13. Profiles of the keel were obtained from four well-documented auger lines. The dimensions of 50 ice blocks in the sail were measured. Temperature, salinity (Figure 14) and density measurements were made on ice cores from two stations, Station 65 and Station 70 (shown in Figure 11). Salinity and density measurements were made by using, alternately, 50 mm thick sections of ice from the same core, resulting in the broken profile shown in Figure 14. The salinity of the seawater at Site 3 was 28 ppt.
Interesting pieces of the cores were saved from Site 3 for crystallographic work. In addition, a solid core (about 1 m thick) was obtained from one of the blocks that was excavated near Stations 65 and 70. The mechanical strength of the ice was tested at 11 stations (0.25 m depth intervals for each hole) using the borehole jack indentor. The in situ strength tests indicated that the maximum ice crushing strength was 11 MPa at a depth of 0.51 m (borehole jack displacement of 40 mm). The ice failure stress reduced to 4 MPa at a depth of 3 m (displacement of 10 mm) and then decreased further to zero at an ice depth of 3.5 m.
V
V
V
V
V
V
V
V
V
V
V
V
V
V
V
V
V
V
V
V
V
V
V
V
V
V
V
V
V
V
V
V
V
V
V
V
V
V
V
V
V
V
V
V
V
V
V
V
V
V
V
V
V
V
V
V
V
V
V
V
V
V
V
V
V
V
V
V
V
V
V
V
25 m Line 1 Line 2 65 70 Ridge End of survey line 0 m 50 m 0 m 100 mridge survey line ridge profile surveyed every 5 m Sampling stations 65 and 70
core retrieved for ice salinity measurements four blocks excavated
from the consolidated layer of ice
0 1 2 3 4 5 0 10 20 30 40 50 60 70 80 90 100 Distance (m) S a il hei ght (m ) Site 3 - Line 1
Figure 12 Line 1, Site 3
0 1 2 3 4 5 0 10 20 30 40 50 60 Distance (m) S a il hei ght (m ) Site 3 - Line 2
0 50 100 150 200 250 300 350 400 450 -2 0 2 4 6 8
Ice temperature (oC) and salinity (ppt)
Depth ( c m ) Salinity Temperature
ice core also used for density measurements, resulting in broken salinity profile
0 50 100 150 200 250 300 350 400 -2 0 2 4 6
Ice temperature (oC) and salinity (ppt)
Depth (
c
m)
Salinity
Temperature
ice core also used for density measurements, resulting in broken salinity profile
Figure 14 Site 3 ice temperature and salinity from (a) Station 65 and (b) Station 70
2.4 Site 4 (51o
25.73, 56o
53.17)
On 13 March the field party examined Sites 4, 5 and 6 during a flight to the Québec shore. Sampling a number of ridges in one day allowed only an examination of the surface topography of the ridge, ice thickness, snow depth and sail block dimensions. Ice cores were not retrieved for salinity, temperature and density measurements or crystallography.
On the way to Québec, it was found that the receding ice had left Sites 1 and 2 on the edge of the landfast ice. The flight over the Gulf of St. Lawrence revealed that the dominant floe size in this region of the Gulf was about 100 m, with some larger floes about 300 m in diameter.
Site 4 was selected as an older, drifting floe that appeared to be weathered by spray or rain. The morning of 13 March was spent examining the 100 m x 100 m floe. A schematic of Site 4 is shown in Figure 15. Three survey lines were drawn over the ridge sail, the results of which are shown in Figure 16, Figure 17, and Figure 18. Sail block dimensions were documented. Ice thickness was measured from three auger holes that revealed a 0.70 - 1.10 m thick layer consolidated of consolidated ice.
V
V
V V
V
V
V
V
V
V
V
V
V
VV
VV
V
V
V
V
V
VV
V
V
V
V
V
V
V
V
V
V
V
V
V
V
V
VV
V
V
V
V
V
V
V
V
V
V
V
V
Line 1 Line 3 Line 2 13 m 15 m 15 m 25 mFlat ice floe
0 m 0 m 0 m 60 m 65 m 70 m
ice auger holes, freeboard measurements ridge survey line
ridge profile surveyed every 5 m
Figure 15 Schematic of Site 4
0.0 0.5 1.0 1.5 2.0 0 10 20 30 40 50 Distance (m) Sail height ( m ) Site 4 - Line 1
0.0 0.5 1.0 1.5 2.0 0 10 20 30 40 50 60 Distance (m) Sai l hei ght (m ) Site 4 - Line 2
Figure 17 Line 2, Site 4
0.0 0.5 1.0 1.5 2.0 0 20 40 60 80 Distance (m) Sai l hei ght (m ) Site 4 - Line 3
Figure 18 Line 3, Site 4
2.5 Site 5 (51o
10.29, 57o
52.30)
Site 5, selected as a hummock field of ice, was examined between 12:00 and 14:00 on 13 March. Figure 19 shows a schematic of Site 5. Ridge profiles were obtained by surveying one line perpendicular to the crest of the ridge and another line parallel to the crest (Figure 20 and Figure 21). The rubble pile was about 4 m high and had a crest that was about 35 m long. The dimensions of 100 blocks were measured and three auger holes were drilled for ice thickness. The ice auger holes revealed that the hummock field was grounded in 9 m of water.
V
VVV
V
VVV
VVVVVVVVVVV
VVV
VVV
VVVV V
V
VVVVVV
V
Line 1 Line 2 across crest of ridge Ridge End of survey lineV
35 m 88 m 0 m 0 mice auger holes, freeboard measurements ridge survey line
ridge profile surveyed every 5 m
Figure 19 Schematic of Site 5
0 1 2 3 4 5 0 20 40 60 80 100 Distance (m) Sai l hei ght (m ) Site 5 - Line 1
0 1 2 3 4 5 0 10 20 30 40 50 Distance (m) S ai l hei ght ( m ) Site 5 - Line 2 across crest
Figure 21 Line 2, across ridge at Site 5
2.6 Site 6 (51o
18.76, 57o
17.77)
Site 6 was examined on 13 March, between 14:00 and 15:00 hours. Site 6 was a very hummocked floe, about 200 m in diameter, that had a recently formed ridge on one side. Figure 22 shows a schematic of Site 6. Two lines were surveyed across the ridge, the results of which are shown in Figure 23 and Figure 24. The four auger holes that were drilled revealed that the consolidated layer of ice was about 1 m - 1.5 m thick, with voids about 0.10 m being encountered (fairly consistently) with increasing depth. The dimensions of 100 sail blocks were measured.
V V V V V V V V V V V VV VVVVVVVVV V V V V V V V V V V V V V V V V V VV V V VVV V V V V V V VVVVVV V V V V V V V V V 25 m 25 m Floe about 170 m x 180 m with recently formed ridge
Line 1 Line 2 0 m 0 m 170 m 155 m
ice auger holes, freeboard measurements ridge survey line
ridge profile surveyed every 5 m
Figure 22 Schematic of Site 6
0 1 2 3 0 20 40 60 80 100 120 140 160 Distance (m) Sai l hei ght (m ) Site 6 - Line 1
0 1 2 3 0 20 40 60 80 100 120 140 160 Distance (m) S ai l hei ght ( m ) Site 6 - Line 2
Figure 24 Line 2 Site 6
2.7 Site 7 (51o
07.24, 57o
23.96)
On 15 March, clear weather permitted the field party to fly offshore. Since it was difficult to find sizeable ridges on large floes, large ridges on floes that were less than 100 m in diameter were decided upon. On 15 March, Sites 7, 8 and 9 were sampled.
Site 7, examined from 10:00 to 12:00 on 15 March, was a floating ridge with a noticeable shear zone (Figure 26). A schematic of Site 7 is illustrated in Figure 25, which shows the three lines that were used to characterize the sail profile (Figure 27, Figure 28 and Figure 29). The ice thickness was determined from two auger holes. The initial and final drift positions of the floe were recorded.
A core was extracted from the ice to determine its vertical macrostructure. As the latter core was being retrieved, the “feel” of the auger was documented, the core barrel was emptied and the dimensions and consistency of the core were noted. The core fragments were then physically pieced together, the appearance of the full core was sketched and the core was sealed in a core-bag. Figure 30 (a) shows the length of actual core that was taken. The consolidated layer of ice was about 1.6 m, however only the uppermost metre of ice produced solid core. Below the first metre, the ice consisted of soft, highly porous ice. A second core was extracted for temperature and salinity measurements, which are presented in Figure 30 (b).
VVV V V V V V V V V V V V V V V V V V V V V V V V V V V V V V V V V V V V V V VV 25 m 20 m Line 1 Line 2 Line 3 X X X X X XX X X X X X X X X X X X X X X X X X X X X X X X X X X X X X X X X X X X X X X X X X X X X X X X X X X X X X X X X X X X X X X X level ice shear ridge rubble rough ice 1 2 3 4 0 m 33 m
ice auger holes, freeboard measurements ridge survey line
ridge profile surveyed at 3-5 m intervals
ice cores removed for salinity, temperature and microstructure
Figure 25 Schematic of Site 7
0.0 0.5 1.0 1.5 2.0 -10 0 10 20 30 40 50 60 Distance (m) Sai l hei ght ( m ) Site 7 - Line 1
Figure 27 Line 1, Site 7
0.0 0.5 1.0 1.5 2.0 -10 0 10 20 30 40 Distance (m) S a il height ( m ) Site 7 - Line 2
Figure 28 Line 2, Site 7
0.0 0.5 1.0 1.5 2.0 -10 0 10 20 30 Distance (m) S a il height ( m ) Site 7 - Line 3
0 40 60 90 110 125 166 void void (a) 0 50 100 150 200 -4 -2 0 2 4 6 8 10 Ice temperature (oC) and salinity (ppt) D ept h ( c m) Salinity Temperature void void void b roken core b roken core (b)
Figure 30 Site 7 (a) Ice macrostructure and (b) Profiles of ice temperature and salinity
2.8 Site 8 (51o
18.98, 57o
00.76)
On 15 March, the field party sampled a small, ridged floe (shown schematically in Figure 31). Three lines were surveyed to characterize the sail profile, the results of which are presented in Figure 32, Figure 33 and Figure 34. The ice thickness was measured from two auger holes. The initial and final drift positions of the floe were recorded. One core was extracted for measurements of ice temperature and salinity (Figure 35). Another core was extracted to determine the vertical profile of ice macrostructure and was retained for future crystallographic studies. The consolidated layer of ice from Site 8 (shown in Figure 36) consisted of broken pieces of solid core interspersed with soft, porous ice and voids.
V V V V V V V V V V V V V V V V V V V V V V V V V V V V V V V V V V 10 m 13 m 13 m 15 Line 1 Line 2 Line 3 1 2 m 0 m 0 m 0 m
ice auger holes, freeboard measurements ridge survey line
ridge profile surveyed at 3-5 m intervals ice cores removed
for salinity, temperature and microstructure
0 1 2 3 4 0 5 10 15 20 25 Distance (m) S a il height ( m ) Site 8 - Line 1
Figure 32 Line 1, Site 8
0 1 2 3 4 0 5 10 15 20 25 Distance (m) S a il height ( m ) Site 8 - Line 2
Figure 33 Line 2, Site 8
0 1 2 3 4 0 5 10 15 20 Distance (m) S a il height ( m ) Site 8 - Line 3
0 45 55 95 100 130 160 220 30 35 slush void void void (a) 0 50 100 150 200 250 -2 0 2 4 6 8 Ice temperature (oC) and salinity (ppt) D ept h ( c m) Salinity Temperature void void void (b)
Figure 35 Site 8 (a) Ice macrostructure and (b) Profiles of ice temperature and salinity
Figure 36 Core of the consolidated layer of ice from Site 8 that was retained for crystallographic studies
2.9 Site 9 (51o
19.62, 56o
48.01)
Site 9 was sampled between 15:30 and 17:30 on 15 March. Figure 37 shows a schematic of Site 9. Three lines were surveyed across the ridge, the profiles of which are shown in Figure 38, Figure 39 and Figure 40. The ice thickness was measured from one auger hole and the initial and final drift positions of the floe were recorded. Again, two cores were extracted, one for temperature and salinity (Figure 41) and the other for inspection of the ice macrostructure and future crystallographic work.
V V V V V V V V V V V V V V V V V V V V V V V V V V V V V V V 9.2 m 12 m 13.4 m 8.8 m Line 1 Line 2 Line 3 X X X X XX X X X X X X X X X X X X X X X X X X X X X small, weathered floe sail rubble
ice auger holes, freeboard measurements ridge survey line
ridge profile surveyed at 5 m intervals
ice cores removed for salinity, temperature and microstructure
0.0 0.5 1.0 1.5 2.0 0 5 10 15 20 25 Distance (m) Sai l hei ght (m ) Site 9 - Line 1
Figure 38 Line 1, Site 9
0.0 0.5 1.0 1.5 2.0 0 5 10 15 20 25 30 Distance (m) Sai l hei ght (m ) Site 9 - Line 2
Figure 39 Line 2, Site 9
0.0 0.5 1.0 1.5 2.0 0 5 10 15 20 25 30 Distance (m) Sai l hei ght (m ) Site 9 - Line 3
slush slush broken core 0 20 40 65 95 110 152 186 197 240 (a) 0 50 100 150 200 -2 0 2 4 6 8 Ice temperature (oC) and salinity (ppt) Dept h ( c m) Salinity Tem perature alternate depths of ice sectioned for
salinity profile
(b)
Figure 41 Site 9 (a) Ice macrostructure and (b) Profiles of ice temperature and salinity
2.10 Site 10 (51o04, 56o53)
Due to the deteriorating weather, the field party was unable to fly offshore on 18 March. As a result, equipment was tested in the level bay ice (about 200 m offshore) at Plum Point. Ice in the bay was 0.71 m thick, from which one core was extracted to measure ice temperature and ice salinity (Figure 42) and another core was retained for ice crystallography. The in situ measurements of ice strength indicated that the maximum crushing strength of the level bay ice was about 11 MPa.
0 10 20 30 40 50 60 70 80 -1.0 -0.5 0.0 0.5
Ice temperature (oC) and salinity (ppt)
D ept h (c m ) Salinity Temperature
Figure 42 Ice temperature and salinity from Site 10
2.11 Site 11 Otter Pond (51o04, 56o53)
Inclement weather on 19 March did not allow access to the ice offshore. The field party moved to Otter Pond, a small lake near Plum Point (accessible from the road), for continued testing of the equipment. Borehole jack profiles of the ice were performed at 6 holes (depth intervals of 0.13, 0.25, 0.49 and 0.63 m). The maximum in situ ice failure stress was 11 MPa at a depth of 0.13 m (displacement of 10 mm).
2.12 Site 12 Eddy’s Cove (51o25, 56o27)
The late afternoon of 19 March and the morning of 20 March were spent examining Site 12, which was accessible from the road (Figure 43). Site 12 was a landfast, first year ridge (Figure 44) that was located near the community of Eddy’s Cove. The ridge was about 2.5 m high and was grounded in 5 m of water. Ice cores were extracted for temperature and salinity measurements (Figure 45) and future crystallographic work. The in situ ice failure stress strength was tested, yielding a maximum crushing strength of about 10 MPa.
V V V V V V V V V V V V V V V V V V V V V V V V V V V V V V V V V V V V V V V V VV V V V V V V V V V V V V V V V V V V V V open water landfast ridge along shoreline tidal crack site camp access route to sampled ridge from road Eddy’s Cove Plum Point x x x x x x x small ridge ice cores removed
for salinity, temperature and microstructure
Figure 43 Schematic of Site 12
Figure 44 Measurements on the landfast ridge of Site 12 (accessed from road
0 15 87 100 124 130 143 160 (a) 0 20 40 60 80 100 120 140 160 180 200 -1 0 1 2 3 4
Ice temperature (oC) and
salinity (ppt) D ept h (c m ) Salinity Tem perature salinity of pieces of retrieved slush/solid core (b)
Figure 45 Site 12 (a) Ice macrostructure and (b) Profiles of ice temperature and salinity
3. DISCUSSION
Ten first year ice ridges were sampled during the field program, some of which were floating, while other ridges were grounded. The crest of the ridges ranged in height from 1.5 m to 4.0 m. Cores retrieved from the first year ridges revealed that the consolidated layer of ice was inhomogeneous. Frequently, the consolidated layer was comprised of snow ice, solid core, and consolidated slush with voids interspersed within and/or between the different layers of ice.
One set of ice cores was retrieved for temperature, salinity and density measurements while another set of cores (taken in close proximity to the first core) was retained for future crystallographic work. Comparison of the cores revealed that the ice macrostructure and bulk physical properties of ridged ice exhibit spatial variability.
The full thickness temperature profiles of the ice showed that the ice was between 0 oC and -2oC. This is to be expected, considering the extremely mild winter temperatures that were seen in the Gulf of St. Lawrence in 1999. The salinity of the examined ridges varied from 0 ppt to 7 ppt, with the top 0.30 m of ice typically having a salinity of 0 ppt. Ice salinity profiles for the consolidated layer were quite irregular. The salinity profile of the ridged ice is in contrast to the uniform “C” shaped salinity profile that generally characterizes level, first year sea ice (Nakawo and Sinha, 1981).
The maximum in situ crushing strength of the ice was 10 MPa for sea ice from two grounded ridges and 11 MPa for the level bay ice near Plum Point. Sinha (1997) measured the in situ failure stress for 0.63 m thick, low salinity (0 - 1.0 ppt) first year sea ice in Botwood Bay, Newfoundland. The author reported an ice failure stress of 10 - 23 MPa for an ice surface temperature of -7oC and average stress rates between 0.02 and 2 MPa/s.
The freshwater ice from Otter Pond had an in situ crushing strength of about 11 MPa. Sinha (1990) measured the in situ strength of columnar grained, freshwater lake ice at the onset of spring thaw, in March. The author reported an ice failure stress from 15 - 25 MPa for ice surface temperatures between -9.2oC and -6.3oC (at stress rates 0.02 - 3 MPa/s). An ice surface temperature of 0oC resulted in an ice failure stress of 5 - 8 MPa (stress rates of 0.02 - .10 MPa/s) for the same ice cover.
4. CONCLUSIONS
Ten first year ice ridges were examined off the Western Coast of Newfoundland, during 7 - 22 March 1999. The data set provides a good representation of both floating and grounded ridges. The ice regime was characterized by measuring the floe size, ridge spacing and the drift velocity of the floes. The surface topography of the ridges was determined by conventional surveying techniques
and the corresponding keel profile was obtained by drilling auger holes, from which the ice thickness was recorded. Snow depths were measured and information on the consolidated layer was provided by salinity, temperature and density measurements. The consolidated layer was also characterized by noting the amount of retrieved core and correlating this with a description of the ice (solid ice, voids, soft ice) while drilling.
This report provides a flavor of the type of measurements taken during the field campaign. The profiles of the ice density, mechanical strength and ice microstructure will be presented in a forthcoming report (K.R. Croasdale and Associates). The field data have yet to be compiled and presented in a unified format. Such an investigation would provide a complete representation of the first year ice ridges on a case-by-case basis.
5. ACKNOWLEDGEMENTS
Field work off the Western Coast of Newfoundland was conducted by K.R. Croasdale and Associates, Ltd. The Canadian Hydraulics Centre managed the program and participated directly in the field studies. Dr. M. Metge, R. Ritch, I. Sheikin and B. Graham were the primary field participants. This report was compiled from personal field notes from the participants and from the report Field Study of Ice Characteristics off the West Coast Newfoundland (K.R. Croasdale and Associates, 1999).
6. RERERENCES
Field Study of Ice Characteristics off the West Coast of Newfoundland, 1999.
Report submitted to the National Research Council of Canada and Exxon Production Research by K.R. Croasdale and Associates, March, 1999.
Nakawo M. and N.K. Sinha, 1981. “Growth Rate and Salinity Profile of First Year Sea Ice in the High Arctic”, Journal of Glaciology, Vol. 27, No. 96, p. 315 - 330.
Sinha, N.K., 1990. Ice Cover Strength Decay Using Borehole Indentor, in Proceedings of 10th International Association for Hydraulic Research (IAHR) Ice Symposium, 20-23 August, 1990, Espoo, Finland, Vol. II, pp. 735-744.
Sinha, N.K., 1997. Borehole In Situ Indentation Tests in Floating Sea Ice at High Temperatures, in Proceedings of 9th International Conference on Fracture