Publisher’s version / Version de l'éditeur:
Proceedings of 19th International Conference on Offshore Mechanics and Arctic
Engineering (OMAE), 14 - 17 February, 2000, New Orleans, Louisiana, pp.
1257-1264, 2000
READ THESE TERMS AND CONDITIONS CAREFULLY BEFORE USING THIS WEBSITE.
https://nrc-publications.canada.ca/eng/copyright
Vous avez des questions? Nous pouvons vous aider. Pour communiquer directement avec un auteur, consultez la première page de la revue dans laquelle son article a été publié afin de trouver ses coordonnées. Si vous n’arrivez pas à les repérer, communiquez avec nous à PublicationsArchive-ArchivesPublications@nrc-cnrc.gc.ca.
Questions? Contact the NRC Publications Archive team at
PublicationsArchive-ArchivesPublications@nrc-cnrc.gc.ca. If you wish to email the authors directly, please see the first page of the publication for their contact information.
This publication could be one of several versions: author’s original, accepted manuscript or the publisher’s version. / La version de cette publication peut être l’une des suivantes : la version prépublication de l’auteur, la version acceptée du manuscrit ou la version de l’éditeur.
Access and use of this website and the material on it are subject to the Terms and Conditions set forth at
Simultaneity of measured ice load on two legs of a multi-leg platform
Johnston, M. E.; Timco, G. W.; Frederking, R.; Jochmann, P.
https://publications-cnrc.canada.ca/fra/droits
L’accès à ce site Web et l’utilisation de son contenu sont assujettis aux conditions présentées dans le site LISEZ CES CONDITIONS ATTENTIVEMENT AVANT D’UTILISER CE SITE WEB.
NRC Publications Record / Notice d'Archives des publications de CNRC:
https://nrc-publications.canada.ca/eng/view/object/?id=4acac017-9d78-4a4d-84ed-39a25b058a28
https://publications-cnrc.canada.ca/fra/voir/objet/?id=4acac017-9d78-4a4d-84ed-39a25b058a28
OMAE-00-1007
SIMULTANEITY OF MEASURED ICE LOAD ON TWO LEGS
OF A MULTI-LEG PLATFORM
M.E. Johnston, G.W. Timco, and R. Frederking
Canadian Hydraulics Centre National Research Council Building M-32, Montreal Rd.
Ottawa, Ontario K1A 0R6 Canada
P. Jochmann Hamburg Ship Model Basin
Bramfelder Straße 164 D-22305 Hamburg
Abstract
Two legs of the Chinese JZ-20 multi-leg platform were instrumented to measure the loads that result from advancing sea ice floes. One leg was equipped with five load panels, which allowed the local load and total leg load to be determined. The other leg was strain-gauged, providing another estimate of the leg load. In 1990, the loads were measured simultaneously on two legs of the platform, providing a unique data set for assessing the resultant load on two legs, in comparison to the total load on an individual leg. The simultaneity of the measured ice load on two legs is examined using a representative sample of the load information from each leg.
Introduction
Full-scale data on the interaction between advancing ice and multi-leg platforms are scarce. That being considered, plus the fact that offshore platforms in the Bohai Sea have experienced severe vibration problems in past winters (Bai et al. 1998; Liu, personal communication), resulted in a Sino-German joint industry project. The project involved the instrumentation of the JZ-20-2-1 (herein referred to as JZ-20) platform, which was undertaken to establish design loads for offshore structures in the Liao Dong Bay. Previously, model tests of JZ-20 platform have also been conducted by Timco et al. (1992) to further the understanding of ice-induced vibrations. The correlation between small-scale and full-scale ice load measurements on the JZ-20 platform were also examined using model tests (Wessels and Jochmann, 1990;1991).
Two of the legs of the JZ-20 platform were instrumented to measure the loads during ice
structure-interaction. This provides a unique data set with which to compare the peak loads that occur on the different platform legs, in terms the magnitude and simultaneity of load. This paper focuses upon a sample record from the 1989-90 winter that was extracted from the more than 80 minutes of data available for comparison of the loads measured on two legs of the platform. Accompanying video records from one of the legs are synchronized with the load-time record, providing an eye-witness account of the ice mechanics of the interaction process. In addition, there is another suite of data from the JZ-20 platform (over 150 minutes total) that may be used to investigate the spatial and temporal variation of local pressures on one of the platform legs.
Background
The JZ-20 is a multi-leg platform that has been used since 1987 in Liao Dong Bay (121o21’E, 40o30’N) of the Bohai Sea (Figure 1). The platform, oriented with the tidal current direction (38o bearing from due
north), has a topside structure of 12 m x 9 m. The topside is supported by four-1.68 m diameter legs (Figure 2). The legs of the JZ-20 platform have a double pipe configuration, which consists of the leg column (in-filled with cement) and a 1.5 m diameter pile. There are two groups of conductor pipes between the legs on the north side of the structure. Support framing for the platform consists of 12 horizontal braces and 24 inclined braces.
Liao Dong Bay JZ-20 Platform Yellow Sea Bohai Sea 40 N 130 E 120 Eo o o
Figure 1 Location of JZ-20 in Liao Dong Bay, China
Figure 2 JZ-20 Platform
Local and global platform loads were measured with load panels and strain gauges. Two types of load panels were installed on the legs of the platform; panels developed by Hamburg Ship Model Basin (HSVA) and ice load panels developed by the Chinese project partners. This paper focuses upon the leg loads that were measured by the HSVA panels and by strain gauges, as discussed below.
Instrumentation
The waterline region of Leg A1 was outfitted with a polygonal steel shield which enabled five HSVA load panels to be attached to the circular perimeter of the
leg (5.7o inclination, Figures 2 - 3). The shield, which increased the waterline diameter of the leg from 1.67 m to 2.02 m, provided a smooth surface on which to mount the load panels adjacent to one another. The HSVA load panels (1.5 m in height by 0.60 m wide) have been used previously to measure the loads on Norströmsgrund Lighthouse (Wessels et al., 1989).
Leg A2
Leg B2 Leg B1
ice advances from the south west at flow tide strain gauges Leg A1 5 load panels 5 3 2 4 1 N 1 m groups of conductor pipes
Figure 3 Instrumentation on JZ-20 Platform (to scale)
Each HSVA load panel relies upon four strain-gauged load cells (sampled at 30 Hz). Two uni-axial load cells record the normal load components and two bi-axial load cells record the normal and tangential components of the applied load. The measured load is averaged over the panel area. The panels cover half the perimeter of the south-facing side of Leg A1, which is exposed to advancing ice during rising tide. Since the maximum tidal elevation is 2.5 m, the 1.5 m high load panels could not measure the ice loads at peak tide. HSVA also installed a video camera on the platform so that the ice structure interaction with Leg A1 could be recorded. Since the video camera and the load measurement system were synchronized, information on the velocity and direction of the advancing ice, the ice thickness and the ice failure mode at Leg A1 were obtained.
The strain gauge sensors were installed on each of the platform legs at three different levels (Fan and Jin, 1990). Each leg was equipped with three strain gauges (in a rosette configuration) which were sampled at 30 Hz. Fan and Jin (1990) report that the strain gauge measurements compare favorably with the load panel measurements.
General Ice Conditions at the JZ-20 Platform
Ice is present every year in the Bohai Sea, whether the winter is mild or severe. The January mean air temperature is -15oC and, usually, there is a negligible amount of snow in winter. In the Bohai Sea, northerly winds prevail (mean wind speed of 8.5 m/s). Tidal currents range from 0.5 - 1.0 m/s, whereas non-tidal currents are substantially smaller (about 0.1 m/s). Generally, the JZ-20 platform is exposed to advancing ice every year. A survey of the winter ice in the Bohai Sea from 1969 - 1974 indicated that the average ice thickness was 0.60 m (Fan and Jin, 1990). In moderate winters the JZ-20 platform is at the ice edge and is surrounded by 0.35 m thick ice. However, in severe winters the platform is exposed to ice up to 0.70 m thick. Ice has been noted to jam in between the legs of the platform and accumulate to a thickness of 4 - 7 m (Fan and Jin, 1990). Ice that interacts with the platform is not uniform but is, instead, a mixture of level ice floes, rafted ice, hummocked ice and ridged ice.
The coastal area of Liao Dong Bay (Figure 1) is one of the primary ice generating regions in the Bohai Sea. Ice that forms along the shallow coastal regions usually grows and then moves out to sea (except in severe winters, when grounded, landfast ice can develop along the coast). During ebb tide, the water level drops and the ice may freeze to the sea bottom. At high tide an influx of water can move over the grounded layer of ice, enabling a new layer of stratified ice to form over the original ice. Multi-layered ice thus forms, and then deforms, creating ridged ice and hummocked ice. In addition, the salinity of the Bohai Sea water ranges from 26 - 31o/
oo,
which results in ice that can have a low salinity and temperature. As a result of its lower salinity, the ice that advances upon the JZ-20 platform can be of high strength.
Ice Conditions in the Liao Dong Bay during the Winter of 1989 - 90
The winter of 1989-90 in the Liao Dong Bay was more severe than the preceding winter. The winter severity was felt, quite literally, by the severe structural vibrations that were experienced as ice impacted the platform. Fan and Jin (1990) and Wessels and Jochmann (1990) provide an overview of the ice conditions in the Bohai Sea that winter. Decreased air temperatures in Liao Dong Bay between 20 - 26 January 1990 resulted in significant ice production. A hurricane blew a large amount of ice southward between 27 January and 03 February. The
disturbance created a rafted ice cover to the south, whereas recently formed level ice and freshly broken fast ice characterized the north waters. The storm resulted in the ice edge moving from its original location (near the JZ-20) into what was previously an ice-free zone, about 40 miles south.
The period of interest, with respect to the ice loading conditions that year, is from 26 January and 12 February. During that time the ice is classified as layered (formed in-situ), level ice with a thickness of 0.05 to 0.25 m and rafted ice which attained a maximum observed thickness of 0.55 m (Wessels and Jochmann, 1990). Rubble fields, which incorporated pancake ice and occasionally pressure ridges, sometimes formed.
Selected Loading Event
More than 80 minutes of JZ-20 load data are available, in digital form, from the period 31 January to 08 February 1990, all of which can be used for the comparison of the measured loads on Legs A1 and A2. The JZ-20 data offer a unique opportunity to examine the magnitude and simultaneity of load on the different platform legs; the implications of which are of direct relevance to design criteria.
A 50-second interval from 04 February 1990 load record was used to illustrate the type of comparison that may be done for the loads on the two platform legs. The load record for 04 February extends from 21:00 21:30. However, only the portion 21:01:00 -21:01:50 (60 - 110 seconds) is discussed here. That particular interval was selected from the load record because it provided a good illustration of the transition from high-frequency loading to low-frequency, large oscillation, saw-tooth loading. This type of loading is observed commonly during ice structure interaction at the small-scale (Singh et al., 1990) and the full-scale (Jeffries and Wright, 1988).
Load on Leg A1 and the Associated Ice Failure Processes
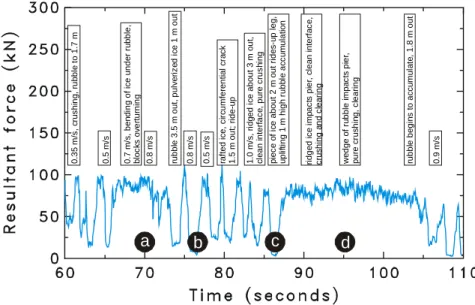
Figure 4 shows the measured load on Leg A1 for the 50-second duration of interest. The sampled interval begins at 21:01, when the video of the interaction with Leg A1 shows 0.20 - 0.25 m thick ice advancing towards Leg A1 at, initially, 0.35 m/s from the southwest. The measured load on Leg A1 provides a clear indication of low-oscillation, saw-tooth loading. The saw-tooth loading pattern is punctuated by two, well-defined periods of pure, high-frequency loading (65 - 74 seconds and 86 - 106 seconds).
0 .35 m/ s , c ru s hi ng , ru b b le to 1. 7 m 0.5 m /s 0.7 m /s , b e n d in g o f ic e un d e r ru bb le , bl oc k s ov e rtu rn in g 0.8 m /s ru bbl e 3. 5 m ou t, pu lv e ri z e d i c e 1 m out 0.8 m /s 0.5 m /s ra ft ed i c e , c ir c umf e re nt ia l c ra c k 1.5 m ou t; ri d e -up 1.0 m /s , r idg ed i c e ab ou t 3 m ou t, c le an i nt er fac e , pu re c rus h in g p ie c e o f i c e ab out 2 m o u t r ide s -u p l e g , u p lif ti n g 1 m hi gh r u b b le ac c u m u la ti o n ri dge d i c e i m p ac ts pi er , c lea n i n te rf a c e , c ru s hi ng a nd c lea ri ng ru bbl e be gi n s t o ac c u mu la te , 1. 8 m ou t 0.9 m /s wed g e of ru bb le i m pa c ts p ie r, pu re c rus h in g , c le a ri n g
a
b
c
d
Figure 4 Load-time series trace for selected Event
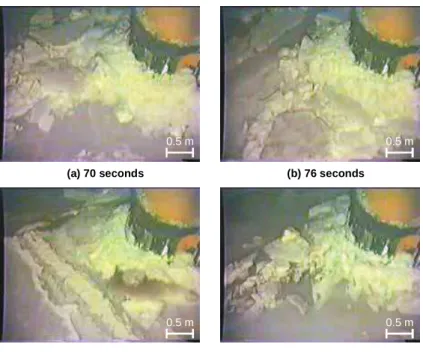
Since the video was synchronized with the load record, it provides a good indication of what is occurring when the time-series trace shifts from low-frequency to high-low-frequency loading. Figure 4 superimposes the notes obtained from the video analysis over the load-time series. During the 50-second interval the ice advanced at speed ranging from 0.35 m/s to 1.0 m/s. Considering that the average ice approach velocity was 0.8 m/s, Leg A1 “processed” about 40 m of ice over the 50-second interval. Four snapshots were extracted from the video, at 70 s, 76 s, 86 s and 95 s (denoted by a - d in Figure 4 and shown pictorially in Figure 5). At 70 seconds (Figure 5-a), the ice is moving at 0.7 - 0.8 m/s. As the ice rides-up Leg A1, it fails simultaneously in crushing and bending, and therefore is characterized by mixed-modal ice failure. The ice failure produces a rubble matrix of large, discrete pieces of ice and pulverized
ice. Figure 5-b shows a snapshot taken at 76 seconds, during the period of low-frequency loading (see Figure 4). At this point, the ice advances at 0.8 m/s and the rubble extends 3.5 m from Leg A1, whereas the region of pulverized ice is in closer proximity to Leg A1 (1 m from the contact zone). At 86 seconds (Figure 5-c), ridged ice approaches Leg A1 at 1.0 m/s; in the far side of the snapshot, a large piece of ice rides-up Leg A1. This snapshot illustrates that, as the ice rides-up the leg, it uplifts an accumulation of rubble (1 m radial distance). At 88 seconds the fragmented piece jams between the contact zone and the advancing floe. Figure 5-d shows a snapshot of the contact zone at 95 seconds, during high-frequency loading, when the the ice failure mode is characterized by crushing. The snapshot taken at 95 seconds shows the tip of a wedge-shaped piece of rubbled ice beginning to impact Leg A1.
(a) 70 seconds (c) 86 seconds (b) 76 seconds (d) 95 seconds 0.5 m 0.5 m 0.5 m 0.5 m
Figure 5 Ice conditions at snapshot intervals during the event
Load Comparison for Leg A1, Leg A2 and Total Platform Load
The load on the individual Leg, FAi, was obtained
from the x- and y- components of the load measured on each Leg, shown by Equation (1).
2 / 1 2 2 ] ) ( ) ( [ yAi xAi Ai F F F = + (1)
where i = 1 or 2 (for leg A1 or Leg A2)
The total load on the two instrumented legs, FA1A2,
was derived by summing the individual components in the x- and y-directions and then taking the resultant, as shown by Equation (2). 2 / 1 2 2 1 2 2 1 2 1A [( xA xA ) ( yA yA ) ] A F F F F F = + + + (2)
Figure 6 shows the comparison of loads on the two instrumented legs (FA1 and FA2) as well as the total
load on two legs (FA1A2). The force record fluctuates
from low- to high-frequency loading for Leg A1. However, Leg A2 exhibits something similar to the low-frequency loading oscillations only towards the end of the load record (from 97 - 103 seconds, just prior to the peak load that was measured on that leg). Since the ice approached from the southwest in this event, it first impacts Leg A1 and then Leg A2. This means that the “processing” of the ice begins with Leg A1. As such, the ice impacting Leg A2 may have
been damaged by cracking activity that radiated from the failure zone of Leg A1. In this case, the load on Leg A2 would be expected to be lower than the load on Leg A1 and that is, generally, the case during the sampled interval. Leg A1 registers an average force of 60 kN and Leg A2 registers an average force of about 40 kN over the 50 second duration. The peak load measured on Leg A1 was 112 kN and occurred at 80 seconds. The peak load on Leg A2 was 89 kN and occurred at 106 seconds. Some of the difference in load on Leg A1 and Leg A2 is due to the different leg diameters (respectively, 2.02 m and 1.67 m), as discussed subsequently. A1A2 F F A2 FA1 Time (seconds) To ta l F o rc e
Figure 6 Comparison of load on individual legs and total load
The highest total load that occurred during the 50-second interval was 153 kN, at 71 50-seconds (Figure 6). The lower loads measured on Leg A2 tend to moderate the total load on the platform, as illustrated clearly by the interval from 66 - 84 seconds shown in Figure 7. The 20-second close-up shows that the highest platform load of 153 kN occurred when the load spikes on legs A1 and A2 were synchronized (at 71 seconds). In contrast, the total load at 75 seconds was 142 kN. In that case, most of the total load resulted from Leg A1 (106 kN), as opposed to Leg A2 (45 kN).
peak total load for 50 second interval Time (seconds) To ta l F o rc e A1A2 F A1 F A2 F
Figure 7 Portion of 50 second record showing time of peak total load
Discussion
The 50-second record that was selected for comparison of the loads on Legs A1 and A2 illustrates that the load-time traces for a single leg are characterized by periods of pure crushing (high-frequency loading) that are periodically interrupted by mixed-modal ice failure. Mixed-modal failure, in this case bending or buckling of the ice, is associated with ice failure in large, discrete slabs. This type of failure behavior induces a saw-tooth loading pattern. Video records of the ice-structure interaction at Leg A1 show that ice crushing is observed at both high- and low-frequency loading.
The approach velocity of the ice ranges from 0.35 m/s (at the start of the event) to 1.0 m/s (just prior to ridge indentation). The velocity of the advancing ice did not appear to influence the onset or termination of loading dynamics, i.e. crushing is observed at all ice velocities. During the 50-second interval Leg A1 shows low-frequency loading that is punctuated by two periods of high-frequency dynamics. In comparison, Leg A2 exhibits mostly high-frequency dynamics. Periods of high-frequency loading on the two legs do seem to coincide, although high-frequency dynamics are nearly continuous for Leg A2. Leg A2 exhibits individual load spikes towards the end of the sampling interval, at which time Leg A1 experiences high-frequency loading.
The non-uniformity of the ice across the two legs makes it difficult to equate the failure modes at Legs A1 and A2. Crushing at Leg A1 is noted to occur during the high frequency loading periods. Crushing also characterizes many of the individual peaks during the saw-tooth behavior observed at Leg A1. Given that crushing is the predominant failure mode at Leg A1 (for the sampled interval), it is probably safe to assume that the ice at Leg A2 experiences mostly crushing. In general, comparison of the magnitude and simultaneity of loading between the two legs for the 50 second duration reveals that the dynamics that occur at one leg may or may not be synchronized with the adjacent leg. The loading on each leg depends upon local ice failure processes, which may or may not occur simultaneously.
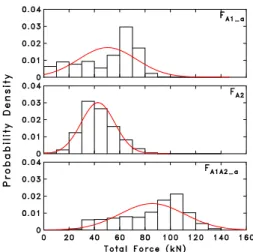
The measured loads on Leg A1 and Leg A2 were affected by their different diameters, as mentioned previously. To account for the different leg diameters, the load on Leg A1 was normalized and was then multiplied by the standard leg diameter of 1.67 m. In this case, linear scaling of the loads is justified, given the relatively small difference between the diameters of Leg A1 and Leg A2. (about 17%). Figure 8 presents histograms of the raw data for the loads on Leg A1 (FA1_a, adjusted) and Leg A2 (FA2). Figure 8
also shows the sum of loads on the two legs (FA1A2_a),
which takes into account the adjusted loads on Leg A1. Gaussian probability densities are superimposed on the histograms of the raw data, both of which take into account all data points within the 60 - 110 second sampling period. Note that the three panels in Figure 8 have the same x-axis scale.
The measured loads on Leg A1 are rather evenly distributed between 0 - 50 kN, after which there is an increase in the number of loads between 50 - 80 kN. Figure 8 shows that the Gaussian distribution is a rather poor fit for the sort of distribution that characterizes Leg A1. The highest loads experienced on Leg A1 are in the range 100 - 110 kN. The measured loads on Leg A2, which range from 0 - 90 kN, are approximated quite well by the Gaussian distribution. The sum of the measured load on two legs (FA1A2_a) shows a distribution that is skewed to
the right, with majority of loads being from 80 - 120 kN. The statistical distributions shown in Figure 8 give a good idea of the range of measured loads for the two legs. The distributions illustrate that the most numerous loads on Leg A1 are clustered around 60 -70 kN, whereas Leg A2 experiences the largest number of loads from 30 - 40 kN.
Figure 8 Gaussian distributions for Leg A1, Leg A2 and load on two legs
Cumulative distribution functions of the raw histograms shown in Figure 8 were used to provide a better indication of what is happening in the tail of the load distribution. Figure 9 compares the cumulative distribution functions for the measured load on two legs (FA1A2_a, adjusted) and load obtained by doubling
the measured loads on Leg A1 (2*FA1_a) and, in turn,
Leg A2 (2*FA2). 2F A2 A1A2_a F 2FA1_a 99% 95%
Figure 9 Cumulative distributions for total platform load: measured vs.
extrapolated
Figure 9 shows that, in the tail of the distribution, the measured loads on two legs (FA1A2-a) are less than the
extrapolated loads based upon doubling the loads on either Leg A1 or Leg A2. For example, Table I shows the 95th percentile and 99th percentile loads on Leg A1 (2*FA1_a), Leg A2 (2*FA2) and the total load on two
legs (FA1A2_a). Doubling the load on Leg A1 results in
an over-prediction of 28 - 30% for loads in the tail of the distribution. Extrapolation of the loads on Leg A2 over-predicts the measured total load on two legs by 11 - 18 %.
Table I Comparison of Extrapolated and Measured Loads in the Extreme Tail of the Distribution
Description Parameter 95th percentile
(kN)
99th percentile (kN) Doubled, measured load on Leg A1
(adjusted)
2*FA1_a 156 167
Doubled, measured load on Leg A2 2*FA2 133 154
Total load on Leg A1 and Leg A2 FA1A2_a 120 130
Conclusions
A load-time trace was selected from the JZ-20 data acquired over the 1989-90 winter season. The sampled data illustrated the transition from low-frequency, saw-tooth dynamics to high-frequency loading. The video of the interaction at Leg A1 showed that the different load patterns were a direct result of the ice failure mode, which varied in the examined case between mixed-modal failure (bending of the ice in slabs or ice buckling) and pure crushing. No apparent relation between ice failure mode and ice velocity was noted during the sampled interval. A comparison of the loads on two adjacent legs of the JZ-20 platform for a 50 second interval revealed that Leg A1 usually registered a higher load than Leg A2.
Since the ice approach direction for this particular loading scenario was from the southwest, Leg A1 was impacted before Leg A2. It is expected that the effect of ice damage (resulting from the “processing” of the ice at Leg A1) affected the ice interacting with Leg A2. Thus, the ice was degraded, in part, before it impacted Leg A2 which resulted in lower loads on that leg of the platform.
For the case considered, the total load on the platform originated most often from one leg, as opposed to the peak load being experienced simultaneously on two legs. Analysis of the selected load-time series demonstrated clearly that, in the extreme tail of the statistical load distribution, extrapolation of the load on one leg to both legs (total load on two legs)
resulted in an overestimation of 11 - 30% of the total, measured load on two legs. The data suggest that the extrapolated loads from neither leg are entirely accurate for predicting the total load on two legs. When making such generalizations, a word of caution is required: these conclusions are based upon a 50-second sampling of data only. The analysis described in this paper is preliminary and should not be used as a basis for design criteria. A more intensive examination of the magnitude and simultaneity of loads on the legs of a multi-leg platform will need to be conducted before this information can be applied to design criteria.
No information is available about the load on the two, trailing platform legs. Strictly speaking, the load on the trailing two legs should be lower than the load exerted on the leading legs of the platform, but precisely how much lower is not known. Wessels and Jochmann (1990) conducted model tests of the JZ-20 platform, which took into account the forces on the trailing platform legs (B1 and B2) and the two groups of conductor pipes. The authors found that, during their experiments, the total ice force on the entire platform was only about 50% higher than the force on either Leg A1 or Leg A2 (Wessels and Jochmann, 1990).
This paper showed that the JZ-20 data set provides a unique opportunity to compare the magnitude and simultaneity of the loads on different platform legs. The analysis also yielded interesting results about the ice failure process, its characteristic “signature” on the load-time trace and its associated loads. Insight was provided as to how legs in close proximity affect the individual leg loads and how these compare with the total load on two legs.
References
Jeffries, M.G. and W.H. Wright. 1988. Dynamic Response of Molikpaq to Ice-Structure Interaction. Proceedings of OMAE’88, Houston, Texas, Vol.. IV, pp. 201-220.
Singh, S.K., Timco, G.W., Frederking, R.F. and I.J. Jordaan. 1990. Test of Ice Crushing on a Flexible Structure. Proceedings of OMAE’90, Houston, Texas, Vol. IV, p. 89-94.
Timco, G.W., Irani, M.B., Tseng, J., Liu, L.K. and C.B. Zheng. 1992. Model Tests of Dynamic Ice Loading on the JZ-20 Jacket Platform. Canadian Journal of Civil Engineering, No. 19, pp. 819 - 832. Yue, Q., Xiangjun, B., Sun, B., Zhang, T. and C. Xiangyu. 1996. Full-scale Ice Force Measurement on JZ20-2 Platform. Proceedings of IAHR’96, Vol., I, pp. 282 - 289.
Wessels, E., Jochmann, P. and Hoffmann, L. 1989. First Results of Ice Force Measurements with the TIP Panels at Norströmsgrund Lighthouse. Proceedings of POAC’89, Lulea, Sweden, Vol. III, pp. 1428 - 1439. Wessels E. and P. Jochmann. 1990. Determination of Ice Forces on Jacket JZ 20-2-1 by Model and Full-scale Tests. SMM’90 Conference, Conference and Exhibit Review, November, No. 22, pp. 1567-1570. Wessels, E., and P. Jochmann. 1991. Model/Full-scale Correlation of Ice Forces on a Jacket Platform in Bohai Bay. Proceedings of POAC’91, St. John’s. Newfoundland, Vol. X, pp. 198 - 212.
Liu, C. and Y. Jin. 1990. Ice survey in Liao Dong Bay and Ice Force Measurement on JZ-20-2-1 Platform. SMM’90 Conference, Conference and Exhibit Review, November, No. 22, pp. 1562 - 1566. Yue, Q., Bi, X and T. Zhang. 1994. Ice Observation on a Platform in Bohai Sea. Proceedings of IAHR’94, Vol. X, Trondheim, Norway, pp. 198 - 204.