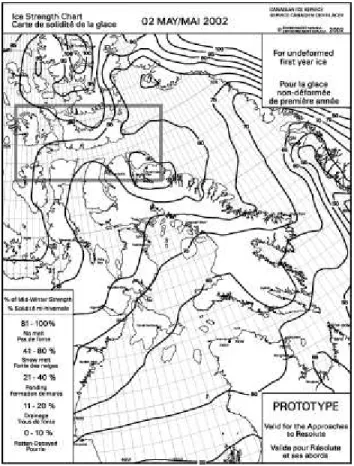
Validating the strength algorithm for sub-arctic ice with field measurements from Labrador
Texte intégral
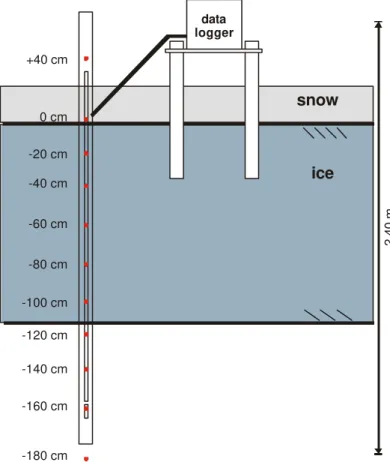
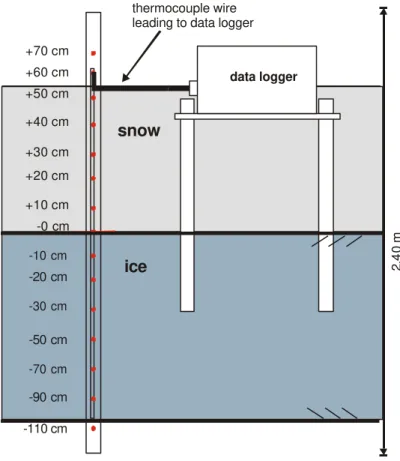
Figure
Documents relatifs
application, a small residential building or commercial unit with an electricity consumption of 70kWh/day and 5 EVs having a battery storage capacity of 24 kWh per EV has
PRIORIZATION TABLE I Issues (Controllable, Uncontrollable) Quality Risk (based on issues) (1) part does not meet specifications Causes of Risks inaccurate tooling,
We used genetic mapping to detect two QTL (QYr.usw-5B and QYr.usw-7B) that conferred stripe rust resistance in a DH population, one of which (QYr.usw-7B) was also identified in
Since POSL uses at most (one positional and) one slotted rest variable on each level of an atom or structure, slotted unification can perform sorting as in the above slotted
From the various investigations of the patina growing in ARC water distribution pipelines, attentions should be drawn to the following points: (1) there is a
The specification of an overarching rule markup family with the primary purpose of rule interchange between platform-specific rule languages as well as between other rule standards
production technology to prototyping processes in the cognitive perspective, coordination technology to the social perspective processes, and organizational technology to
/ La version de cette publication peut être l’une des suivantes : la version prépublication de l’auteur, la version acceptée du manuscrit ou la version de l’éditeur. Access
