OF STRESS-INDUCED CRACKS
by
MICHAEL L. FEVES
B.A., Reed College (1973)
SUBMITTED IN PARTIAL FULFILLMENT OF THE REQUIREMENTS FOR THE
DEGREE OF
DOCTOR OF PHILOSOPHY at the
MASSACHUSETTS INSTITUTE OF TECHNOLOGY
(August, 1977)
Signature of Author... Department of Earth and Planetary Sciences
August 12, 1977
Certified by...
Thesis Supervisor
Accepted by... ----.-.-.--.--.---.--.---Chairman, Departmental Committee on Graduate Students
wi
y'PWN
2
CHARACTERIZATION OF STRESS-INDUCED CRACKS IN ROCKS
by
MICHAEL -L. FEVES
Submitted to the Department of Earth and Planetary Sciences on August 12, 1977 in partial fulfillment of the requirements
for the Degree of Doctor of Philosophy
ABSTRACT
Cracks produced in several samples of crustal igneous rocks by uniaxial stress have been examined with the scanning electron microscope, the petrographic microscope, and by meas-urements of strain to high precision as a function of hydro-static pressure. Our data on laboratory stressed rocks show that stress-induced crack porosity is directly related to initial crack porosity and failure strength is inversely
related to pre-existing crack porosity. Stress-induced cracks (SIC): (1) are intragranular or transgranular, (2) are
typi-cally planar, (3) may cross several grain boundaries, (4) form parallel to subparallel sets, (5) may be associated with par-tially healed cracks, and (6) close at hydrostatic pressures of 100 to 200 bars. Cracks with all of these characteristics are found in a granite core from Shannon County, Missouri.
SIC in the Shannon County core are only present below 1 km and are oriented in a vertical plane. Through analysis of
SIC in this core we have determined that the magnitude of the maximum compressive stress is greater than the tensile
strength of the granite (~100 bars) and is directed horizon-tally.
The effects of cycling rocks with hydrostatic pressure and also with uniaxial loading have been examined. Uniaxial
stress cycling increases total crack porosity in Westerly (RI) granite after each cycle, but no increase in crack porosity is observed in repeatedly stressed Frederick (MD) diabase. We attribute this behavior to the fact that pre-existing cracks enhance the production of SIC. Unstressed Westerly granite contains many cracks but Frederick diabase is virtually crack-free. Hydrostatic pressure cycling reduces total crack poros-ity by 20 to 50 percent between the first and second cycles, but less than 30 percent between the second and third cycles.
3
These data indicate that many cracks do not reopen completely when the pressure is removed. Therefore, laboratory experi-ments done under simulated in situ conditions of pressure
and temperature may not be valid analogues.
Name and Title of Thesis Supervisor: Gene Simmons
ACKNOWLEDGEMENTS
My wife, Gloria, and my daughter, Jordana, gave me the
'inspiration' to complete my thesis. They often bore the
brunt of my frustrations when experimental problems developed, and they spent many evenings and-weekends alone, while I was at the lab (drinking beer). I'thank them for their stead-fast support.
I am particularly indebted to my advisor, Gene Simmons, who constantly supplied constructive criticism and new ideas in all aspects of my work. He was never too busy to stop what he was doing and discuss results or 'show me the light' when something went wrong.
I have benefited from discussions with many people during my internment at MIT. Michael Batzle, Bill Brace, Herman
Cooper, Mike Fehler, Frank Miller, Elaine Padovani, Dorothy Richter, Steve Shirey, and Bob Siegfried were eager to offer suggestions and criticism (constructive and otherwise). Prior to recent automation of the DSA equipment, collection of DSA data required hundreds of hours of continuous operator atten-tion. Michael Batzle, Herman Cooper, Mike Fehler, Ann Harlow, and Bob Siegfried spent many nearly sleepless nights taking
DSA data (and drinking beer). Bob Siegfried developed the computer programs used to analyze the DSA data and Frank Mil-ler designed and maintained the electronics associated with the DSA and acoustic emission systems. Bill Brace provided the pressure equipment used to stress most of the samples.
5
Financial support was provided by Office of Naval Research contract N00014-76-C-0478.
-TABLE OF CONTENTS Page Abstract Acknowledgen List of Figu List of Tabl Cahpter 1: Chapter 2: Chapter 3: Chapter 4: Chapter 5: Chapter 6: References Biographical ents res es Introduction Experimental Considerations
Characterization of Laboratory Stress-Induced Cracks
Effects of Hydrostatic Pressure Cycling and Uniaxial Stress Cycling
Analysis of SIC in a Granite Core Summary Note 10 14 34 64 81 101 110 123
LIST OF FIGURES
Page
2.1 Sample location map. 15
2.2 Block diagram of acoustic emission.and stress
monitoring system. 24
2.3 Acoustic emission rate and stress versus time. 27
2.4 Components of DSA compression curve. 30 3.1 Microcracks in unstressed Wausau (WI) granite. 37 3.2 Growth of crystals in fluid inclusion. 38 3.3 Typical texture of unstressed Westerly (RI)
granite. 39
3.4 Partially healed crack in quartz. 40
3.5 Typical texture of unstressed Graniteville
(MO) granite. 41
3.6 Typical texture of stressed Graniteville (MO)
granite. 43
3.7 SIC associated with pre-existing cracks in
Graniteville (MO) granite. 45
3.8 Stress-induced elongation of pre-existing
crack in quartz. 46
3.9 Crack closure pressure spectra for unstressed
and stressed Westerly (RI) granite. 49
3.10 Crack-closure pressure spectra for unstressed
and stressed Graniteville (MO) granite. 50 3.11 Crack closure*pressure spectra for unstressed
-Page
-3.12 Empirical relationship between initial crack
porosity and stress-induced crack porosity. 52 3.13 Empirical relationship between failure strength
and initial crack porosity. 56
3.14 Relationship between seismic ray paths and crack
orientation. 62
4.1 Crack closure pressure spectra for restressed
Westerly (RI) granite. 71
5.1 Location map for Sh-13 core. 84
5.2 Crack porosity versus depth in southeastern
Missouri- 86
5.3 Crack closure pressure spectra for various
depths in Sh-13. 89
5.4 Orientation of SIC in Sh-13. 90
5.5 Typical texture of Sh-13-1523. 93
5.6 Transgranular stress-induced crack in
Sh-13-1056. 94
5.7 Typical texture of samples from above 1 km
in Sh-13. 95
LIST OF TABLES
Page
-2.1 Modal Analysis 16
2.2 Sample Descriptions 18
2.3 Maximum Uniaxial Stress 25
3.1 List of Abbreviations 36
3.2 Change in Crack Porosity due to Stressing 53 3.3 Mean Strength and Initial Crack Porosity 57
4.1 Changes in g(P) due to Hydrostatic Pressure
Cycling 66
4.2 C(2kb) for Stress-Cycled Westerly Granite 73 4.3 4(2kb) for Stress-Cyclied Frederick Diabase 74
5.1 Modal Analysis of Sh-13 as a Function of
Depth 82
5.2 Crack Porosity as a Function of Depth for
CHAPTER 1 INTRODUCTION
Mechanical properties of.rocks under stress have been studied extensively (Brace, 1964, 1971; Cruden, 1974; Frank-lin, 1971; Robertson, 1955; Schock and Heard, 1974; Walton,
1958; and Wawersik and Fairhurst, 1970). However, we are still severely limited in predicting the behavior of rock under crustal conditions because experimental data cannot be obtained on geologic dimensions or time scales. A predic-tive capability requires development of a general theory of the mechanical behavior of rocks.
Griffith (1921, 1924) postulated that materials contain cracks and stress is concentrated at crack tips when the mate-rial is stressed. When the stress at a crack tip exceeds the
stress necessary to break atomic bonds in the crystal (theo-retical strength) the crack propagates resulting in failure of the material. Griffith's theory predicts that the applied
stress at failure should be less than the theoretical strength, that strength should increase with confining pressure, and
that fracture should occur by the propagation of a single crack through the material. Although Griffith's idea of
re-lating brittle fracture to crack growth is generally accepted, Griffith's theory fails to predict observed dilatancy before failure (Brace et al., 1966) or behavior of cracks subsequent to initial crack growth (Brace and Bombolakis, 1963).
on the basis of a model in which cracks close under pressure. Frictional stresses along the surfaces of closed cracks tend to resist additional deformation of the crack. Therefore, the stress concentration near crack tips.will be less than for a similar crack whose walls are not in contact. The
McClintock-Walsh modification predicts higher failure strength than Griffith's theory and dilatancy prior to failure.
Strengths predicted by McClintock and Walsh fit many experi-mental observations if the coefficient of friction for crack surfaces is taken as unity. The coefficient of friction de-pends on crack surface characteristics and crack closure pres-sure. The coefficient of friction is not well known for
cracks. Microscopic studies show that crack surfaces and mor-phologies caA be quite variable even within a single rock
(Simmons and Richter, 1974). Therefore, it is unlikely that the coefficient will be unity for all rocks.
Peng and Johnson (1972) predicted failure strength on the basis of beam buckling theory. They assumed that material fails due to the coalescence of en eschelon cracks. The mate-rial between each crack is treated as a beam and the body fails when the beams are strained in excess of the fiber strain of the material. The model depends upon the length to width ratio of the beams, the inclination of en eschelon cracks, the fric-tion angle among beams, and the fiber strain which is non-linear with respect4 to stress. None of these parameters is independently well known for rocks, so any of a number of
theo-retical curves can be made to fit experimental data.
None of the proposed theories has universal applicability, but they all contain assumptions about the behavior of micro-cracks. Therefore, prior to development.of a general theory
for rock failure, we must determine the effects of cracks on rock failure. We have chosen to characterize cracks in sev-eral crustal igneous rocks that are produced by stressing in the laboratory (Chapter 3). Characterization of
stress-induced cracks (SIC) includes determination of their morphol-ogy, distribution, abundance, and orientation. The effects of hydrostatic pressure cycling and uniaxial stress cycling
are examined in Chapter 4, and we apply our laboratory results to the analysis of a 1.5 km deep granite core from Shannon County, .Miss'uri in Chapter 5.
The cracks in rocks can be examined indirectly through their effects on various physical properties or directly with the petrographic microscope (PM) and scanning electron micro-scope (SEM). Measurements of such elastic properties as
compressibility and velocities of compressional and shear waves are particularly useful because of their high
sensitiv-ity to open microcracks. For example, the compressibilsensitiv-ity of Westerly granite decreases about 70 percent between pressures
of zero and two kilobars due to the closure of microcracks (Brace, 1965). The velocities of compressional and shear waves in dry samples and of shear waves in saturated samples
pres-sures of zero and two kilobars (Birch, 1960; Nur and Simmons, 1969a).
Both optical and electron microscopes have been used for observing microcracks. Sprunt and Brace (1974) showed that the SEM could be used to examine open microcracks in rocks with a resolution of about 10 5cm. They studied cracks and pores in several rocks and showed that open cavities in many rocks have a wide range of lengths and of aspect ratios, and that most microcracks are one-tenth the grain size in length and up to 1 pm wide. Simmons and Richter (1976) developed techniques for making 100 pm thick sections of rocks without producing new cracks which could be studied with both the SEM
(with the advantage of very high magnification and the pos-sibility of determination of composition with energy disper-sive x-ray systems) and the usual petrographic microscope
(with its advantages of three-dimensional capabilities and ready mineral determination).
The primary methods used in this study for characterizing SIC are differential strain analysis (measurements of strain with high precision, ±2 or 3 x 10- 6, versus hydrostatic
pres-sure) and direct observations using the PM and SEM. Our pur-pose is threefold: (1) to understand the effects of stress on
rocks more fully, (2) to provide a basis for interpreting anomalous changes in measured physical properties premonitory
to earthquakes, and (3) to determine in situ stress states from analysis of SIC in rocks.
CHAPTER 2
EXPERIMENTAL CONSIDERATIONS
The Samples
The rocks examined consist of several granites, a gabbro, and a diabase. Sample locations are shown in Figure 2-1.
Modal composition of the samples is determined by point count-ing and is listed in Table 2.1. The cracks in many of the rocks used in this study have been examined by other workers. References to these studies and petrographic descriptions of the samples are listed in Table 2.2.
Sample Preparation
Crack sections for microscopic examination were prepared without producing new cracks. Richter and Simmons (1977a) describe the procedure: blocks or cores (ca. 2 x 2 x 4 cm or
1.8 dia. x 2 cm) were cut with standard rock saws or coring
equipment from rock in the central portion of the stressed cores. We then removed at least 6 mm of our sample with a Buehler Isomet saw rotating at a very slow speed (perhaps
30-50 rpm) to remove damaged rock. The Isomet-cut-face was
ground by hand on glass plates to remove an additional 1-2 mm, polished to 0.05pm abrasive on a microcloth, and mounted on a glass slide with a room temperature curing epoxy. An Iso-met was used to cute the remainder of the mounted slice to 2 mm. The section was then ground by hand to 100pm on glass
15
757
1410
Sh-13
Figure 2-1. Location map for rocks examined in this study.
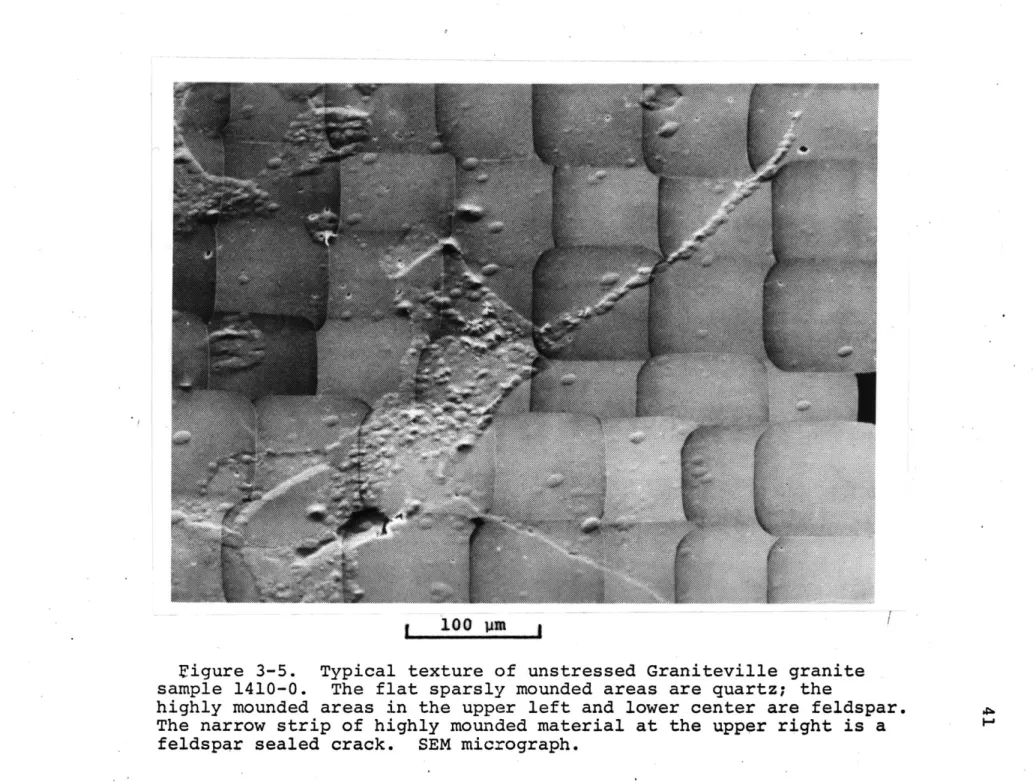
Table 2.1 Modal Analysis Mineral A7571 1134 1242 1331 1336 1410 16432 P.lagioclase 18.5 39.2 47.3 53.7 23.8 26.9 33 K-Feldspar 36.33 30.73 44.84 39.34 325 Pyroxene 46.9. 30.1 Quartz 34.4 22.5 28.9 32.8 26 Olivine 0.4 1.1 Biotite 0.9 5.0 0.8 8 Muscovite 8.4 Opaque 0.1 0.7 2.5 3.1 1.0 tr Epidote 0.6 Apatite 0.4 tr Secondary 0.4 0.4 2.2 12.2 1.5 0.5 Others tr6 1.5 tr8 19 Total 100.0 100.0 100.1 100.2 100.0 99.5 Number of counts 8550 1000 1000 1000 1000 1200 0~1
Table 2.1 (continued)
1Averaged from three orthogonal sections.
2
Analysis
from
Council (1954). 3Microcline.4
Perthite 5Orthoclase. 6.
Zircon, carbonate, garnet. 7Apatite, muscovite.
8
Fluorite, muscovite.
Table 2.2 Sample Descriptions
Sample Other Crack Geology
Name Number Locality Petrographic Description Studies References
Chelmsford A757 (MA) granite Westerly (RI) granite Frederick (MD) diabase Chelmsford, MA. Middlesex Co. 1134 Crumb quarry 1 mi SE of Bradford RI, 1/4 mi E of Ross Hill Rd., Washington Co. 1242 1 mi N of Mt. Pleasant (MD), at intersection of Crum Rd. and Stauffers Rd. Frederick Co.
Medium grained (1-4 mm) granite. Slightly porphyritic hypidiomor-phic granular texture, bluish-gray color, contains both bio-tite and muscovite.
Fine grained (0:3-1.0 mm) mas-sive quartz monzonite. Bluish-gray color. Mainly composed of oligoclase, qua::tz, microcline, and biotite. Minor alteration of feldspars to clays and bio-tite to chlorite.
Fine grained (0.1-0.5 mm) olivine diabase with interser-tal to subophitic texture.
Cooper and Dale (1923)
Simmons (1977) Skehan
Richter and (1967)
Simmons (1977b) Simmons and Richter (1974)
Cooper and Dale (1923)
Simmons (1977) Quinn' Feves and (1943) Simmons (1976) Skehan Feves et al. (1967) (1977) Richter and Simmons (1977b) Siegfried and Simmons (1977)
Simmons and Anna and
Cooper (1977) Stose
Simmons and (1946)
Richter (1974) Siegfried and Simmons (1977)
Table 2.2 (continued)
Sample Other Crack Geology
Name Number Locality Petrographic Description Studies References
Mellen (WI) 1331 gabbro Wausau (WI) granite Graniteville 1410 (MO) granite WI highway 13, 2.1 mi S of intersection with WI high-way 77, NW 1/4, sec 6, T43W, R2E, Ashland Co. 1336 Prehn quarry, 1374 Wausau, SE 1/4, sec 9, T30N , R7E, Marathon Co. Abandoned quar-ries 30 meters E of MO high-way 21; NE 1/4, sec 10, T34N, R3E, Iron Co.
Fine grained (0.2-0.5 mm) mas-sive ophitic olivine gabbro.
Medium grained (1-3 mm) even textured 'dry' granite composed of quartz, perthite, plagio-clase. Very few mafic minerals
Medium grained (1-4 mm) mas-sive granite with few mafic minerals.
Tabet (1974)
Cooper and Lockwood
Simmons (1977) (1970) Feves et al. (1977) Richter and Simmons (1977a) Tolman and Robertson (1969) Mt. Airy (NC) granite 1643 Surface quarry of N. Carolina Granite Corp. 3 mi S of Mt. Airy, N.C. Surry Co.
Medium grained (1-4 mm) 'white' even-textured granite. Mainly composed of feldspar, quartz, and biotite. Minor kaoliniza-tion of feldspar. Winkler (1973) Council (1954) Stuckey and Conrad (1958)
Table 2.2 (continued)
Sample Other Crack Geology
Name Number Locality Petrographic Description Studies References
Sh-13 NW 1/4 SW 1/4 SW
1/4, sec 28, T31N, R4W, Shannon Co.
Medium grained (1-4 mm). Primar-ily composed of quartz and per-thite with myrmekitic texture. Alteration is disseminated at
shallow depth, and is more
con-centrated along cracks at greater depths. Kisvarsanyi (1975) -Tolman and Robertson (1969) Missouri granite core 0
plates and polished to 0.05pm abrasive on a microcloth. Ap-proximately 10-15 microns of material were removed from each section by ion bombardment and the samples were coated with
0
-500A of gold. The ion milling removes polishing damage,
pro-duces slight topography among the minerals, and also propro-duces the elliptical mounds evident in the figures. Because crack sections are three times as thick as standard thin sections, cleavage cracks and other introduced cracks are not formed during sample preparation. Microcracks in crack sections pre-pared in this way can be examined with both the SEM and petro-graphic microscope.
Samples used for differential strain analysis were also cut from the central portion of the stressed cores. Three orthogonal faces were ground using 120, 220, 400, and 600 grit silicon-carbide abrasive and a cast iron rotating lap. Elec-trical resistance foil strain gages (BLH Co. Type FAE) were mounted to these surfaces with a room temperature curing
epoxy (Tra-Con 2101), and all samples were dried in a vacuum
of 10-5 torr. Some samples were left in the vacuum at room
temperature for 10 days. Other samples were heated at a rate less than 15*C/hr to 40*C or 250*C in the vacuum. Additional cracks can be caused by heating to 250*C - both thermal
gradient cracks and thermal cycling cracks (Simmons and Rich-ter, 1976). The low heating ratewas chosen to minimize the production of therhal gradient cracks (see Richter and Simmons,
250*C can be measured and the data on cracks present in
stressed samples can be corrected for their presence. All samples were then encapsulated in Dow Corning Sylgard 186, a translucent and impermeable elastomer, to exclude the pressure medium from the cracks in the sample.
Uniaxial Stressing
Several cores 2.54 cm in diameter and 8 to 12 cm long were cut from each sample block. All blocks were labeled with orthogonal reference axes A, B, and C, and each core was cut with the core axis parallel to either A, B, or C. The core axis was parallel to the rift plane for samples
1134 and 1643. All other samples did not contain a
pro-nounced rift plane as indicated by an isotropic initial crack distribution. Core orientations for all samples are listed in Table 2.3. The ends of each core were ground parallel and flat to 25pm with a surface grinder before stressing.
During stressing, the acoustic emissions (AE) of each sample were monitored. Our AE system is similar, but not identical, to several other systems (Scholz, 1967; Hardy,
1972; Knill et al., 1968; Mogi, 1968; and Todd, 1973). The acoustic pulses are detected with a lead-zirconate-titanate piezoelectric transducer, amplified, filtered, and admitted to a Hewlett Packard HP H22 5401B.yulse height analyzer with 1024 channels of memory. The multichannel analyzer is oper-ated in multichannel scaling mode with a dwell time of 10
seconds per channel. Applied stress was continuously recorded using a load cell and strip chart recorder. The load rate was between 100 and 150 bars per minute for all samples except 1134 where the load rate was less than 10 bars per minute. Sample configuration and AE apparatus are shown schematically in Figure 2-2. Maximum stress for each sample is listed in Table 2.2.
Typical plots of the rate of AE(N) and stress versus
time are shown in Figure 2-3. Qualitatively, these plots show the same features as observed by many investigators (Obert and Duvall, 1945; Mogi, 1962; Scholz, 1968). Namely, a peak is present'in the AE spectrum at low stress which depends upon initial porosity and is attributable to the closing of microcracks. At high stress, there is a large sudden increase in the rate of AE just prior to failure.
It has been recognized, at least since 1902, that meas-ured rock strength is related to such experimental conditions as sample geometry, end loading conditions, strain rate, and confining pressure (Filon, 1902; Brace, 1964; Mogi, 1966; Peng and Johnson, 1972). By uniaxially stressing cores of
various dimensions, Obert et al. (1946) found that the strength, C, is related to sample geometry by:
D
C = C0 (0.778 + 0.222 -) (2.1)
o L
where C0 is the measured strength when the diameter (D) D
equals the length (L). For our samples 0.2 < D < 0.5, and
Figure 2-2. Block diagram of apparatus used to monitor acoustic emissions and stress. Each amplifer provides either 20 db or 40 db of gain. The multichannel analyzer is operated in multichannel scaling mode. Copper foil is placed between the sample and loading platen to reduce end effects.
Table 2.3
Maximum Uniaxial Stress Sample 1134-1 1134-2 1134-3 1134-6 1134-7 1134-8 1134-9 1134-13 1134-15 1134-16 1134-17 1134-18 1134-19 1134-20 1242-2 1242-3 1242-5 1242-6 1242-15 1331-0 1331-4 1331-5 Core Axis B B B B B B B B B B B B B B B B B B B C C C
Peak Load
(bars)-930 1770 1815 1890 0 1930 1930 1600 0 0 1755 1160 1975 0 3430 3840 3720 3700 0 0 4270 2870
Table 2.3 (continued)
Sample Core Axis Peak Load (bars)
1336-0 1336-4 1336-5 1336-6 1410-0 1410-1 1410-2 1410-3 1643-1 1643-2 1643-3 1643-4 1643-5 0 2580 2530 2060 0 2375 2030 2420 0 1600 1650 0 1480
27 1410-3 4-2 25 2.0 1.5 10 0.0 0 5 10 15 20
TOTAL ELAPSED TIME (min.)
5 4- 1643-5 z 0 -j
2/
1.5 S1.0-LU a:0.5 U) 0.01 0 2 4 6 8 10TOTAL ELAPSED TIME (mmi.)
Figure 2-3. Number of acoustic emissions
(N) per 10 second interval and applied
stress versus time. The acoustic emission peak at low stress is due to the closing of cracks. Failure is usually preceeded
C varies by less than one percent. Therefore, we assume that
variations in our sample length will have negligible effect on measured strength.
A mismatch in elastic properties between the rock sample
and the steel loading platen may also cause variations in measured strength. This mismatch results in radial shearing
stresses at the interface. For most rocks, these stresses act inward to produce a 'clamping effect' which does two things. First, a stress concentration arises at the outer edge of the steel-rock interface due to the abrupt change in shearing stress there. *This stress concentration would tend to lower the apparent strength. Second, if a fracture pro-pagates into the region near the end of the sample, growth of the.fracture may be impeded. This effect would increase
the apparent strength. In order to reduce end effects, we placed copper foil between the sample and platen and used platens of the same diameter as the sample. Visual
examina-tion of our stressed samples indicated that microcracks
penetrated only one or two centimeters into the samples from the ends due to the first effect. We removed three to four centimeters of material from each core end and assumed that the stress was uniform in the remaining portion. This assump-tion is probably valid except in the final stages of stress-ing when some samples showed signs of material flakstress-ing from the midportion. Plaking reduces the cross-sectional area and thereby increases the stress.
Differential Strain Analysis
Strain was measured as a function of hydrostatic pres-sure with differential strain analysis (DSA). Complete details of the DSA technique and its theoretical basis can be found in Simmons et al. (1974), Siegfried and Simmons
(1977) and Siegfried (1977). For completeness we include a brief overview of DSA adopted from Feves et al. (1977). In DSA, we measure strain in materials to very high preci-sion, ±2 or 3 x 10- 6. High precision is obtained with a simple trick: the measured strain of a reference sample of fused silica is subtracted from the measured strain of a rock, measured at the same time and under identical conditions. A graphical representation of a DSA compression curve is shown in Figure 2-4. In Figure 2-4a, the dashed line represents the linear strain measured as a function of pressure for a fused silica reference and the solid line represents the strain of a typical cracked solid. If we subtract the strain of the fused silica from the strain of the cracked solid, we obtain the curve in Figure 2-4b which is the DSA differential strain curve.
If we assume that the compressibility of fused silica is constant for pressures below 2 kbar, we have
= + FS- (2.2)
where 9 is the difterential strain, e is the measured rock strain at pressure P, SFS is the fused silica compressibility,
tP
I.C
ROCK
-t
(I)
Figure 2-4. Components of DSA curve. In Figure 2-4a, the measured strain of the fused
silica reference (dashed line) is subtracted from the measured strain in a rock (solid line) to yield the DSA compression curve in Figure 2-4b. The zero pressure intercept, C(P 1), of a line
tangent to the strain curves at any pressure, P1, is the strain at zero pressure associated with cracks which have completely closed by pressure P -Here, n(P 1 ) is the total open crack porosity at
31
and we use the convention that compressive strains are nega-tive. In our previous work (Simmons et al., 1974; Simmons et al., 1975), we assumed constant SFS; however, in the pres-ent work, we have corrected for the fused silica compressi-bility pressure dependence using the data of Peselnick et al.
(1967). Their measurements show that the linear compressi-bility of fused silica varies from 0.913 x 10⁻⁶ bar- at
P = 0 to 0.945 x 10⁻⁶ bar~1 at 2 kbar. The actual sample
strain is calculated by adding to the differential strain the fused silica strain calculated from Peselnick's data. Then, in order to expand the strain scale on plots, and to facili-tate comparison with previous differential strain data, a linear strain curve with a slope equal to the zero pressure fused silica compressibility determined by Peselnick et al. is subtracted from the actual strain curve. Thus, the dif-ferential strains in this paper can be converted to true strains with the formula:
= 2- Pa (2.3)
-6 -1
where 6 = 0.913 x 10 bar
The DSA compression curve is related mathematically to the cracks present in the sample. In a crack-free solid, the curve is a- straight line with a slope given by the difference in compressibilities of the sample and fused silica. But for a sample containing cracks the strain at pressure P = 0 due
by (P1), is given by the expression
C(P) =
1
- (P ) (2.4)where ^ is the linear differential strain. Equation 2.4 has a simple geometrical interpretation. From Figure 2-4, C(P ) is seen to be the zero pressure intercept of a line tangent to the strain curve (and also the differential strain curve) at P . The linear crack porosity due to all cracks that remain open at P is also shown and may be expressed as
n(P = )(Pmax - P + 2 Pl) (2.5)
P max
where (P) is the value of differential strain at P 1. If the strains of Figure 2-4 are volumetric strain, then we ob-tain CV'(P) which is the volumetric strain at P = 0 due to all
v
cracks that close at P < P and iy 1)(P which is the (usual)
volumetric crack porosity at P . Note that ny(0) is the crack porosity that has been used previously by other authors (e.g., Walsh, 1965; Todd et al., 1973a).
In addition to crack porosity as a function of pressure,
DSA allows us to obtain the distribution of crack porosity
(at P = 0) with respect to the crack closure pressure, termed
crack spectrum, and the effective orientation of the cracks associated-with each value of crack closure pressure. Morlier
(1971), based upon the work of Walsh (1965), showed that
com-pression curves can be interpreted in terms of the distribu-tion of crack- aspect ratios. Siegfried and Simmons (1977)
33
replaced the penny-shaped or elliptical crack models of Mor-lier and Walsh with the assumption that strain is linear over any pressure range in which no cracks close completely. They obtained;
d2
V(P) = P( 2) (2.6)
dP
where v(P)dP is the strain at zero pressure due to the pres-ence of cracks closing between P and dP. We therefore can determine crack spectra by twice differentiating strain curves. Without the high precision data obtained with DSA, it would not be possible to obtain meaningful results from these differentiations.
CHAPTER 3
CHARACTERIZATION OF LABORATORY STRESS-INDUCED CRACKS
Introduction
The study of stress-induced cracking is of great impor-tance to the understanding of the behavior of rocks in tec-tonically active zones (Brace et al., 1966; Scholz et al.,
1973; Mjachkin et al., 1975). In previous laboratory studies of stress-induced cracks (SIC), crack characteristics were inferred from electrical or elastic measurements (Matsushima,
1960; Nur and Simmons, 1969a; Brace and Orange, 1968) or from
direct observations with the petrographic microscope (Paulding,
1965; Friedman et al., 1970; Wawersik and Brace, 1971; Peng
and Johnson, 1972; Hallbauer et al., 1973). Recently, Tap-ponnier and Brace (1976) have examined stress-induced cracks
(SIC) with the SEM.
None of these methods yields a complete characterization of cracks. Electrical and elastic measurements yield only
some averaged crack property. The petrographic microscope has very limited resolution and many cracks are below this
resolution (Sprunt and Brace, 1974). The SEM has a resolution
of 10 cm, but yields only a two-dimensional view. In order to obtain a complete characterization of laboratory stress-induced cracks we have combined observations with the SEM, PM, and differential strain analysis.
Microscopic Observations
Observations with the petrographic.and scanning electron microscopes show that many SIC are transgranular, they may
cross many grain boundaries, they form parallel to subparal-lel sets, and they are typically planar. SIC can be either associated with pre-existing cracks or they may appear iso-lated in the plane of view.
In order to distinguish SIC from pre-existing crack fea-tures, we have examined several crack sections from unstressed rocks. Naturally occurring cracks are often confined to grain boundaries, have rounded terminations, and contain bridges. The sites of previously open cracks are often marked by planes of secondary fluid inclusions, sealed cracks, or healed
cracks.
Examples of naturally occurring crack features are shown in Figures 3-1 to 3-5. Table 3.1 lists the abbreviations used for all micrographs. Figure 3-1 is an SEM mosaic of the Wau-sau granite. The open microcrack is discontinuous and has blunt terminations (BT). The two rows of holes are part of planes of fluid inclusions (FI), which mark the sites of pre-viously open microcracks (Tuttle, 1949). Sometimes the fluid inclusions contain crystals which have grown after formation of the inclusion (see Figure 3-2).
A typical view of unstressed Westerly granite is shown in
Figure 3-3. Many of the cracks are confined to grain bounda-ries and have blunt terminations. All, cracks contain healing
Table 3.1
List of Abbreviations
qtz Quartz
plag Plagioclase feldspar ksp Potassium feldspar
pert Perthite
biot Biotite
hbd Hornblende
ilm Ilmenite
SIC Stress-induced crack PHC Partially healed crack
reopened by stress
FI Fluid inclusions which are part of a plane of inclusions and mark the site of a previously open crack
BT Blunt termination of a partially healed pre-existing crack
NB Narrow bridge
Figure 3-1. Microcracks in quartz, unstressed Wausau granite sample
1336-0. Open microcracks in unstressed samples are discontinuous and
have blunt terminations (BT). The linear arrays of holes are the w
surface expressions of planes of fluid inclusions (FI), and mark the sites of previously open microcracks. SEM micrograph.
38
-Figure 3-2. Growth of crystals in fluid inclusion in quartz. Graniteville granite sample 1410-0.
NB
WB
1O0p
Figure 3-3. Typical texture of unstressed Westerly granite sample 1134-9. Most cracks are
confined to grain boundaries and all cracks contain healing features. (3-3a) SEM micrograph. (3-3b)
Mineral grain map.
3-3a
40
WESTERLY 1134-3
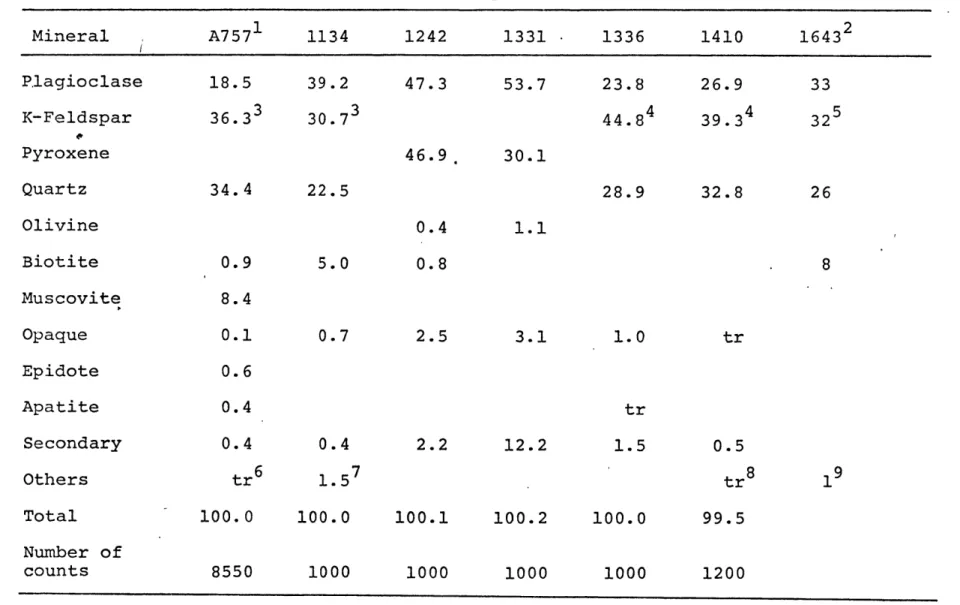
Figure 3-4. Partially healed crack in quartz, unstressed Westerly granite sample 1134-3. SEN micrograph.
S100 JAM
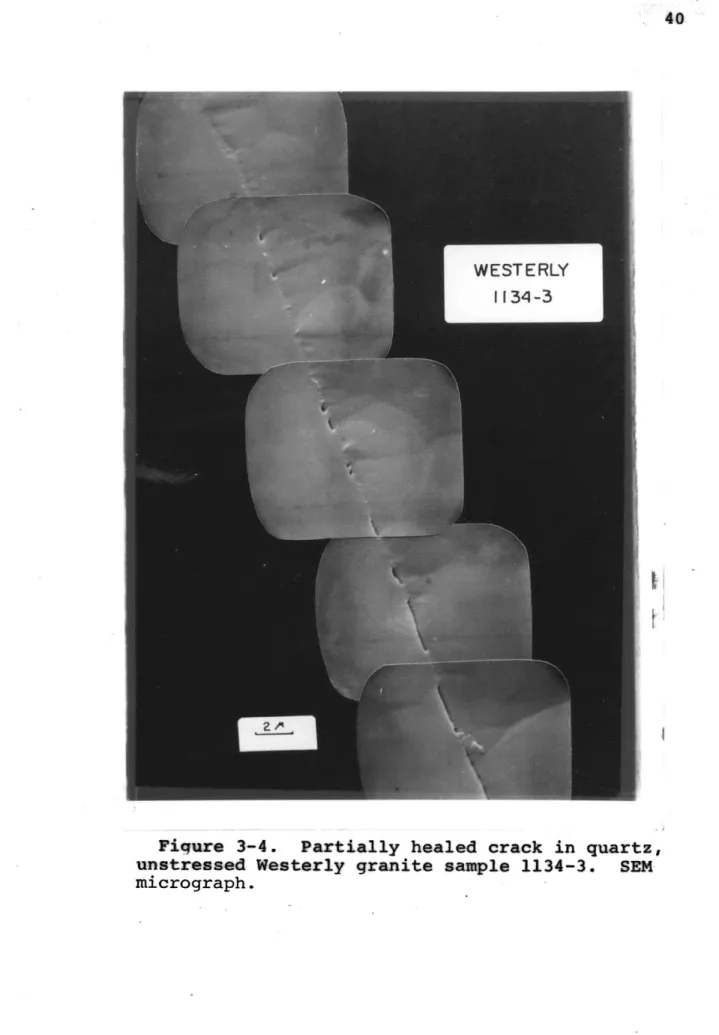
Figure 3-5. Typical texture of unstressed Graniteville granite
sample 1410-0. The flat sparsly mounded areas are quartz; the
highly mounded areas in the upper left and lower center are feldspar.
The narrow strip of highly mounded material at the upper right is a feldspar sealed crack. SEM micrograph.
features along at least a portion of their length. Early
stages of crack healing are represented by narrow bridges (NB). Further healing produces wider bridges (WB) which results in the formation of slot-like cavities (Figure 3-4), then holes
(Figure 3-1), and finally total annealing of the crack.
A typical view of unstressed Graniteville granite is
shown in Figure 3-5. This rock contains many healed and
sealed microcracks. The open microcracks occur most commonly along grain boundaries, but show no preferred orientation. They are generally 0.1-0.3pm wide with short segments that
are completely healed. A complete description of Wausau and Graniteville granite can be found in Richter and Simmons
(1977a).
In contrast to the crack morphologies shown in Figures
3-1 to 3-5, many cracks in laboratory stressed samples have
sharp terminations and do not contain healing features. We infer that these 'fresh-looking' sharp ended cracks are stress-induced. Comparison of Figure 3-6, which is an SEM micrograph of stressed Graniteville granite, with Figure 3-5 shows the dramatic change in morphology due to stressing. Figure 3-6 contains many open stress-induced cracks. These transgranu-lar cracks often form parallel sets and cross many grain boun-daries with-no change in orientation. They may be slightly offset at grain boundaries.
Another view o'f stressed Graniteville granite is shown in Figure 3-7.. Here the SIC are associated with pre-existing
43 sic--I\C 3-6a
pert.
plag.
qtz.
plag. -~clay
plag..
per t.
plag.
pplag.
3-6bFigure 3-6. Typical texture for stressed samples. Graniteville granite sample 1410-2. SIC cross several grain boundaries with no change in orientation, some SIC are offset at grain boundaries. Maximum stress was normal .to the plane of the section. (3-6a) SEM micrograph. (3-6b) Mineral grain map. (3-6c) Close-up of boxed area.
44
45
S I C
3-7a
Ito-.
3-7b
Figure 3-7. SIC associated with pre-existing cracks
in stressed Graniteville granite sample 1410-2. Stressing has reopened partially healed quartz grain boundary cracks (PRC and SIC ). SIC2 is a transgranular crack which does not appear t be associated with pre-exisiting cracks. Maximum stress was normal to the plane of the section. (3-7a) SEM micrograph. (3-7b) Plane polarized light.
Figure 3-8. Stress induced elongation of pre-existing crack in quartz. SIC are parallel to the direction of maximum compression. SEM micrograph of sample 1134-9.
47
cracks and fluid inclusion planes. The pre-existing crack with the blunt termination in the upper left corner may have provided a nucleation site for the stress-induced crack
labeled SIC . Partially healed cracks, labeled PHC, have been reopened by stress, but note that not all fluid inclu-sion planes have been reopened. The crack labeled SIC2 is a transgranular stress-induced crack which is not associated with a pre-existing crack in the plane of view. SIC2 could be
associated with a pre-existing crack which is above or below the surface of the crack section.
Stress may modify pre-existing cracks in other ways. In Figure 3-8, stress has elongated the pre-existing crack. The apparent bridging of the crack at the junction of the SIC and pre-existing'crack is due to electron charge accumulation and poor photographic resolution. Direct observation using the
SEM cathode ray tube shows that the crack is continuous.
The characteristics of stress-induced cracks that can be seen with the scanning electron microscope and the petro-graphic microscope can be used to identify naturally occurring stress-induced cracks in rocks. We have used them to identify SIC in a set of cores from southeastern Missouri (see Chap-ter 5).
DSA Results
We have examirted more than 100 DSA compression curves from both virgin and laboratory stressed rocks. Typical
clo-48
sure pressure spectra in three orthogonal directions for stressed and unstressed samples are shown in Figures 3-9 to
3-11. Volumetric crack distributions can be obtained by
add-ing the three orthogonal distributions. Most crack spectra for stressed samples contain a pronounced peak between 100 and 200 bars. This peak is absent in most spectra from
un-stressed samples and indicates that the closure pressure of many SIC is between 100 and 200 bars. Mt. Airy granite
(Figure 3-11) contains pre-existing cracks with closure pres-sure of about 150 bars and stressing increases the volume of
150 bar closure pressure cracks.
Stressing also increases the total crack porosity as shown by the increased area under the closure pressure curves
for the stressed samples. The increase in crack porosity
after stressing is the residual crack porosity after the stress has been removed and it is related to the pre-existing crack porosity. Figure 3-12 shows that stress-induced crack
poros-ity increases with increasing pre-existing crack porosporos-ity. The data for Figure 3-12 are listed in Table 3.2. The line through the data in Figure 3-12 is a least squares fit and can be expressed as
Log (Av x 106) = 0.69 Log (C x 10 6) + 0.66 (3.1) v
The initial crack porosity, Cv (2k15), is determined from separate unstressed* samples which came from the same block as the stressed samples. Arv (2kb) is obtained by
subtrac-06~ UNSTRESSED WESTERLY GR 04 - 34-20 + B 0 C ~ 02 00-00 05 10 5 20 08_ STRESSED 06- WESTERLY GR 1134-19 04 - A + B 0 C -02 00 05 10 5 20
Figure 3-9. Crack closure pressure' spectra in three orthogonal directions for unstressed and stressed Westerly (RI) granite. The abscissa is the closure
pressure in kbars, and the ordinate is v in Mbar~1. Many SIC have closure pressure of
100 to 200 bars and stressing increases the
+
p
I 00 05 21 Q 0 46 4 41 UNSTRESSED GRANITEVILLE GR 1410-0 a A ERROR + B 0 C 10 15 2C STRESSED GRANITEVILLE GR 1410-3 + B 0 C -lo K I 00 0.5 10 1.5 2.0Figure 3-10. Crack closure pressure spectra in three orthogonal directions for unstressed and stressed Graniteville
(MO) granite. The abscissa is the closure pressyre in kbars, and the ordinate is v in Mbar~ . Many SIC have closure pressure of
100 to 200 bars and stressing increases the
total crack porosity.
51 10-UNSTRESSED MT AIRY GR. 1643-4 SA 5 Q+ B O C
14
SC 05 10 15 2010F
STRESSED MT AIRY GR 4 1643-3 C4C 00 05 1.0 15 2.0Figure 3-11. Crack closure pressure spectra in three orthogonal directions for unstressed and stressed Mt. Airy (NC) granite. The abscissa is the closure
pressure in kbars, and the ordinate is v in Mbar~1 . Many SIC have- closure pressure of
100 to 200 bars and stressing increases the
2 -2
0ry 01
2 3 .4
Log (CxlO')
Figure 3-12. Empirical relationship between initial crack porosity and
stress induced crack porosity. A least
squares fit of the data is shown by the
line and can be expressed as:
Table 3. 2
Change in Crack Porosity due to Stressing
Sample Maximum Load
I' (bars) 1242-15 1242-2 1242-3 1242-5 1242-6 1331-0 1331-4 1336-0 1336-4 1336-5 1336-6 1134-20 1134-81 1134-17 0 3430 3840 3720 3700 0 4270 0 2580 2530 2060 0 1930 1755 C (2kb) Log C (2kb) 32 Cv (2kb) A v (2kb) Log A V (2kb) -1.51 105 70 95 119 144 73 '38 63 87 1.86 1.58 1.80 1.94 2.16 304 242 160 2.20 2.38 410 407 345 598 168 165 103 2.23 2.22 2.01 2.78 876 845 278 247 2.44 2.39
Table 3.2 (continued) Maximum Load ii
Sample (bars) a (2kb) Log C (2kb) (v (2kb) A C (2kb) Log A C (2kb)
1134-18 1160 658 60 1.78 1134-19 1975 769 171 2.23 1410-0 0 685 2.84 14f0-1 2375 1188 503 2.70 1410-2 2030 980 295 2.47 1410-3 2420 1720 1035 3.01 1643-1 0 2219 3.35 1643-2 1600 4000 1781 3.25 1643-3 1650 3174 955 2.98 1643-5 1480 4059 1840 3.26
ting C (2kb) from v (2kb) for each stressed sample. The
scatter in the value of AC (2kb) at a particular C (2kb) is
v v
due to non-identical maximum stress for each sample.
Pre-existing crack porosity also affects failure strength.
A least squares fit to the data listed in Table 3.3 and plotted
in Figure 3-13 shows that strength (S) is related to initial crack porosity by
S = 6.16 - 1.40 Log (C x 10 6) (3.2)
The values of S plotted in Figure 3-13 are the means for each sample of the ultimate stress listed in Table 2-3. Most samples were stressed to about 95 percent of failure strength, and the plotted strengths represent minimum values for the stress at total failure. Because the rocks examined have various mineralbgies and grain sizes, we conclude that mineralogy and grain size play a subordinate role to
pre-existing cracks in the formation of SIC.
Discussion
Several aspects of the data presented in this chapter are pertinent to the evaluation of phenomena precursory to earthquakes and to the confirmation of the dilatancy-fluid diffusion model for earthquake precursors. The dilatancy-diffusion model contains assumptions about the behavior of microcracks and their effect of permeability (Scholz et al.,
56 F-z 2.-2 3 Log (t x106)
Figure 3-13. Empirical relationship between 95 percent of failure strength and initial crack porosity. A least squares fit through the data is shown
by the line and can be expressed as:
i 6
57
Table 3.3
Mean Strength and Initial Crack Porosity
Sample 106i S(kb)
V
1242 Frederick (MD) diabase 32 4.0 ± 0.1
1331 Mellen (WI) gabbro 73 3.6 ± 0.9
1336 Wausau (WI) granite 370 2.6 ± 0.1
1134 Westerly (RI) granite 598 2.1 ± 0.1
1410 Graniteville (MO) granite 685 2.3 ± 0.1
58
increasing stress causes dilatant cracking. Permeability must be low enough in the initial stages of dilatant cracking to allow pore pressure to decrease. As dilatancy increases, permeability increases so that pore pressure returns to its original value. Increasing pore pressure results in catas-trophic failure of the rock which is accompanied by decreasing stress. Once the stress is removed, the dilatant cracks in the rocks return to their initial 'crack-states'. The return to initial 'crack-states' means that the rock strength and measured physical properties return to their pre-stressed values.
The assumption that rocks return to their initial 'crack-states' after the stress is removed is not supported by our data which show large residual stress-induced crack porosity after the stress is removed. The observation that dilatancy is not totally recoverable at room pressure in our samples can be explained by: (1) dilatancy recovery is time dependent or
(2) dilatancy is recoverable in the earth but not in the laboratory. The closure pressure of many stress-induced cracks is less than 200 bars so these cracks will be closed at depths corresponding to pressures in excess of 200 bars
(~800 meters).
Laboratory and field studies indicate that dilatancy recovery may be time dependent. Scholz (1974) observed subsidence at a rate which decreased exponentially for one year after the 1965 Niigata, Japan earthquake (M = 7.5).
He attributed the time dependence of dilatancy recovery to pore fluid which must outflow prior to crack closure. If
Scholz's (1974) conclusion is correct that the time dependence is due to pore fluid, then dilatancy should be instantaneously recoverable in our samples which were carefully dried.
We propose that the time dependent dilatancy recovery observed by Scholz is due to a combination of inelastic
crack closure and fluid flow effects. Inelastic crack closure may involve either mechanical (friction) or chemical (healing) processes. Frictional and healing processes are supported
by microscopic observations in this study as well as many
other studies (Richter and Simmons, 1977a; Simmons and Richter,
1976; Sprunt and Brace, 1974; Tapponier and Brace, 1976).
These studies show that microcracks typically form complex networks, crack surfaces may be quite irregular and cracks are often partially or totally healed or sealed. Since in situ dilatancy recovery seems to be time dependent, rocks in tectonically active zones will become progressively weaker unless the rate of strain accumulation is slow enough to allow closing of SIC associated with previous earthquakes. By
examining the rate of crack closure, we may be able to preedict the periodicity of seismic events in tectonically active areas. While we do not yet know the absolute time required for.closing
of SIC, we predict that SIC will heal more quickly than many
other types of cracks because the closure pressure of most SIC is less than the closure pressure of many other types of cracks.
60
Based upon Walsh's (1965) crack models, low closure pressure cracks will have lower aspect ratios (width to length ratio) than higher closure pressure cracks. A lower aspect ratio means that crack will be narrower and longer so that crack healing should occur more rapidly.
The observation that SIC form parallel sets which are oriented parallel to the direction of maximum stress indicates that the crack distribution in rocks will be strongly aniso-tropic in regions that are dilated by stress-induced cracks. An anisotropic crack distribution will have a profound effect on such measured physical properties as compressional and shear wave velocity, strain and permeability since cracks
control the values of these properties (Brace, 1965; Brace and Orange, 1968; Birch, 1960 and 1961; Simmons, 1964; Nur and Simmons, 1969a).
Seismic waves traveling perpendicular to the plane of most SIC will have lower velocities than waves traveling parallel to most SIC. Todd et al. (1973b) have shown that linear compressibility measured parallel to the hardway direction (parallel to most cracks) in Chelmsford (MA) granite is 60 percent less than compressibility measured parallel to the rift direction (normal to most cracks) and compressional and shear wave velocity in the hardway direction is about 55 percent greater than the velocity in the rift
direction. Therefore, unless the azmuthal distribution of seismic sources and receivers is considered with respect to
the stress state and crack distribution, the observed decrease and subsequent increase of velocity in focal regions prior to large earthquakes may be due to differences in the ray paths of seismic waves and not to changes in the rock properties. Consider the sequence of events shown in Figure 3-14. The seismic waves from event 1 have velocities P and S and traverse the dilatant zone such that the ray path is not normal to most cracks. The ray paths of seismic waves from
event 2 are normal to most cracks so that the measured velocities P2 and S2 will be less than P1 and S . Event 3
produces seismic waves with ray paths and velocities identical to those-of event 1. The decrease then increase in velocity observed at station A is due solely to differences in ray
paths for different events and not to changes in the properties of the rock.
-While crack anisotropy complicates measurements of
compressional and shear wave velocity ratios, it provides us with a new tool for predicting earthquakes. Nur and Simmons
(1969b) and Todd et al. (1973b) have shown experimentally and
Nur (1971) has shown theoretically that an anisotropic distribu-tion of cracks produces splitting of shear waves into two
components which travel with different velocities. The velocity, difference increases with increasing anisotropy.
By monitoring the difference in travel times between the two
S-waves, we should be able to determine changes in the 'crack-states' of rocks prior to earthquakes. Gupta (1973a and b) has
EVENTS
1&3
SIC
A
EVENT 2
STRESS
Figure 3-14. Relationship between seismic-ray paths and crack orientation. Seismic waves
from event 2 will have lower velocity than waves from events 1 and 3.
monitored shear wave splitting prior to earthquakes in Nevada and he has shown that earthquakes are preceded by increases in the difference between the travel times of the two shear waves. He concluded that the physical properties of rocks in focal regions become'increasingly anisotropic due to increased microcrack dilatancy prior to earthquakes.
Crack anisotropy will also affect diffusion of fluids into and out of dilated regions. SEM observations indicate that SIC are not generally interconnected, but the SEM affords only a two dimensional view. Results from DSA and three
dimensional observations with the petrographic microscope show that many SIC are interconnected via pre-existing
cracks and stressing reopens partially healed cracks. There-fore, we predict large increases in permeability parallel to the direction of maximum stress and slight increases perpendicular to the maximum stress axis. We have not yet measured permeability nor can we yet determine the magnitude of the permeability increase from crack characteristics.
Zoback and Byerlee (1975b) measured permeability as a function of triaxial stress in Westerly (RI) granite and found that increasing dilatancy caused increased permeability in the direction of maximum compression, but the increase was insufficient to explain fluid flow rates in the field. We suggest that end loading conditions 'clamped' their samples
CHAPTER 4
EFFECTS OF HYDROSTATIC PRESSURE CYCLING AND UNIAXIAL STRESS CYCLING
Introduction
A requirement of current models for earthquake precursors
is that rocks dilate prior to earthquakes (Scholz et al.,
1973; Mjachkin et al., 1975). One major problem associated with these models is that dilatancy in laboratory samples
requires shear stresses which are considerably higher than in situ stresses inferred from heat flow data (Brune et al.,
1969; Henyey and Wasserberg, 1971; Lachenbruch and Sass, 1973) or from direct measurements of in situ stress (Hast, 1969; Hooker and Johnson, 1969; Kropotkin, 1972). Recently, Scholz and Kranz (1974), Haimson (1974), Zoback and Byerlee
(1975a), and Hadley (1976) have shown that in uniaxial and low confining pressure (<1.5kb) triaxial experiments, the onset of dilatancy occurs at progressively lower stress in rocks sub-jected to cyclic loading. Cyclic fatigue might explain why laboratory measurements of shear stress at the onset of dila-tancy are higher than measurements of in situ stress in areas of repeated seismic activity. However, Zoback and Byerlee
(1975a) and Hadley (1976) did not observe cyclic fatigue in rocks subjected to confining pressure greater than 2 kbar. The cyclic fatigue mechanism can only be invoked for earth-quakes shallower than about 10 km.
65
In this chapter, we examine the effects of uniaxial stress cycling and hydrostatic pressure cycling on micro-cracks in rocks. The purpose of our experiments.is to gain a detailed understanding of how rocks fail under cyclic load-ing. Our results are also useful to experimenters who
attempt to duplicate in situ conditions by placing rocks under various stress states.
DSA Results
Cracks in several granites have been examined with DSA over two or three hydrostatic pressure cycles. In general, we find that there is a 20 to 50 percent decrease in total crack porosity between the first and second pressure cycles, but less than a 30 percent decrease between the second and
third cycles. The decrease in porosity between cycles can be related to unrecovered strain when the pressure is removed. We attribute this inelastic behavior to cracks which do not
reopen.
The zero pressure crack porosity, zeta, and unrecovered strain for several samples are listed in Table 4.1. The un-recovered strain is defined as the strain at zero pres-sure after the rock is subjected to hydrostatic prespres-sure, minus the strain at zero pressure before the pressure cycle. We use the convention that compressive strains are negative. Some strain gages show a positive unrecovered strain which is due to stretching of the strain gage when the gage is mounted
Table 4.1
Changes in C(P) due to Hydrostatic Pressure Cyclingi
C(P) x 1062 AC (P) x 106 x 00 Unrecovered Strain
Cycle Cycle Cycle Cycle Cycle Cycle Cycle After After
Sample Direction 1 2 3 1 to 2 2 to 3 1 to 2 2 to 3 Cycle 1 Cycle 2
1374-1 1374-2 1134-13 1134-73 A B C Total A B C Total A B C Total B 70, 95, 180 345 96 115 170 381 712 547 518 1777 670 56 67 104 227 47 70 79 196 464 365 280 1109 408 50 65 85 200 40 53 67 160 348 -14 -28 -76 -118 -49 -45 -91 -185 -248 -182 -238 -668 -262 -6 -2 -19 -27 -7 -17 -12 -36 .-60 -20 -30 -42 -34 -51 -39 -54 -49 -46 -33 -36 -38 -39 -11 -3 -18 -12 -15 -24 -15 -18 -15 -24 -56 -83 -163 -43 -51 -55 -149 -155 -222 -221 -598 -204 -9 -12 -6 -27 -2 4 18 20
Table 4.1 (continued)
C(P) x 1062 AW(P) x 106 - x 100 Unrecovered Strain
Cycle Cycle Cycle Cycle Cycle Cycle Cycle After After
Sample Direction 1 2 3 1 to 2 2 to 3 1 to 2 2 to 3 Cycle 1 Cycle 2
1134-8 1134-13 3 1134-153 1134-16 3 1134-17 A C Total4 A A C Total4 A B C Total A B C 3q 572 386 1344 400 264 262 788 296 240 198 734 275 220 525 348 1221 340 260 183 626 -311 -272 -855 -395 -423 -339 -1101 -114 -82 -75 -271 -76 -27 -47 -38 123 -60 -4 -79 -162 -35 -41 -39 -50 -62 -56 -58 -28 -25 -27 -27 -22 -11 -8 -10 -9 -15 -2 -30 -20 -205 -238 -681 -200 -38 -224 -486 -123 -80 -126 -329 -22 33 34 -17 0 2 36 58 152 883 658 2199 795 687 601 1889 410 322 273 1005 351 247
4~t
Table 4.1 (continued)
C(P) x 1062 AW(P) x 106 - 100 Unrecovered Strain
Cycle Cycle Cycle Cycle Cycle Cycle Cycle After After
Sample Direction 1 2 3 1 to 2 2 to 3 1 to 2 2 to 3 Cycle 1 Cycle 2
1134-17 Total4 84 5 4- 715 -130 -15 44 1134-18 A 276 267 -9 -3 61 B 191 190 -l 0 -37 Total4 6 5 84 547 -11 -2 -3 1134-19 A 276 239 -37 -13 -3 B 205 184 -21 -10 35 C 288 110 -178 -62 -34 Total 769 533 -236 -31 -2 A757-1 A 1038 445 235 -593 -210 -57 -47 -325 23 B 432 206 110 -226 -96 -52 -47 -159 -6 C 338 320 262 -18 -58 -5 -27 -324 8 Total 1808 971 607 -837 -364 -46 -37 -808 25
1Total C(P) is the zero pressure crack porosity, C (P), for cracks which close by pressure P.
2P = 1 kbar for all cycles except cycles 1 and 2 of sample 1134 where P = 2 kbar.
Most cracks are closed by 1 kbar so C(lkb) ~ C(2kb).