Publisher’s version / Version de l'éditeur:
Vous avez des questions? Nous pouvons vous aider. Pour communiquer directement avec un auteur, consultez la première page de la revue dans laquelle son article a été publié afin de trouver ses coordonnées. Si vous n’arrivez pas à les repérer, communiquez avec nous à [email protected].
Questions? Contact the NRC Publications Archive team at
[email protected]. If you wish to email the authors directly, please see the first page of the publication for their contact information.
https://publications-cnrc.canada.ca/fra/droits
L’accès à ce site Web et l’utilisation de son contenu sont assujettis aux conditions présentées dans le site
LISEZ CES CONDITIONS ATTENTIVEMENT AVANT D’UTILISER CE SITE WEB.
ASCE/SFPE Specialty Conference of Designing Structures for Fire [Proceedings], pp. 1-10, 2003-10-01
READ THESE TERMS AND CONDITIONS CAREFULLY BEFORE USING THIS WEBSITE.
https://nrc-publications.canada.ca/eng/copyright
NRC Publications Archive Record / Notice des Archives des publications du CNRC : https://nrc-publications.canada.ca/eng/view/object/?id=65b563e3-290a-4a27-9194-89f197448f99 https://publications-cnrc.canada.ca/fra/voir/objet/?id=65b563e3-290a-4a27-9194-89f197448f99
NRC Publications Archive
Archives des publications du CNRC
This publication could be one of several versions: author’s original, accepted manuscript or the publisher’s version. / La version de cette publication peut être l’une des suivantes : la version prépublication de l’auteur, la version acceptée du manuscrit ou la version de l’éditeur.
Access and use of this website and the material on it are subject to the Terms and Conditions set forth at
Mechanical properties of FRP reinforcing bars at elevated temperatures
Mechanical properties of fibre reinforced polymer reinforcing bars at elevated temperatures
Wang, Y.C.; Wong, P.M.H.; Kodur, V.
NRCC-46121
A version of this document is published in / Une version de ce document se trouve dans : SFPE/ASCE Specialty Conference: Designing Structures for Fire,
Baltimore, MD., Oct. 2003, pp. 1-10
Mechanical Properties of Fibre Reinforced Polymer Reinforcing Bars at Elevated Temperatures
Y C Wang1, P M H Wong1 and V Kodur2
1The Manchester School of Engineering, University of Manchester, UK, 2Institute for Research in Construction, National Research Council, Canada
ABSTRACT
This paper presents the results of an experimental study of the mechanical properties of FRP reinforcement bars, used as internal reinforcement in concrete structures, at elevated temperatures. Two types of FRP bars namely: carbon fibre reinforced polyester bars of 9.5mm diameter and glass fibre reinforced polyester bars of 9.5mm and 12.7 mm diameter were used in the study. For comparison, conventional steel reinforcement bars of 10mm and 15mm diameter were also tested. Results from the experimental study show that the stress-strain relationships of FRP bars remained almost linear at elevated temperatures until failure. However, there was a gradual reduction in the failure strength of FRP bars at elevated temperatures, at an almost linear rate to zero at about 500oC. Their elastic modulus remained almost unchanged until 300oC-400oC. After this temperature, there was a sharp drop in the elastic modulus. These properties can be used as input in computer programs for modelling the fire behaviour of concrete structural members reinforced with FRP bars.
INTRODUCTION
An important feature of fibre reinforced polymer composites (FRP) is their extremely high corrosion resistance. This makes them suitable for use in structures subjected to severe environmental exposure. Applications for FRP bars as internal reinforcement in concrete structural members include parking garages, multi-storey buildings and industrial structures. In many of these applications provision of appropriate fire resistance is one of the major design requirements.
Similar to other materials, the properties of Fiber Reinforced Polymer composite materials deteriorate when exposed to fire. One of the major concerns with FRP reinforcing bars is the loss of strength and stiffness at elevated temperatures. There is very little information in literature on the variation of strength and stiffness of FRP with temperature [1,4,5].
To develop such information on strength and stiffness degradation with temperatures for FRP at elevated temperatures a joint research program between University of Manchester, U.K., and NRC was initiated. As part of this project, experimental studies on the tensile mechanical properties of steel and FRP bars at elevated temperatures were undertaken. Results from these experimental studies are presented in this paper to illustrate the comparative variations of tensile strength and stiffness of different types of FRP bars with traditional steel rebars. The objective of these tests is to develop material property data on the variation of strength and stiffness of FRP reinforcement bars at elevated temperatures that can be used in computer models for evaluating fire resistance of concrete structural members reinforced with FRP rebars.
TEST ARRANGEMENT
The tests were conducted in a purposely-built test rig in the Manchester School of Engineering (MSE) at the University of Manchester. This test rig consists of two parts: one for the preparation of test samples and one for loading test at elevated temperatures.
Preparation of test samples
The test samples were obtained by NRCC from manufacturers and were cut to 1.35 m in length and then shipped to MSE for undertaking strength tests. An important consideration of testing FRP rods is to ensure that failure occurs in the test specimen, not at the anchorage. Because of the low gripping resistance of FRP rods on the surface, the design of an appropriate anchorage system is the most important issue.
The ACI standard [1] does not have any specific recommendation on the anchorage system, other than giving information on how to use the test results to calculate the failure stress and the elastic modulus.
Different types of anchorage systems have been tried by a large number of researchers. So far, the most reliable method is to use expansive cement confined by a circular steel tube [3,6]. When curing, chemical reactions take place in the expansive cement and pressure is generated due to confinement by the circular steel tube. If the FRP rod is surrounded by expansive cement, the pressure in the cement will allow the FRP rod/cement interface to develop sufficient friction resistance to transfer failure from at the anchorage position at the end of the test specimen to within the specimen length. Important parameters in the design of an adequate anchorage system when using expansive cement are the length of the anchorage and the size of the steel tube. For this study, the Bristar 150 expansive cement was used. The nominal dimensions of the steel tubes were 48.3 mm in outer diameter, 3 mm in thickness and 350 mm length.
The manufacturer’s literature for this expansive cement gives a maximum safe operation temperature of 20oC. However, it was found out that at temperatures of 18 and 19oC, this cement produced the blown-off phenomenon and preparation of the test samples had to be aborted until temperature in the laboratory was lower. At a cooler temperature of about 15oC, the expansive cement performed satisfactorily.
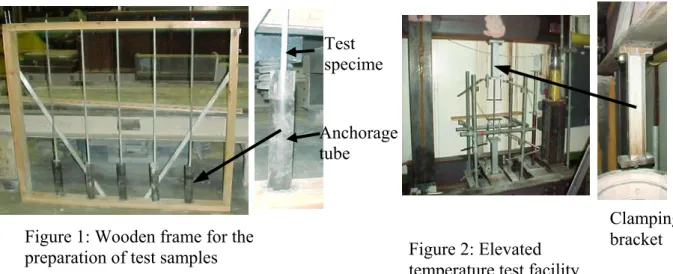
Another important issue is to ensure that the FRP specimens are aligned vertically and centrally in the anchorage tubes. To do this, a wooden frame has been fabricated. Figure 1 shows five test specimens being prepared in the wooden frame. The base of this wooden frame was fitted with 5 carefully machined steel housing caps for the anchorage steel tubes into which the expansive cement was poured. A hole with a diameter just bigger than the diameter of the test sample was drilled in the middle of each steel cap to allow the test bar to pass through. After cleaning, the anchorage steel tube was placed vertically into the steel cap. Silicone gel was then injected around the anchorage steel tube to secure it to the wooden base and to prevent leakage of the expansive cement. Once the silicone gel was hardened, a test specimen was pushed through the central hole in the steel cap.
To ensure vertical alignment of the test sample, the top of the wooden frame had five holes with a diameter just slightly larger than the specimen diameters so that the specimens fitted snugly to the wooden frame.
Once the expansive cement hardened in the anchorage tubes at the base of the wooden frame, the specimens were turned around for casting at the other ends.
Test specime Anchorage tube Clamping bracket Figure 1: Wooden frame for the
preparation of test samples Figure 2: Elevated temperature test facility
Typically, a batch of five specimens were cast on a Thursday or Friday and then tested in the following week. This was necessary to allow the expansive cement to develop and maintain sufficient confinement pressure.
Test setup
The elevated temperature tests were carried out in a purpose built facility. This facility is shown in Figure 2 and consists of a strong reaction frame, a hydraulic loading jack and an electrically heated kiln.
Figure 3 shows a schematic view of the test setup. The test sample assembly, including the bar and the
anchorage system, was
passed through the electrically heated kiln and then clamped to the strong reaction frame at both ends through a pair of clamping brackets (shown in Figure 2) at each end.
950mm 950mm Pin 200mm Kiln Specimen Loading jack Displacement transducer
Figure 3: Schematics of test rig
Loads were applied from the hydraulic jack as shown in Figure 3. According to the dimensions shown in Figure 3, the tensile force in the specimen is twice the applied load through the hydraulic jack.
All tests were conducted under the steady state condition. After a specimen was fixed as shown in figure 3, the kiln temperature was raised to the required temperature and then held
constant for about half an hour to allow the test specimen to reach the same temperature. While maintaining this temperature, the test sample was loaded to failure.
Four displacement transducers were attached to each test specimen as indicated in figure 3, two at each of the two locations of 200mm apart within the kiln to record the specimen axial deformations at each end. At each location, the two transducers, which were outside the kiln, were fixed, through a pair of ceramic rods, to a pair of metal brackets on the test specimen inside the kiln. Measurement of the displacement transducers started at the same time as loading and after the thermal expansion of the test specimen had occurred. Therefore, the displacement transducers measured the mechanical deformations of the test specimen, including creep but excluding the thermal expansion. However, because the loading stage was short, it is unlikely that creep was large.
Temperatures inside the kiln and on the specimen were continuously measured by thermocouples.
As part of the experimental studies, 57 strength tests were carried out on FRP and steel specimens. Each type of specimen was tested at five different temperatures, except for the 12.7 mm diameter GFRP bars which were tested at six temperatures. These include tests on steel reinforcing bars of two different diameters for comparison. Because all materials have variability in their properties, each test was repeated at least once. To generate as much information as possible, test temperatures for the GFRP and steel bars of two different diameters were arranged so that they covered as many temperatures as possible for each type of material. Table 1 gives a summary of all the tests. During the tests, temperatures inside the kiln and on the specimen were continuously measured by thermocouples.
Table 1: Test parameters for reinforcing bars
Specimen type Number of tests @ (x) temperature (oC) 9.5 mm GFRP (SG) 3x20, 2x100, 2x250, 3x350, 2x500
12.7 mm GFRP (BG) 2x20, 2x100, 2x200, 2x300, 2x400, 2x500 9.5 mm CFRP (C) 2x20, 2x100, 2x200, 4x400, 2x600
10 mm steel (SS) 2x20, 2x100, 2x200, 2x400, 3x600 15 mm steel (BS) 2x20, 2x100, 2x300, 2x500, 2x700
OBSERVATIONS AND RESULTS
1. In all tests the specimen was at almost the same temperature as the kiln when loaded to failure.
2. All GFRP and CFRP bars failed by fracture within the specimen length and not in the anchorage. Figures 3, 4 and 5 illustrate the failure of GFRP and CFRP reinforcing bars at ambient temperature. Elevated temperature specimens have lower strengths so that failure was also in the specimen lengths as at ambient temperature. The mode of failure, by fracture within the specimen length, validates the experimental set-up. 3. There was no fracture of the steel bar. This was because all steel bars were ductile and
the test setup could not allow for sufficient extension of the test bars to break them. Nevertheless, all steel bars were loaded to the effective yield range. The effective yield stress is defined as the steel stress at 0.2% proof strain, i.e. 0.2% permanent strain.
4. The displacement transducer system performed well for most tests. It failed to record data for the smaller diameter GFRP and CFRP bars at very high temperatures. This is because the resin in these reinforcing bars burnt and the displacement clamp system collapsed.
5. In one test on GFRP reinforcing bars the resin ignited when the temperatures were about 500° C (see Figure 7).
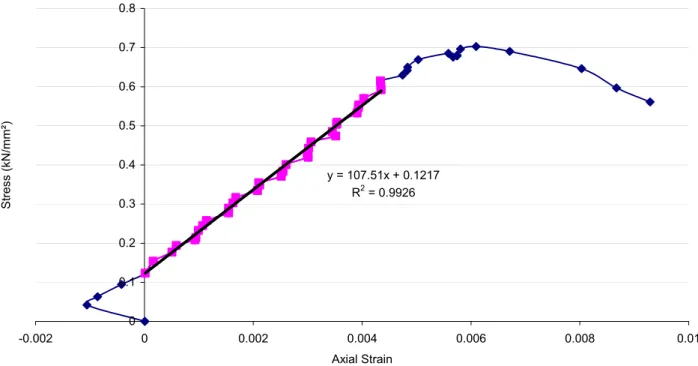
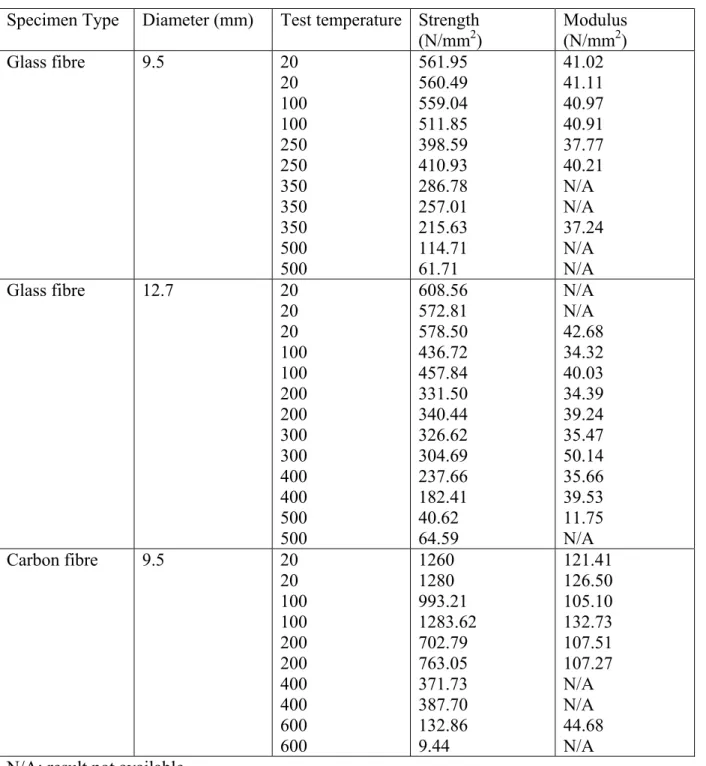
Table 2 gives the recorded strength and modulus of elasticity for each test specimen. The nominal test temperature was used, this temperature being very close to the actual specimen temperature. All GFRP and CFRP bars fractured and the failure strengths are calculated. Also, the stress-strain relationships of GFRP and CFRP bars are almost linear until specimen fracture. Figures 8 and 9 show examples of recorded stress-strain relationships of FRP reinforcement bars.
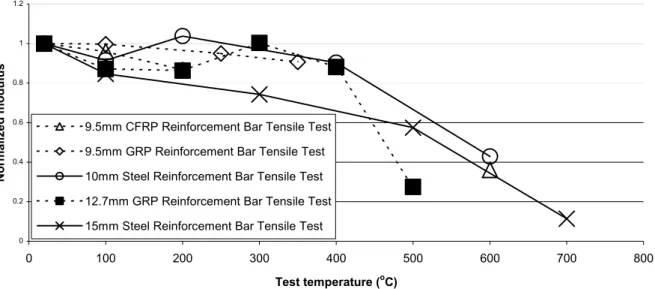
Figures 10 and 11 compare the normalized average strength and modulus curves of all five types of specimens.
Figure 7: Burning of resin at 500oC, diameter 12.7mm GFRP sample
Figure 4: Failure mode of a 9.5 mm GFRP bar at ambient temperature
Figure 5: Failure mode of a 12.7 mm GFRP bar at ambient temperature
Figure 8: Stress-strain relationship of CFRP bar at 200oC y = 107.51x + 0.1217 R2 = 0.9926 0 0.1 0.2 0.3 0.4 0.5 0.6 0.7 0.8 -0.002 0 0.002 0.004 0.006 0.008 0.01 Axial Strain S tress (kN/mm²)
Figure 9: Stress-strain relationship of 12.7mm diameter GFRP bar at 100oC y = 40.026x - 0.0183 R2 = 0.9975 0.00 0.05 0.10 0.15 0.20 0.25 0.30 0.35 0.40 0.45 0.50 0.0000 0.0020 0.0040 0.0060 0.0080 0.0100 0.0120 0.0140 Axial Strain S tress (kN/mm²)
Figure 10: Comparison between normalized modulus 0 0.2 0.4 0.6 0.8 1 1.2 0 100 200 300 400 500 600 700 800 Test temperature (oC) Normalized modulus
9.5mm CFRP Reinforcement Bar Tensile Test 9.5mm GRP Reinforcement Bar Tensile Test 10mm Steel Reinforcement Bar Tensile Test 12.7mm GRP Reinforcement Bar Tensile Test 15mm Steel Reinforcement Bar Tensile Test
Figure 11: Comparison between normalized strengths
0 0.2 0.4 0.6 0.8 1 1.2 0 100 200 300 400 500 600 700 800 Test temperature (oC) Normalized strength
9.5mm CFRP Reinforcement Bar Tensile Test
9.5mm GRP Reinforcement Bar Tensile Test
10mm Steel Reinforcement Bar Tensile Test 12.7mm GRP Reinforcement Bar Tensile Test
15mm Steel Reinforcement Bar Tensile Test
DISCUSSIONS
From Table 2, it can be seen that different duplicate tests on the same type of specimen at the same temperature produced similar results (<10% difference) at low temperatures (<350oC). The difference becomes greater at higher temperatures. This is clearly a result of decomposition of the resin. The fibres used to make the specimens are long fibres, but not continuous. Therefore, when the resin decomposes, the mechanical behaviour of the fibre composite becomes more influenced by the variable bond behaviour between the fibres and the decomposing resin. At temperatures of above 350oC, figures 10 and 11 show that both
carbon and glass fibre composites still have a high level of average tensile strength and elastic modulus. However, results of individual specimens in table 2 indicate a large variability of strengths at the same temperature. It is doubtful whether FRP reinforcement bars should be used at such high temperatures.
Figure 10 shows that, GFRP bars suffer very little loss in their Young’s modulus up to about before 400oC, retaining about 90% of its ambient temperature value. After this temperature, GFRP bars suffer a drastic reduction in their elastic modulus, with Figure 10 showing less than 30% of its ambient temperature value at 500oC. Results are not available for CFRP bars at the crucial temperature of 400oC due to collapse of the displacement measuring device. At temperatures up to 200oC, the results of CFRP bars are similar to those of GFRP bars. In contrast, steel reinforcement bars experience a steady decline in their Young’s modulus. From results in Figure 11, it is observed that there is considerable difference between results for the 9.5mm and 12.7mm GFRP bars at low temperatures, with the 9.5mm giving high strengths. The higher degradation of strength in the 12.7 mm diameter bars could partly be attributed to higher resin content in these bars and at high temperatures the resin gets damaged first. As mentioned previously, the nominal diameters of the reinforcement bars were used to calculate their strengths. Comparing results for GFRP and CFRP bars of the same diameter (9.5mm), it can be seen that reductions in CFRP strengths are greater than those in GFRP strengths. This is expected because CFRP bars have much greater strengths at ambient temperature. At elevated temperatures, the resin becomes more influential so that the absolute strengths of GFRP and CFRP bars become closer. This means that the relative reductions of CFRP bars are greater. The review of Blontrock et al [2] indicates that CFRP and GFRP composites follow an almost linear reduction in their strengths with temperature, with the strength of CFRP bars reduced to zero at about 500oC and GFRP bars reduced to zero at about 550oC. This is in agreement with the present test results. In comparison, steel bars reduce in their strengths at a lower rate than FRP composite bars. Also the variation of strength in steel reinforcing bars of two different diameters are very similar.
SUMMARY
The experiments were carefully and successfully conducted to determine the variations of strength and elastic modulus at elevated temperatures of FRP reinforcement bars. The main conclusion is that a temperature of about 350oC appears to be critical for FRP composite bars. Below this temperature, FRP composite bars retain a very high level (90%) of their original stiffness and duplicate test results are similar (less than 10% in difference). Strength reductions of different FRP bars are almost linear, giving about 45% and 35% of their original ambient temperature strengths for GFRP and CFRP composite bars. At higher temperatures, some FRP composite bars can still have high strength and stiffness. However, the variability in duplicate tests is very high and it is doubtful whether all FRP reinforcement bars will have sufficient strength at such high temperatures.
REFERENCES
1. ACI 440.1R-40, Guide for the Design and Construction of Concrete Reinforced with FRP bars; American Concrete Institute, Farmington Hills, MI, 2001
2. Blontrock, H., Taerwe, L. and Matthys, S., Properties of fiber reinforced plastics at elevated temperatures with regard to fire resistance of reinforced concrete members,
Proceedings of 4th international symposium on fiber reinforced polymer reinforcement for reinforced concrete structures, ed. Dolan, C.W., Rizkalla, S. H. and Nanni, A., ACI Special Publication 188, 1999, pp. 44-54
3. Harade, T., Idemitsu, T., Watanabe, A., Khin, M. and Soeda, K., New FRP tendon anchorage system using highly expansive material for anchoring, In Modern Prestressing Techniques and Their Applications, Proceedings Volumn II, FIP’93 Symposium, Japan Prestressed Concrete Engineering Association, 1993, pp. 711-718 4. Kodur, V.K.R., and Baingo, D. 1998. Fire Resistance of FRP Reinforced Concrete
Slabs. RC Internal Report No. 758. National Research Council of Canada, Ottawa, ON, 37
5. Kodur, V. R.; Harmathy, T. Z. "Properties of building materials" SFPE Handbook of Fire Protection Engineering, 3rd edition, P.J. DiNenno, National Fire Protection Association, Quincy, MA, pp. 1.155-1.181, 2002.
6. Lees, J.M., Gruffydd-Jones, B. and Burgoyne, C.J., Expansive cement couplers, A means of pre-tensioning fibre-reinforced plastic tendons, Construction and Building Materials, 9(6), 413-423, 1995
Table 2: Experimental Strength and Modulus of Elasticity of Test Samples Specimen Type Diameter (mm) Test temperature Strength
(N/mm2) Modulus (N/mm2) Glass fibre 9.5 20 20 100 100 250 250 350 350 350 500 500 561.95 560.49 559.04 511.85 398.59 410.93 286.78 257.01 215.63 114.71 61.71 41.02 41.11 40.97 40.91 37.77 40.21 N/A N/A 37.24 N/A N/A Glass fibre 12.7 20 20 20 100 100 200 200 300 300 400 400 500 500 608.56 572.81 578.50 436.72 457.84 331.50 340.44 326.62 304.69 237.66 182.41 40.62 64.59 N/A N/A 42.68 34.32 40.03 34.39 39.24 35.47 50.14 35.66 39.53 11.75 N/A Carbon fibre 9.5 20 20 100 100 200 200 400 400 600 600 1260 1280 993.21 1283.62 702.79 763.05 371.73 387.70 132.86 9.44 121.41 126.50 105.10 132.73 107.51 107.27 N/A N/A 44.68 N/A N/A: result not available