Bytes of Evolution
Essays on applying social physics lessons for management effectiveness by
Ali S. Kamil MASSACHUSETTS INSTITUTE
OF TECHNOLOGY B.S., Georgia Institute of Technology (2003)
Submitted to the System Design and Management Program,
in partial fulfillment of the requirements for the degree of
LIBRARIES
Master of Science in Engineering and Management
ARCHNES
at theMASSACHUSETTS INSTITUTE OF TECHNOLOGY June 2016
Ali S. Kamil. All rights reserved.
Massachusetts Institute of Technology 2016. All rights reserved.
The author hereby grants to MIT permission to reproduce and to distribute publicly paper and electronic copies of this thesis document in whole or in part in any medium
now known or hereafter created.
Signature redacted
Author
--r- Ali S. Kamil
System Design and Management Program May 13, 2016
Certified by
Signature redacted
U
I Dr.Alex Pentland Toshiba Professor of Media Arts & Science MIT Media Laboratory Thesis SupervisorSignature redacted/
Accepted by
V c-~'' a rick C. Hale
Senior Lecturer, Engineering Systems Division Director, System Design & Management Fellows Program
Acknowledgements
I came to MIT in 2012 with the goal of better understanding how ubiquitous collection and use of data can help inform and advance our lives. I pursued disparate projects and ventures during this time. After almost four years, this thesis is a culmination of my work at MIT. I would like to thank my advisor, Dr. Alex 'Sandy' Pentland, for always supporting, encouraging, and guiding me through this journey.
I would like to recognize Dr. Edgar Blanco, formerly of MIT CTL, for his energetic input and pragmatic advice in pursuing a project with him and a startup that is now Wise Systems Inc. A special thanks to Joost Bonsen of the Media Lab for championing our projects and providing creative input. I would like to thank my parents Syed Muhammad Tariq and Syeda Mumtaz Tariq for instilling in me the drive to always improve myself, not being deterred by failure, and always believing in the virtues of hard work and perseverance. I am what I am today because of you.
My friends and colleagues who supported me in the projects that are part of this thesis - Dmitry Lyan, Elli Suzuki, and Nicole Yap for the LVPEI project. Chazz Sims II, Layla Shaikley, and Jemel Derbali for the crowdSOS project. My friends who have enriched my life through their company. In Boston -Prof. Usman Ahmed Khan, Sara Butt, Nimra Taqi, Ahmed Bajwa. My friends from Georgia Tech - Shehryar Khan, Osman Yousuf, Hasnain Mandviwala. My friends in Dallas - Adnan Khan and Fareeha Khan and many others. Here's to you all.
My wife Sama Malik who has been a constant support throughout my graduate studies at MIT and Harvard and in my life. She took many sacrifices to help me in this pursuit. Words wouldn't do justice to thank her. We have been through a lot in the past four years and I want to dedicate this thesis to her as a token of my appreciation for her love and support.
Finally, my daughter and pride Zayneb Kamil who has filled our lives with joy since her arrival last year.
Bytes of Evolution
Essays on applying social physics lessons for management effectiveness by
Ali S. Kamil
Abstract
How can we construct socio-technical system such that they constantly evolve to improve themselves? This is the central question of this thesis. We propose a "senseable Kaizen" philosophy. This involves the central tenets of the Kaizen strategy while incorporating passive and active sensing data collection to analyze the easily missed social cues critical to understand and improve a socio-technical system. We test our hypothesis by applying it to three disparate systems ranging in size, complexity, and processes.
In the LVPEI experiment, we identified that prolonged patient wait times were the outcome of the lack of adherence to appointment-based system. Only 33% of the patients showed up on time. The large volume of walk-in patients resulted in build-up of patients during peak-times (11am - 3pm) this contributed to 23% drop in time for patient work-up, 39% drop in patient-doctor time, and 16% increase in cross-referrals for patients. To compensate the staff worked 24% over their allotted hours.
In Santiago, Chile working with urban logistics carriers, we found that the institutional knowledge of drivers plays a key role in understanding and building delivery routes. Only 53% of the drivers adhered to the "optimized" route provided to them by the dispatcher. Traffic congestion, delays at customer sites, familiarity with the customer, and on-site parking led to drivers making decisions that best suited their needs.
close social ties that develop due to the shared experience of festival attendees and the need to preserve privacy and security of users in a
platform like ours.
Finally we propose a refined model of Kaizen strategy incorporating a "living lab" approach to managing socio-technical systems. We portray a world where socio-technical systems are continuously evolving using the bytes of data collected from an open innovation ecosystem.
Thesis Supervisor: Dr. Alex "Sandy" Pentland
CONTENTS
ABSTRACT 6
CHAPTER 1 - INTRODUCTION 12
1.1 OBJECTIVE 13
1.2 STRUCTURE 14
CHAPTER 2 - DEFINING KAIZEN 17
2.1 CONTINUOUS IMPROVEMENT 17 2.2 KAIZEN PROCESS 18 2.2.1 PLAN 19 2.2.2 Do (EXECUTE) 19 2.2.3 CHECK (REFLECT) 19 2.2.4 ACT (IMPROVE) 20
2.3 PROBLEMS WITH KAIZEN 21
2.2.1 ILLUSION OF EXPLANATORY DEPTH 21
2.2.2 DUNNING-KRUGER EFFECT 21
2.2.2 MINORITY INFLUENCE 22
2.2.3 INDECISION 22
2.2.4 CONFORMITY & OBEDIENCE 23
2.2.4 PERSONAL BIASES 23
2.3 DATA-DRIVEN IMPROVEMENT 24
2.3.1 DATA AS THE PILLAR OF KAIZEN 24
2.3.2 DATA COLLECTION METHODS 25
2.4 PRIVACY AND OWNERSHIP 27
2.4.1 INFORMED CONSENT 28
2.4.2 PERSONAL DATA STORE 28
2.4 EXPERIMENT DESIGN 29
CHAPTER 3 - MANAGING PATIENT WAIT TIMES 32
3.1 PATIENT WAIT TIMES AT LVPEI 32
3.2 MAPPING PATIENT JOURNEYS 33
3.2.1 EXPERIMENT DESIGN 35
3.2.2 DATA COLLECTION 36
3.3 ANALYSIS 37
3.3.1 SYSTEM DYNAMICS MODEL 38
3.3 RESULTS 41
3.3.2 SERVICE TIMES FALL BY TIME OF DAY 43
3.3.3 OVERWORKED STAFF 45
3.4 DISCUSSION 47
CHAPTER 4 - LAST MILE LOGISTICS 48
4.1 PROBLEM WITH LAST MILE LOGISTICS 49
4.1.1 SCHEDULING 49
4.1.2 BEST SCHEDULES FAIL 51
4.1.3 DRIVER ADHERENCE 52
4.2 TRACKING DRIVER ROUTES 52
4.2.1 EXPERIMENT DESIGN 52
4.2.2 DATA COLLECTION 53
4.4 RESULTS 55
4.4.1 DRIVER KNOWLEDGE 55
4.4.2 TRAVEL TIMES 56
4.4.3 PROBLEMS WITH MASTER DATA 58
4.4.4 SOCIAL TIES 58
4.5 DISCUSSION 59
CHAPTER 5 - CROWDSOURCING INCIDENT REPORTING 61
5.1 INCIDENTS AT ROSKILDE 61
5.2 CROWDSOURCING INCIDENT REPORTING 63
5.2.1 EXPERIMENT DESIGN 64
5.2.2 DATA COLLECTION 65
5.3 RESULTS 70
5.3.1 PRIVACY AND SECURITY 70
5.3.2 SOCIAL TIES 70
5.3.3 COGNITIVE LOAD & FEAR 71
5.3.4 TRANSIENCY AND TRAINING 71
5.5 DISCUSSION 72
5.5.1 APPLICATIONS FOR DEVELOPING REGIONS 72
5.5.2 SOCIAL CONTEXT AND HUMAN ELEMENT 73
CHAPTER 6 - TOWARDS A KAIZEN "LIVING LAB" 75
6.1 DATA-DRIVEN KAIZEN 75
6.1.1 "SENSEABLE" KAIZEN 76 6.1.2 KEY ELEMENTS OF "SENSEABLE" KAIZEN 78
6.2 CONTINUOUS IMPROVEMENT IS INNOVATION 79
6.3 HUMAN ELEMENT 80
6.3.1 SOCIAL TIES 80
6.4 PRIVACY & SECURITY 81
6.4.1 OPENPDS 81
6.4 SoCIo-TECHNICAL SYSTEM AS A "LIVING LAB" 82
CHAPTER 7 - CONCLUSIONS 84
7.1 SUMMARY 84
7.2 FUTURE WORK 86
List of figures
FIGURE 1 - KAI (CHANGE) ZEN (GOOD) ... 17
FIGURE 2 - PDCA CYCLE FOR KAIZEN ... 19
FIGURE 3 - EXPERIMENT DATA COLLECTION ARCHITECTURE...30
FIGURE 4 - PATIENT SERVICE TIME VARIABILITY...33
FIGURE 5 - PATIENT JOURNEY THROUGH THE CLINICS AT LVPEI...34
FIGURE 6 - PASSIVE SENSING THROUGH BLUETOOTH ... 36
FIGURE 7 - BLUETOOTH BEACON INSTALLED AT LOCATIONS...36
FIGURE 9 - PATIENT ARRIVAL BY TIME OF DAY (SINGLE CLINIC)...42
FIGURE 10 - PATIENT'S ADHERENCE TO APPOINTMENTS (ALL CLINICS)...42
FIGURE 11 - DECREASING SERVICE TIME BY TIME OF DAY ... 43
FIGURE 12 - DROP IN INVESTIGATION TIME PER PATIENT ... 44
FIGURE 13 - WORKUP TIME FOR PATIENTS...44
FIGURE 14 - IMPACT OF PRESSURE ON PERFORMANCE ... 45
FIGURE 15 - AVERAGE W ORKDAY...45
FIGURE 16 - PASSIVE SENSING THROUGH GPS...53
FIGURE 17 - DELIVERIES AROUND SANTIAGO ... 54
FIGURE 18 - PLANNED VS. ACTUAL ROUTES ... 56
FIGURE 19 - ROUTES PLANNED USING EUCLIDEAN DISTANCE ... 57
FIGURE 20 - ROUTES PLANNED USING TRANSPORTATION NETWORK...57
FIGURE 21 - ROSKILDE FESTIVAL 2013...62
FIGURE 23 - ACTIVE SENSING THROUGH CROWDSOURCING ... 65
FIGURE 24 - SELF-REPORTING THROUGH CROWDSOS APPLICATION...66
FIGURE 25 - INCIDENT NOTIFICATION TO VOLUNTEERS...67
FIGURE 26 - MAP OF ROSKILDE ON THE APP...68
FIGURE 27 - REPORTED AND RECORDED INCIDENTS...69
FIGURE 28 - APPLICATIONS FOR DEVELOPING CONTEXT ... 73
FIGURE 29 - REVISED PDCA CYCLE...76
Chapter 1
Introduction
Biological evolution turned a fish out of water into what is now the dominant species on this planet. Through natural selection, disadvantageous traits were dismissed leaving behind the dominant ones resulting in what we are today. Evolution doesn't have to be biological, and the process of continuous improvement through natural selection can be applied to socio-technical systems to enhance their efficacy. So how can we design and build socio-technical so that they continuously evolve and adapt to the changing environment? This is the central tenet of this thesis.
Time and again businesses and socio-technical systems falter as they fail to respond and adapt to changing environment. Change is hard and adapting to it is harder. There are only a handful of examples of systems that have evolved and reinvented themselves to survive and prosper. This ability to reinvent and adapt the system to the environment is the key to survival of any species, be it biological or socio-technical systems. With the goals of increased productivity, effective utilization of resources, and keeping everyone driven, management of socio-technical systems is a complicated dance that has resulted in almost a million books on management of organizations when searched on amazon (Management Books on Amazon, 2016).
Market dynamics and shareholders dictate the trajectory and strategy of a company but that is only a single measure of the overall health of an organization. Companies have adapted to a yearly or quarterly review to gauge their performance. However, anyone who has tried his or her hand at management understands the excruciatingly painful process that is the
annual or quarterly review. Driven by the leadership, organizations, groups and individuals are evaluated on their performance, given feedback, and new goals are written for the next quarter or year. With limited use of hard data, it is easy to see why such evaluations fail to achieve their intended results.
Many organizations have embraced continuous improvement philosophies, which espouse the need to continuously evaluate performance, identify bottlenecks, and improve in the next cycle. Total quality management (TQM) (Martinez-Lorente, Dewhurst, & Dale, 1998), Agile Development (Collier, 2011), and Toyota Production System (TPS) (Manufacturing.) are just a few examples. Most trace their roots and inspiration from the "Kaizen" continuous improvement methodology pioneered in the late 70's. Kaizen prescribes the need to continuously monitor processes, making it a people centric approach. It puts the responsibility of process improvement squarely on the shoulders of the people conducting the day-to-day affairs. Everyone from the CEO to the janitorial staff is responsible for monitoring and improving the processes daily. Kaizen is steeped in scientific method of evaluating the data and finding areas for improvement. It is a philosophy of never being satisfied with what was accomplished last week or last year (Barnes, 1996).
1.1 Objective
In this thesis, we describe a data-driven approach to continuous improvement or a "senseable kaizen" philosophy. This approach includes employing the central tenets of kaizen while employing the techniques of social physics for measurement and evaluation. Our methods involve incorporating the use of data and monitoring the social signals (Nathan Eagle, 2005) emanated by the employees to gauge and measure management effectiveness. This technique involves turning each professional circle into a "living lab". Kaizen methods, which are steeped in the scientific
methods, employ the "reflection phase" - where after every iteration or release, the team reflects on what went well? What went wrong? And how can each of us improve? We propose a reflection phase powered by data collected from each employee - from the CEO to the janitorial staff.
We test this hypothesis by applying it to three different projects ranging in size, complexity, and processes. By collecting data from subjects through passive and active sensing techniques we analyze the easily missed social cues that are critical to understand and improving a socio-technical system. We apply these lessons to three different settings:
1. A large gathering of music enthusiasts at a global music festival. Allowing the crowd control volunteers to actively report incidents as they are observed.
2. A not-for-profit eye hospital in India struggling to meet demand and managing the patient wait times in its clinics
3. A logistics career implementing a route optimization process but unable to reach the improvements that the optimizations promised The principal method of research included data collection through active and
passive sensing techniques, observations on-site, and analyzing the resulting data set using traditional analysis methods, system dynamics techniques, and data visualization.
1.2 Structure
The second chapter explains the various aspects of the Kaizen continuous improvement philosophy and why a more data-centric approach is necessary to the "reflection" phase of the process. We discuss why surveys and direct communication from subjects is not enough and a passive sensing approach is necessary to get insights necessary for the improvement of the process. We also discuss the design of the three experiments conducted and the data collection mechanisms utilized.
The third chapter dives into our first project at the LV Prasad Eye Institute (LVPEI), a not-for-profit eye hospital in Hyderabad India. The LVPEI hospital has a chronic issue of prolonged patient wait times; a problem pervasive in regions with limited medical facilities. We use passive sensing Bluetooth devices to collect data on the patient journey through the hospital, interview the patients plus the hospital staff, and map the daily journey of patients. This data is then used to identify bottlenecks in the flow, impact on the service, and burnout of the staff.
The fourth chapter dives into our work with a traditional logistics career in Santiago, Chile. Operating a fleet of 34 trucks, the carrier utilized traditional fleet management software to construct optimal daily routes for drivers and tracking usage. However, the carrier still suffered from classic logistics issues of late deliveries, high operational costs due to fuel and vehicle burn, and driver absence. We utilize the on-board fleet management software to capture real-time GPS feeds to record and report findings. This passive sensing helped us to capture data on driver routes as well as driver behavior when conducting deliveries.
The fifth chapter discusses our project at the Roskilde Music Festival in Roskilde, Denmark. Roskilde festival attracts over 130,000 attendees every year. In a counter-culture environment, traditional law enforcement methods fail and are supported by volunteers in charge of crowd control and crime prevention. We utilized self-reporting (active sensing) and passive sensing methods supported by a smartphone application to collect data from the crowd-control volunteers. This enabled us to help Roskilde organizers collect data on crowd management and adjust the festival organization as lessons are learned daily.
Finally in chapter seven, we propose a sensor driven "senseable" Kaizen continuous improvement process or a living lab for socio-technical systems.
We describe the key steps of the modified kaizen and its potential applications to various other management systems.
Chapter 2
Defining Kaizen
In this thesis we discuss an enhanced version of the Kaizen process. We believe for continuous improvement to work effectively, organizations or socio-technical system must embrace the use of data to evaluate the performance holistically which involves not just taking self-reported information through surveys or discussions but passively collected data on how people, processes, and interactions take place. Next few sections will discuss the current Kaizen process, its shortcomings, our proposal for a data-driven approach, and discussion on experiments we conducted to test our hypotheses.
2.1 Continuous Improvement
Kaizen, Japanese for improvement, is a continuous improvement philosophy that aims to achieve a constant drive towards organizational (and self) improvement.
Figure 1 - Kai (change) Zen (good)
Continuous improvement techniques such as Kaizen have been around for over 3 decades. Originally adopted in Japan after the second world war, Kaizen dictates that everything can be continuously improved through
evaluation, reflection, and planning for the next cycle. It begins with the acceptance that there will always be problems (nothing is perfect) and only
through constant self-evaluation and reflection can improvement be achieved. It involves everyone in the organization from the CEO, to
managers, to assembly line workers.
Kaizen techniques became famous when Toyota used Kaizen to rise to become the world leader in automotive in the eighties. Rather than undertake large projects, Toyota's staff was encouraged to identify problems, no matter how small, trace their root causes, and implement all necessary solutions (Manufacturing.). The implementation of Kaizen principles has been viewed as one of the key factors to Japanese competitive success. Next we
will discuss the key tenets of Kaizen.
2.2 Kaizen Process
The key element of Kaizen is an iterative cycle of improvement, be it organizations or individuals. This means, organizations or individuals must establish a methodical process towards a task or system, continuously evaluate performance, and improve in their next cycle of execution. This is a constant, never-ending improvement process. This philosophy aligns well with modern day manufacturing processes (and software processes), which operate in an iterative production process.
The Toyota Production System is well known for its use of Kaizen, where all personnel in its moving production line must stop all operations in case of errors, and work together to resolve the problem and make improvements to avoid such future issues. There are four key components of a Kaizen cycle (also known as Deming cycle) Plan-Do Check-Act as depicted in figure 2.
Figure 2 - PDCA Cycle for Kaizen
Plan-Do-Check-Act is a 4-step iterative cycle of continuous improvement adopted by the Toyota Production and other businesses.
2.2.1 Plan
This is the first step in the iteration. Starts out with constructing an overall plan for the cycle. Understand what needs to be achieved and improved by setting goals and targets for the cycle. Establish success metrics to measure performance. By establishing a plan for the cycle, the team or organization can understand the goals and targets and understand which areas need to be
improved in the next iterative cycle.
2.2.2 Do (Execute)
No plan is complete without action. This is the execute phase where the team works together to implement an approach. Everyone in the team is encouraged to keep notes and data on their experiences so that this
information can be reviewed in the "check" or "act" phase.
2.2.3 Check (Reflect)
The analysis phase of the cycle, everyone from the production line worker to the CEO is expected to reflect on the concluded cycle and provide input or
MENNEN-data into their experience. Individuals and teams are expected to be self-critical and honest in identifying what went right, what went right, and what was the cause?
Results from the cycle are evaluated against the plan. Were the goals achieved? Did the team stick to the "plan" or deviate? What was the root cause of the problems observed? Results from this phase inform the next "act" phase of the cycle.
2.2.4 Act (Improve)
Take steps to improve for the next cycle. If the results obtained in the "check" phase point towards improvement from the previous cycle, then make the new process the standard or baseline for the next cycle. However if the results show that the organization or system regressed, then keep the existing baseline in place. In either of the cases, the team and organization
have a learning opportunity for the next cycle.
The PDCA process ensures organizations are continuously evolving and changing with their environment. It is akin to biological evolution where unnecessary or suboptimal elements are eliminated and improvement is achieved for the next cycle of operation. Change is hard and numerous examples exist of organizations that become extinct as they fail to adapt to their environment. The Kaizen approach, when followed correctly, has proven to be able to bring about a continuous evolution for organizations. However, in the spirit of Kaizen, we believe nothing is perfect and the Kaizen process itself needs a rethinking. In the next section we will discuss some of the shortcomings and what we can do to improve it.
2.3 Problems with Kaizen
Despite its goals of continuous improvement and enforcing the reflection phase, the Kaizen process suffers from key drawbacks. These make it slow to adapt and blunt the effectiveness of the continuous improvement goals. We will discuss each item in detail.
2.2.1 Illusion of explanatory depth
The Kaizen process relies on its practitioners to accurately and truthfully reflect on their experience with the previous performance period. It assumes that the practitioners know the full details of what went right, wrong, and how they want to improve for the next phase with clear precision. Most can recall the glaring issues or incidents of the past but very few actually remember or can explain with detail the problems of the past iteration and reflect on it. Kaizen relies on the human tendency to recall and reflect objectively. We believe it is an optimistic and an almost unrealistic goal.
Most of us think we understand the complex phenomena with much greater precision, coherence, and depth than we actually do. In psychology it is referred to this cognitive barrier the illusion of explanatory depth (Leonid
Rozenblit, 2002). Meaning we think we fully know something when we actually do not. This is the major roadblock to having an effective Kaizen continuous process for socio-technical systems. Without a proper and detailed understanding of the problem, we are bound to repeat it.
2.2.2 Dunning-Kruger Effect
Continuous improvement processes are collaborative, no change or improvement will be possible if the team members don't work together. This collaborative nature enables a diverse point of view from its members and allows for teams to reflect and plan improving for the next cycle. However
these collaborative exercises can easily get influenced by minority influences or diluted by impractical or false opinions.
In self-evaluations of driving ability, job performance, and even immunity to bias, we tend to polish our image. Called the Dunning-Kruger effect, which refers to the cognitive bias where relatively unskilled persons suffer illusory superiority, mistakenly assessing their ability to be much higher than it really is. Collaborative approach to Kaizen will suffer from this illusory superiority of its members. Not everyone will have a useful opinion, however it will be heard and taken into account.
Knowing this, people might censor themselves more, thereby cutting back the very type of informal and free form creativity that most businesses need more of and which is necessary for Kaizen to work effectively.
2.2.2 Minority Influence
Large groups are also prone to minority influences. This is a form of social influence that is attributed to continued exposure to a consistent minority position in a group. Such an influence generally emerges after a period of time and represents the views of the minority. Kaizen continuous improvement processes are prone to such influence leading to erroneous views and outcomes.
2.2.3 Indecision
People also suffer from indecision and social influence. It requires a certain mental fortitude and decisiveness to truly understand the issues and reflect on them. Kaizen reflection phase can easily be effected by indecision of its individuals and landing on an opinion that is popular. It will be recorded as a
unanimous decision however it may not represent the view of every member of the group. Such decision-making is prone to conformity and obedience.
2.2.4 Conformity & Obedience
Self-image or what people think of us plays an important role in how we act and behave in public. We want to project a view that is not considered out of the ordinary. This behavior of conformity was demonstrated in a classic study conducted by Stanley Milgram where human subjects deliberately went against their conscience to be obedient to authority. Another experiment showed how college students deliberately gave wrong answers to simple visual judgment tasks rather than go against the majority of the group
("Conformity and Obedience.", 2016).
Obedience and conformity are clear psychological barriers that can (and do) make Kaizen exercise ineffective. There is an underlying assumption that the leadership or the larger culture of the system will support openness and willingness to hear unpopular opinions. The concept of "safe" space must exist to allow all opinions (however unpopular) to be heard and evaluated. Without such an environment and culture Kaizen exercise will devolve into working to project the popular and "safe" points of view.
2.2.4 Personal Biases
Anyone who has had professional experience in industry (or academia) can attest to the existence of corporate politics and personal biases in making decisions. These biases manifest and can influence even the simplest scenarios. Decisions are not made for the best interest of the company but for personal advancement and agenda. Such instances and influences corrupt the goals of the continuous improvement processes. In the current Kaizen model, there is limited ability to bypass personal biases.
2.3 Data-driven improvement
The previous sections highlighted the human cognitive deficiencies and personal biases that can creep in and corrupt the kaizen continuous improvement process over time. To counter that there is need to continuously collect and evaluate data on the processes, interaction, and outcomes from a socio-technical system. Human deficiencies are not going to go away; only through the scientific method can we achieve an unbiased view of the past, eliminate defective elements, and evolve for the better.
2.3.1 Data as the pillar of Kaizen
Socio-technical systems must be designed and built with the premise of obsessive data collection and processing. Unbiased and unaltered data can serve as the source of truth and help inform the reflection phase of the process. To effectively collect data we believe the design must focus on three key elements of a socio-technical system: people, processes, and their interactions with the system. We will discuss each in subsequent detail.
People
Humans are the key elements of a socio-technical system. As we saw earlier the kaizen process breaks down due to human cognitive deficiencies and biases. Through data collection on human behavior, mobility, and preferences we can identify these deficiencies as they emerge, understand the behavior, and take steps to counter them. Personal privacy and security are clear concerns but through informed consent and participation of the members a transparent process can be constructed. (we will discuss privacy in section 2.4)
Processes
Many organizations collect data on processes and their effectiveness. Popularly referred as the key performance indicators (KPIs), these are used as an indicator for overall performance of a socio-technical system. Medical clinics use patient processing time as an indicator of their streamlined approach, law enforcement views crime rates in a month as a barometer for their law enforcement processes, and on-time delivery is an indicator used by delivery operations. Organizations practicing Kaizen already collect this data to understand their performance, however it is only a subset of the data
required to gauge overall performance. Interactions
Connections between the elements of a socio-technical system provide social signals about how people interact, behave, and perceive a given process. Interactions form the basis to properly understand personal biases and cognitive limitations of the people involved. They also provide us clues into the effectiveness of a system when interacting with people or other systems.
Who is talking to whom? Does everyone have a voice in the decision-making or reflection phase? How are ideas flowing through the organization? These are questions that indicate the culture of an organization. Data on these interactions is necessary to gauge the overall health of the system.
2.3.2 Data collection methods
ICTs
In order to collect data on people, processes, and their interactions we need probes that can constantly monitor and record information pertaining to location, mobility, environment, interactions, and behaviors. The users should also carry such probes all the time to be effective. Constructing such a probe and enforcing its usage is impractical. Fortunately we live in a world
where information and communication technologies (ICTs) are pervasive (Forecast-of-mobile-phone-users-worldwide 2020).
The modern mobile devices are computing powerhouses carrying more computing capacity than the computer onboard the Apollo 11 lunar module. Besides computing power these devices come equipped with accessories such as a camera, voice recorder, GPS tracker, and mobile phone tracker along with a myriad of sensors - accelerometer, Bluetooth, gyroscope, environmental (pressure, humidity, temperature), luminosity, and even radiation detector (Radiation-detector-in-your-smartphone, 2014).
Through these smartphones and the sensors embedded in them, we can collect the data necessary to analyze and evaluate performance of a socio-technical platform. The users can either self-report (active) the data or allow the phone to collect data in the background (passive)
Active Sensing
Active sensing refers to the ability of users to self-report their observations as and when they are witnessed or experienced by them. This form of data collection is not much different from using surveys, feedback forms, or self-reflection mechanisms. The current form of Kaizen incorporates self-reporting and reflection as well but as discussed suffers from various cognitive and social biases.
We recommend an active sensing model that allows users to anonymously share their feedback and input without divulging their identity. This form of anonymity tackles the issues of conformity and obedience, indecision, and minority influences. While it still prone to personal biases and Dunning-Kruger effect, anonymous self-reporting is a valuable avenue to hear directly from the team.
Passive Sensing
Passive sensing refers to the ability to collect data in the background with minimal or no engagement from the user. Mobile devices can collect location data using the GPS sensor, movement and speed using the accelerometer, proximity and interactions using Bluetooth sensors. Passive sensing enables us to collect micro-level details on a minute-by-minute basis about individuals in the system and truly understand their behavior, actions, and interactions. The field of "reality mining" (Pentland N. E., 2005) has already shown how using passive sensing we can understand human behavior, mobility, and predict actions.
Passive sensing is the key to building a data driven Kaizen model. As we will see in later chapters, using the onboard sensors on ICTs we can track patterns and behaviors over time. We can see not only who interacted with whom but precisely when, so managers and employees to better understand how subtle interactions played a role in impacting production or a certain decision. This is a clear advantage of passive sensing not possible through questionnaires and surveys - or active sensing.
This automation negates the possibility of personal or cognitive biases that creep in with self-reporting. Passive sensing and subsequent analysis allows us to truly understand the shortcomings of a socio-technical system and is necessary to our proposed 'senseable Kaizen' model.
2.4
Privacy and Ownership
The purpose of passive sensing in our proposed approach is to record and evaluate micro-signals that are missed in the traditional self-reporting mechanisms in the Kaizen process. However there are clear privacy and ethical challenges that exist that must be accounted for when designing a data-driven model. Data collected on human subjects can be used to track
and evaluate them surreptitiously. Such use of data is not only counterproductive for organizational improvement it can also lead to low morale among employees. Research has shown that organizations that trust and empower their employees promote loyalty and higher team morale (Team, 2016).
2.4.1 Informed consent
Transparency is key to giving users confidence and trust of the process. This means making passive data collection completely voluntary for each employee and allowing them to view and analyze the results unaltered. Informed consent is prevalent in the medicine where patients are made aware of their condition and permission is requested before proceed with treatment options (Medicine, 2016). A similar informed consent model can be applied for passive data collection in our model.
We propose making passive data collection from users phones to be completely voluntary. Organizations can share the goals of the continuous improvement process and the benefits it brings to the organization as well as to the personal growth of employees. Transparency of the process will give confidence to the employees to realize the benefits of the data-driven approach and not feel their privacy is illegally compromised.
2.4.2 Personal Data Store
Besides informed consent, we also propose allowing users to view and delete recorded data at any point in time if they feel their privacy will be compromised. This data could be stored in "personal data stores" - say user's laptops or mobile devices, so that it's decentralized and managed by the user them. Users should also have the option to restrict data collection by timing (during work hours - 9am-5pm) and by geography (within the office
collected but are necessary to encourage uptake from users giving them confidence of their personal privacy.
2.4
Experiment Design
To test our proposed "senseable Kaizen" model, we conducted three field trials in disparate settings.
Hypothesis
The goal for these experiments was to showcase a data-driven approach to Kaizen continuous improvement process. As we saw earlier, the Kaizen method and its many derivatives rely on the reflection phase, which is driven by self-reporting mechanisms from the people and measures outcomes of processes through KPIs'. We propose a data-driven method for the "reflection" phase that allows an organization to collect micro-level details on its people, processes, and their interactions in a socio-technical system. Through this we believe an organization can objectively evaluate performance and make decisions based on the facts emitted from the active and passive activity of the users and the underlying system.
Data Collection
We utilized ICTs to be able to collect data both actively and passively from the users. We used smartphones and their embedded sensors to collect data on users passively. The following data items were recorded:
- Mobility - movement of people through space - Interactions - who talked to whom and when
- Engagement - how long did the subjects spend time at a given location
We equipped the smartphone application with a self-reporting application to allow users to report incidents as they experience or witness them. We also
used Bluetooth sensors, which were installed, in closed spaces to understand spatial proximity and the time spent by users at a given location. Smartphone application communicated with the Bluetooth sensors to record proximity and time.
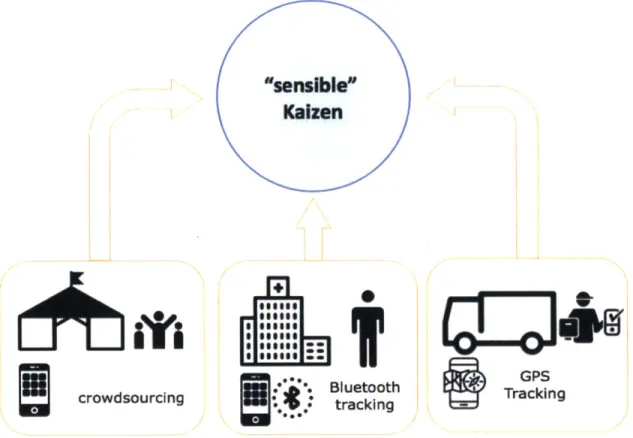
Collected data was stored in the cloud to facilitate ease of storage and access. Refer to figure 3 below for details on our data collection architecture.
"sensible"
Kaizen
nit-so
crowdsourcing+-wAP
rtI
::**o. Bluetooth GPSkin
0: tracking Takn
Figure 3 - Experiment Data Collection Architecture
We also collected data on the status quo for the three socio-technical systems. For the LVPEI experiment we looked at the current rate of patient flow and the wait times for patients. For the crowdSOS experiment, we recorded the current incident rate, their locations, and the response time of volunteers. For the last-mile logistics, we looked at on-time delivery numbers, miles traveled, and time on road for drivers. Using these as
baseline we interviewed participants in these socio-technical system to understand their experience and behavior.
Analysis & Evaluation
We used qualitative and quantitative methods to analyze and evaluate the data collected for our experiments. For the LVPEI experiment, we used the System Dynamics modeling tool to simulate the results and make projections about the outcomes of the status quo. For the crowdSOS experiment we used statistical analysis identify hot spots or zones of incidents, response rate of volunteers, and projected outcomes. For the last-mile logistics experiment we used linear and nonlinear programming methods to construct and evaluate driver routes.
We also used data visualization tools to visualize the data collected and map the behavior of patients, volunteers, and drivers in our experiments.
The next three chapters will discuss each experiment we conducted applying the data collection, evaluation, and privacy preservation methods we discussed earlier.
Chapter 3
Managing Patient Wait Times
In this chapter we apply our "senseable Kaizen" approach to analyze the prolonged patient wait times at the LV Prasad Eye Institute in Hyderabad, India. Using passive sensing Bluetooth devices we map patient journeys through the hospital and build an understanding of the bottlenecks in this
socio-technical system.
LVPEI has served over 15 million patients since its inception in 1987. Over half of these patients were served at no charge irrespective of the complexity of care. As a not-for-profit non-government eye care clinic in southern India, LVPEI's vision is rooted in the belief that no patient looking for care should be turned away. One of the ways this vision is realized is through the walk-in counter. Patients without prior appointments can arrive at the hospital, see a counselor, and get an appointment with a doctor on the spot. This results overbookings and incorrect schedules which creates a classic problem for hospitals of prolonged patient wait times..
3.1 Patient wait times at LVPEI
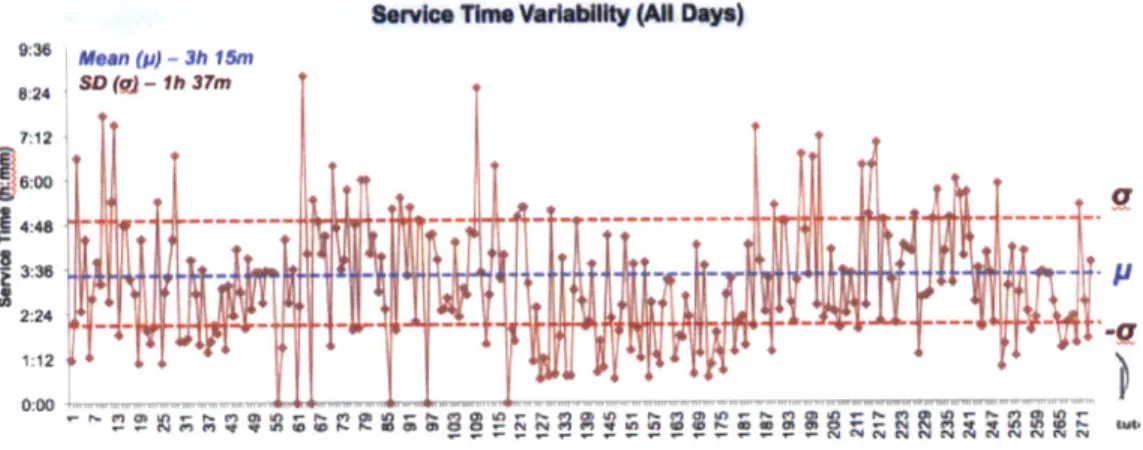
LVPEI has 4 outpatient department (OPD) clinics. Each of them sees 65 to 120 patients in a given day with the average wait time ranging from 45 minutes to 6 hours. This variability in service time and associated long delays is a source of angst for the patients, hospital staff who consistently work overtime, and it impacts the reputation of the clinic in the region (refer to fig. 4).
Service Time Variability (All Days)
SSD (a) -1h 37m
S12
4:48 _ _i
I
2:2 1714~ - I +'
Figure 4 - Patient Service Time Variability
Besides high deviation in patient service times and prolonged wait time,
LVPEI did not have an established process to handle spikes in demand through the walk-in clinic. The policy of never turning away patients and not having an established process led to fatigue and eventual high turnover of providers and staff.
3.2 Mapping patient journeys
To better understand the problem of patient wait times, we attempt to build a reference model of the problems experienced at LVPEI. We wanted to map the patient journey and understand the steps required for a patient to see the doctor - from stepping into the clinic to stepping out of it after service. During the months preceding the on-site visit and experimentation, we:
* Communicated with the leads from LVPEI's clinical and administrative operations staff
* Conducted interviews with key stakeholders to understand patient flow dynamics and
* Focused on qualitative metrics, due to constraints in accessing actual data points I
Through these we were able to build an initial picture of the processes and interactions taking place at one of the OPD clinics at LVPEI.
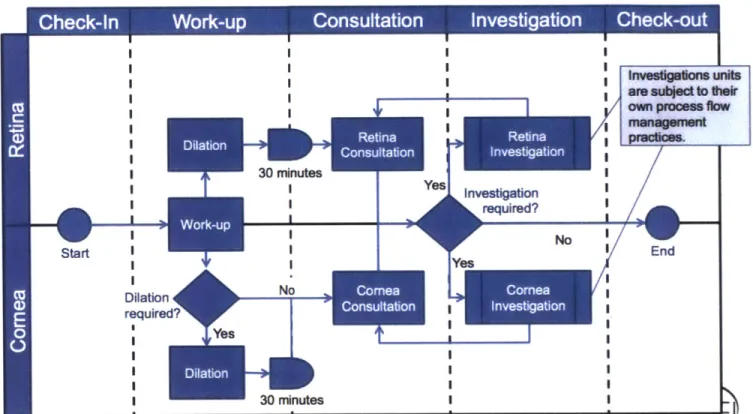
Investigations units are subject to their own process flow management practices. Yes Investigation required? Start No~ No End
Figure 5 - Patient Journey Through the Clinics at LVPEI
The table below describes the process mapped above:
Steps Description
Check-In Patients arriving at LVPEI check-in at the reception. Patients are either coming in with an appointment or are walk-ins. Patients are
initially triaged to be going to one of Cornea or Retina clinics. Work-up Work-up is the initial "triage" performed by the
nurses/optometrists to assess the patient. Patients with Cornea issues, are evaluated to see if they require dilation.
Dilation Patients must wait 30-minutes in the waiting area if they require (optional) dilation - all retina patients and some cornea patients undergo
dilation.
Consultation This is the assessment performed by the optometrists and ophthalmologists. This is when the patients consult with the
30 minutes Dilation No required? Yes 30 minutes Ye
doctor. If the ophthalmologist perceives the case to be more complicated, she may recommend further investigation and cross-consultation with other medical providers in the clinic.
Investigation This is cross-consultation with a secondary doctor on duty for (optional) cases that were considered complicated.
Table 1 - steps in the patient journey through the clinics at LVPEI
With an initial picture of the processes in place, we devised a technique to track patients through their journey at the clinic and understand the time spent at each step of the process. This mapping of a socio-technical system is essential to understanding how the people, processes and interactions take place.
3.2.1 Experiment Design
There are four OPD clinics at LVPEI each staffed by an ophthalmologist, a team of optometrists, and nurse staff. Two clinics served patients with diagnosis pertaining to cornea, while the other two served retina related diseases. There is a joint work-up station where optometrist and nurses make an initial assessment of the patient and transfer them to the specific clinic (refer to figure 6).
Prolonged patient wait time was a common problem across the four clinics however each clinic has subtle differences in its processes due to the preference of the leading ophthalmologist and her staff. To ensure that our results are not biased by these preferences, we conducted "time and motion" studies in each of the clinic independently. Using a random sample of patients arriving at clinics, we tracked the patient journey and mapped the time spent by the patient at each station - for example dilation, consultation,
examination etc. These time and motion studies were conducted for four days at each of the operating clinics at LVPEI
"sensible"
KaizenF-l ig
3!
crowd sourcing Figure 6 -IIgg.... .IuIliI
Bluetooth trackingPassive Sensing Through
GPS Tracking
Bluetooth
I
3.2.2 Data Collection
We used passive sensing methods using Bluetooth enabled devices to track patients during their journey through the hospital. We placed Bluetooth beacons at each "stop" in the patient journey - patient waiting room after initial signup, dilation room, waiting room after dilation, consultation room, investigation rooms, and final checkout room.
Patients were randomly selected and asked to fill out a quick survey and carry a smartphone device with them as they went about their consultation. The ophthalmologists and the clinic staff were not aware of which patients were carrying the phones and which were not.
To understand the behavior of the patients, we conducted a brief survey of patients and asked the following questions:
" What time did you arrive today?
" How long do you expect to spend at LVPEI today? " Did you try to make an appointment before coming?
o If yes, how did you try to make your appointment?
o If yes, why were you unable to do so?
" If no, why not?
We also interviewed stakeholders, including faculty ophthalmologists in each of the observed clinics and administrators who oversee appointment scheduling and resource allocation. Using both active and passive sensing methods, we collected data for four days from the four operating clinics at LVPEI.
3.3 Analysis
We utilized System Dynamics based modeling method to construct a robust model to simulate the conditions at the LVPEI OPD Clinics. We took into account qualitative data gathered from our interviews as well as quantitative data collected through our Bluetooth sensors. We also used traditional analytical methods to analyze the data collected and understand the performance and bottlenecks in this socio-technical system.
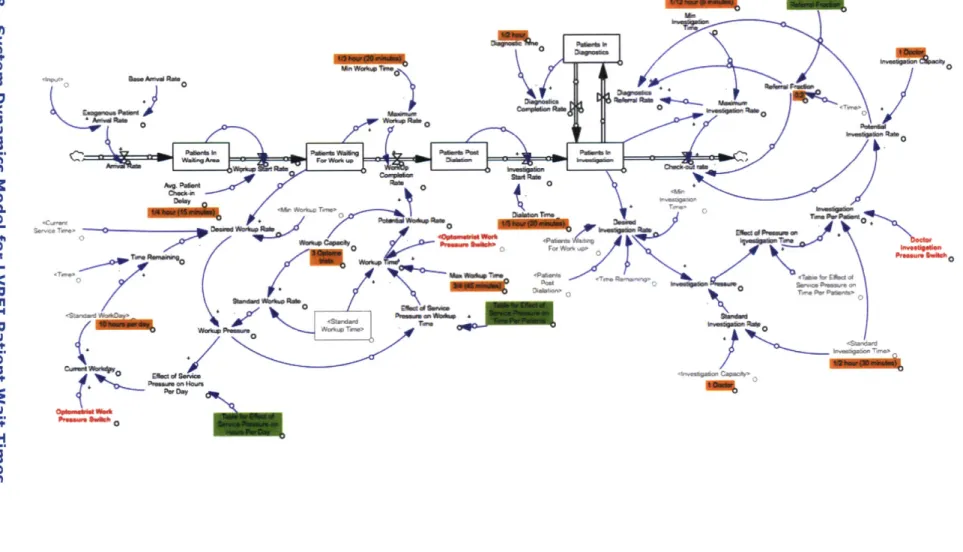
3.3.1 System Dynamics Model
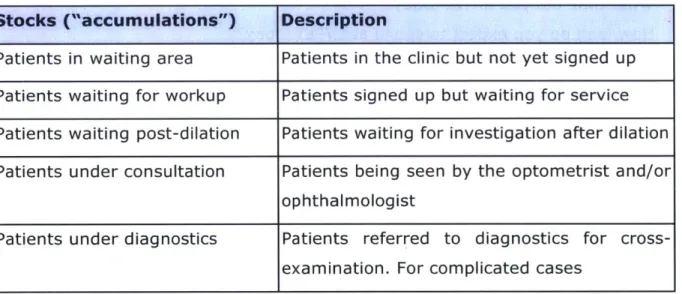
We used System Dynamics to model the operations of LVPEI. Based on personal observations, data from personnel interviews, and data from our time and motion studies, we constructed an initial model that reflected the "stocks" or accumulations and "flows" or rate of change for a "stock". We identified the following "stocks" and flows":
Stocks
Stocks ("accumulations") Description
Patients in waiting area Patients in the clinic but not yet signed up Patients waiting for workup Patients signed up but waiting for service Patients waiting post-dilation Patients waiting for investigation after dilation Patients under consultation Patients being seen by the optometrist and/or
ophthalmologist
Patients under diagnostics Patients referred to diagnostics for cross-examination. For complicated cases
Table 2 - stocks identified in the model Flows
Flows (rate of change of Description stocks)
Arrival rate Rate at which patients arrive at the clinic Workup start rate Rate at which patients move from waiting
area to workup area
Workup completion rate Rate at which patients complete workup
Consultation start rate Rate at which patients move from waiting post-dilation to the investigation area for
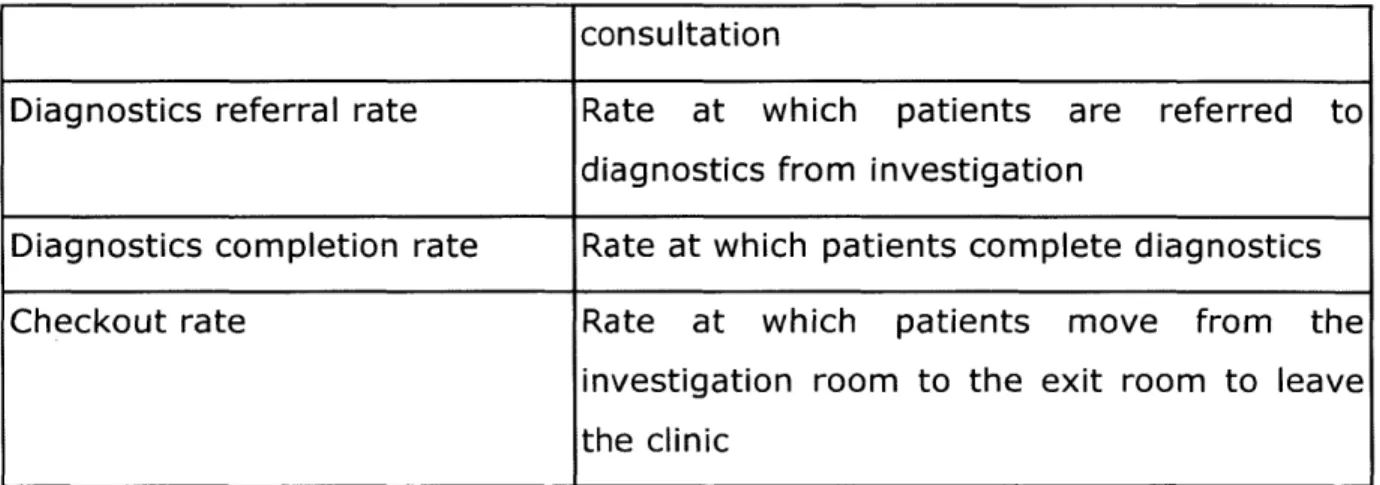
Table 3 - flows identified in the model
Refer to figure 8 for details of the model.
consultation
Diagnostics referral rate Rate at which patients are referred to diagnostics from investigation
Diagnostics completion rate Rate at which patients complete diagnostics Checkout rate Rate at which patients move from the
investigation room to the exit room to leave the clinic
0 0
II.0
It
c7~
ji
~)
/IPI
>\
30 E~2 0~ ~I4~
14> ~ R11
I
ni ~0 ~04
ii
p
~a'-i 0 0 b~ __ 0 3'p
~ 30/1
~ ~jA 0 A~ Z~jR Q Piii
\K4~
0ii
Figure 8 -System Dynamics Model for LVPEI Patient Wait Times 40 I3.3 Results
Based on our work on the ground and subsequent analysis through System Dynamics, we were able to determine the causes of variability and long service times as well as the impacts of such behavior on patients and hospital staff.
- Given a fixed OPD capacity, patient wait times are largely a function of service demand, scheduling, and resource specific factors
- Demand and scheduling factors include the complexity of patient cases, their volume, and the way they are scheduled in a given day. Factors impacting resource allocation and utilization include patient workup time, patient investigation time, and the operating hours of the OPD Clinic
- To accommodate larger daily volumes of patients, providers reduce the time they spend with each patient, thereby undermining the quality of care provided and increasing the likelihood for medical errors
- Walk-in patients are the source of variability in the system and cause the established schedule at LVPEI to deviate
We will discuss each item in detail below.
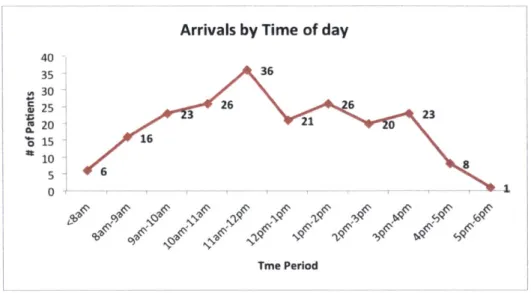
3.3.1 Patients arrive at all times during the day
There is high variability in patient arrival times at the clinics (figure 9). Patients arrive at all times during the day, over 90% arriving between the hours of 9am - 4pm. The clinic is supposed to close at 5pm local time. This variability causes patient buildup in the waiting area leading to prolonged wait times.
Arrivals by Time of day 26 3 16 6 Tme Period
Figure 9 - Patient Arrival by Time of Day (single clinic)
I
3.3.2 Patients and Doctors do not adhere to appointment
times
Over 67% of the patients do not show up on time of their designated appointment. As we can see in figure 10, about 32% of these show up earlier than their appointed time hoping to be seen earlier and discharged earlier. We recorded on-time arrival as the generous 30-minute symmetric window to the allocated time.
Patient Arrival Distribution based apt
14 >4 hours 3 hours early early 107 75 47 49 22 2 hours 1 hour On-time 1 hour 2 hours
early early 30min late late
window
4 8
3 hours 4> hours
late late
Figure 10 - Patient's Adherence to Appointments (all clinics)
40 35 S30 S' 25 om20 is 1 10 5 0 36 2 3 08 T;' 120 100 80 60 40 20 0
This behavior is reinforced by two factors:
1. LVPEI does not strictly enforce appointment-based timing on its patients. Doctors and patients resort to the first-come-first-served basis which negates the use of appointments for patients
2. Patients arriving early benefit. Patients that arrive early at the clinic with or without an appointment are able to see the doctor earlier. This behavior is encouraged due to lack of adherence to appointment times.
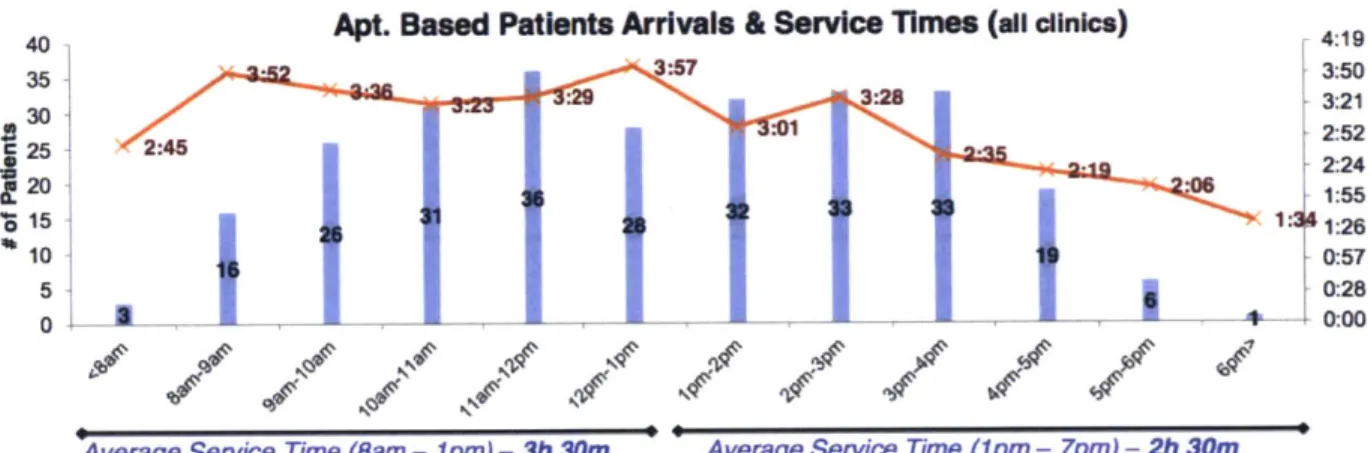
3.3.2 Service times fall by time of day
As the day progresses and we get into the afternoon, service times start to drop. In the data collected, we observed that service times (or time it takes to check-in and check-out) are almost an hour less than those observed from 8am-lpm. Refer to figure 11, below.
40 Apt. Based Patients Arrivals & Service Times (all clinics) 419
35 3:57 3:50 3:23 3:29 3:28 3:21 30 32:52 25 2:45 2:24 20 2:06 155 C. 36 15 015 26 31 32 33 3326 10 16 19 0:57 5 6 0:28 0 3- -1 0:00
Average Service Time (Bam - 1pm) - 3h 30m Average Service Time (1pm - 7pm) - 2h 30m
Figure 11 - Decreasing Service Time by Time of Day
This fall in service times can be partially due to fewer numbers of patients. But even if we take out patients arriving after 5pm, we still get an average service time that is 45 minutes less than the earlier part of the day. Using the System Dynamics model and loading the data we were able to observe and identify the source of these drops.
1. Doctors and staff spend less time per patient in the latter part of the day. This impact is a natural human tendency to move into
WI
catch-up mode when running behind. We observed that ophthalmologists spent less than 5 minutes per patient when the waiting area was full.
0.2 0.163
0.125
0.088
0.06
Investigation Time Per Patient
0 2 4 6 8 10 12
Time (Hour)
Figure 12 - Drop in Investigation Time Per Patient
2. Workup time also drops to its minimal value. Optometrists and nurses also reduce the time spent on work-up and use the minimal time required to assess and perform dilation on the patient (for retina). Workup Time 0.7 0.525 0.35 0.175 0 7I 0 2 4 6 8 10 Time (Hour)
Figure 13 - Workup Time for Patients
12
Impact of pressure on performance
Shortcuts are taken and quality of service is compromised for expediency. Figure 14, represents the observations.
Time per Patient
K
10am 1pmTime of Day
4pm
Figure 14 - Impact of Pressure on Performance
3.3.3 Overworked staff
Due to the high patient volume, staff at LVPEI work for long hours to accommodate the patients that are in the waiting area. Average workday was projected to be 11.8 hours per day.
Standard WorkDay 20 173 14 5 118 9 0 2 4 6 8 2 4 6 8 Time (Hour)
Figure 15 - Average Workday
10 12
Long hours and high pressure situation at the LVPEI is the basis behind the low retention rates at the clinic. We recorded complaints of fatigue and burnout from the interviews that confirmed our findings.
3.4 Discussion
Using active and passive sensing methods, we were able to collect valuable data on the patient flows at the four LVPEI clinics. Results from our initial analysis show that the issue of patient wait times is not just a problem for patients, but for the clinic staff as well. We make the following recommendations:
- We believe that given the fixed capacity of the OPD clinics and available service staff, LVPEI should allocate fixed blocks of time for walk-in patients. The unrestricted approach to accepting walk-in patients is the greatest source of variability in the system. Allocating a fixed block for walk-ins and enforcing it will enable LVPEI to efficiently marshal its resources.
- We also recommend that LVPEI enforce and adhere to an appointment based system and reward on-time arrival. By building a reputation for rewarding appointments and on-time arrival, LVPEI can bring about a gradual shift in attitudes of the staff and the patients.
- Increasing headcount of service staff can ease the current fatigue and high-pressure environment that we observed at the clinics.
Further work is required to explore the relationship between the volume of patients, the number of incorrect diagnosis and the number of patients that come back to the clinic to receive additional treatment as a result. We did not pursue this during our study but we recommend future researchers to investigate the impact of pressure and stress on service levels.
Chapter 4
Last Mile Logistics
In this chapter we dive into another disparate socio-technical system - last mile delivery operations in an urban megacity. Much like patient wait-times at LVPEI (chapter 3), last mile logistics suffers from unpredictable events that cause deliveries to be late or outright fail. To investigate the problem, we partnered with a logistics enterprise2 operating in Santiago, Chile to
collect mobility data on delivery driver during their delivery runs in the city. Using this data, we explore how delivery companies can continuously learn and adapt to run their operations efficiently.
Companies that manufacture products and goods need to deliver them to customers or retailers. They either operate their own fleet of trucks or outsource them to delivery companies. The goal is to get the goods delivered on time with the lowest cost possible. Last-mile delivery (delivery to the final destination) suffers from many unpredictable and unforeseen events that cause delays in delivery to customers and subsequent loss of revenue. Drivers make instinctive decisions based on embedded knowledge to attempt on-time delivery. However, these routing decisions are made in a silo and cause the most optimized routes to fall apart. Last mile delivery is a complex socio-technical system where drivers and dispatchers interact with a stochastic model of the transportation network, delivery circumstances, and other outlying factors.
4.1 Problem with last mile logistics
Delivery to the final destination (customer or retailer) is referred to as the last-mile and often occurs in populated areas (urban cities) where customers or retailers reside. These deliveries are scheduled days or hours in advance taking into account various constraints for the tasks and drivers. However, drivers rarely adhere to these schedules and make decisions based on
circumstances they experience on the road.
4.1.1 Scheduling
Our partner logistics enterprise operates 34 trucks in and around the city of Santiago in Chile. Drivers' pickup deliveries from a central warehouse south of Santiago and conduct on average 20 deliveries per day. Each delivery task has a set of constraints as listed in Table 4 below.
Constraint Description
Time Window Period of time when the customer wants the delivery to occur. Usually provided with an open time and a close time. Some customers may have multiple time windows.
Service Time or The time it takes to conduct a delivery. This usually Duration incorporates unloading of goods, delivery to customer, and
signoff from the customer.
Priority Not every customer is alike, and customers are ranked in the level of priority based on various factors - volume requested, reputation, purchasing power etc.
Open & Close Time This refers to the opening hours of the customer location. This is considered a hard time window for a delivery i.e. drivers can deliver during this time if the time window
compliance will be impossible.
Table 4. Constraints for delivery tasks
Delivery drivers also operate within a set of constraints that are considered when scheduling tasks. Table 5 below lists constraints associated with the driver,
Constraint Description
Driver Shift This the period of time when the driver is available to
conduct a set of tasks
Vehicle capacity The capacity limit of the driver's vehicle in terms of
(weight and volume) weight and volume.
Time on road Most highway authorities and labor unions enforce a rule
of maximum time on road for a driver in a given day. The standard is not more than 12 hours in a single day.
Table 5. Constraints for delivery tasks
These constraints are taken into account and an schedule is constructed for each driver using algorithms that solve vehicle routing problem with time
windows using heuristic and meta-heuristic methods. Driver is provided with a sequence of deliveries that he must follow to ensure time windows are met, mileage, and time on road is minimized. A sample schedule is shown in the table below with fictional stops.