Bus User Behavior in Multi-Route Corridors
byCecilia A. Viggiano
B.A. in Environmental Analysis, Pomona College, 2008
Submitted to the Department of Civil and Environmental Engineering in partial fulfillment of the requirements for the degree of
Master of Science in Transportation at the
Massachusetts Institute of Technology June 2013
c
Massachusetts Institute of Technology 2013. All rights reserved.
Author . . . . Department of Civil and Environmental Engineering
May 23, 2013
Certified by . . . . Harilaos Koutsopoulos Professor of Transport Science, Royal Institute of Technology Thesis Supervisor Certified by . . . . John P. Attanucci Research Associate of Civil and Environmental Engineering Thesis Supervisor
Accepted by . . . . Heidi M. Nepf Chair, Departmental Committee for Graduate Students
Bus User Behavior in Multi-Route Corridors by
Cecilia A. Viggiano
Submitted to the Department of Civil and Environmental Engineering on May 23, 2013, in partial fulfillment of the
requirements for the degree of Master of Science in Transportation
Abstract
Multi-route corridors are a common feature of bus networks. In these corridors, passen-gers select between a set of parallel routes. Understanding how passenpassen-gers make these decisions can help better measure passenger experience and inform network and service planning. This thesis develops three methods for characterizing passenger behavior based on automatically collected data. The first is an empirical analysis relating bus arrivals to bus ridership on each route. The second is a probabilistic model that infers passengers’ route choice strategies based on the headways that preceded their bus boarding. The third method is a panel analysis of individuals’ stop and route choices over time. These meth-ods are applied to two corridors in London, one that has only local service and another that has both local and limited stop service. On the local-only corridor, the analysis infers that the majority of passengers board the first bus that serves their destination. On the corridor with limited stop service, many passengers opt to wait specifically for the limited stop service route. This boarding strategy is increasingly prevalent as the length of the bus trip increases. Passenger behavior was also found to be affected by crowding, passenger experience on the corridor, and access to real-time information.
In addition to the analysis of automated data, this research includes a web-based survey of users of the limited stop corridor. This survey demonstrates the viability of web-based surveys for collecting detailed information about passenger behavior on a large scale. The survey data shows that passengers’ route choice strategies are influenced by factors includ-ing trip length, trip purpose, respondent income, use of countdown information, attitudes towards crowding, waiting, and walking, and levels of risk aversion.
The thesis relates the analysis of passenger behavior to a set of recommendations for multi-route corridor planning. The advantages and disadvantages of corridor-level scheduling and operation are discussed, and service configuration changes for the limited stop corridor are proposed. Given the prevalence of multi-route corridors and the variety of passengers’ route choice behavior within them, the incorporation of an understanding of passenger behavior into network and service planning has the potential to improve passenger experiences on bus networks.
Thesis Supervisor: Harilaos Koutsopoulos
Title: Professor of Transport Science, Royal Institute of Technology Thesis Supervisor: John P. Attanucci
Acknowledgments
I would like to thank my advisors, Haris and John, for all the guidance, feedback, and encouragement. I would also like to thank Nigel, Fred, and Mikel for providing additional advice, whenever I needed it. I am appreciative, as well, of all of the CEE staff for helping everything go smoothly.
I am thankful for the support of TfL, and in particular for the assistance and expertise of Rosa McShane, Alex Phillips, and John Barry. I would also like to thank Duncan Horne as well as Clara Barrington and her Customer Research team for their help with the distribution of the online survey.
A huge thank you is due to Laura for making me laugh, answering my questions, cooking me many delicious dinners, and generally putting up with me, all day, every day. I also owe a big thank you to Gabriel, who taught me so much when I was new to transportation, who is always willing to answer my questions, and whose programming expertise helped make this thesis possible. For great company at work each day, thank you to Yonni, Meisy, Dom, Jamie, and everyone else in the Transit Lab.
Finally, a sincere thank you to my parents and sisters for their love and for their confidence in me. And especially, to Nonna, for coming all the way across the country to watch me graduate.
Contents
List of Figures 9 List of Tables 11 1 Introduction 15 1.1 Motivation . . . 15 1.2 Objectives . . . 17 1.3 Overview of Methodology . . . 181.4 Outline of the Thesis . . . 19
2 Literature Review 21 2.1 Service Planning for Multi-Route Corridors . . . 21
2.2 Understanding User Strategies . . . 23
2.3 Incorporating Strategy Analysis in Service Planning . . . 23
3 Background Information on the Case Studies 27 3.1 Beulah Corridor . . . 27
3.2 Uxbridge Corridor . . . 31
3.3 Data Sources . . . 40
4 Analysis of Automatically Collected Data 43 4.1 Empirical Analysis Methodology . . . 43
4.2 Empirical Analysis Results . . . 44
4.2.1 Beulah Corridor . . . 44
4.2.2 Uxbridge Corridor . . . 45
4.3 Empirical Analysis Conclusions . . . 48
4.4 Probabilistic Model Methodology . . . 49
4.5 Probabilistic Model Results . . . 51
4.5.1 Beulah Corridor . . . 51
4.5.2 Uxbridge Corridor . . . 56
4.6 Probabilistic Model Conclusions . . . 67
4.7 Panel Analysis Methodology . . . 68
4.8 Panel Analysis Results . . . 69
4.8.1 Beulah Corridor . . . 69
4.8.2 Uxbridge Corridor . . . 71
4.9 Panel Analysis Conclusions . . . 73 5 Design, Representativeness, and Validity of the Web-Based Survey 75
5.1 Web-Based Surveys . . . 75
5.2 Survey Design . . . 76
5.3 Survey Administration and Response Rates . . . 78
5.4 Representativeness of Survey Responses . . . 80
5.4.1 Selection Biases . . . 80
5.4.2 Reporting Biases . . . 85
5.5 Survey Validity . . . 87
5.6 Recommendations . . . 88
5.7 Conclusions . . . 88
6 Web-Based Survey Findings 91 6.1 Trip Length . . . 91
6.2 Crowding . . . 92
6.3 Countdown Information . . . 93
6.4 Frequency of Corridor Use . . . 94
6.5 Passenger Attitudes . . . 96
6.6 Age and Disabilities . . . 103
6.7 Income . . . 104
6.8 Gender . . . 104
6.9 Trip Purpose . . . 105
6.10 Time of Day . . . 106
6.11 Consistency of Probabilistic Model and Survey Results . . . 107
6.12 Conclusions . . . 107
7 Implications for Service and Network Planning 109 7.1 Implications for Local-Only Corridors . . . 109
7.1.1 Corridor-Level Headway Coordination . . . 110
7.1.2 Co-locating stops in the shared segment . . . 114
7.2 Implications for Corridors with Limited Stop Service . . . 114
7.2.1 Implications of Load and OD Analysis . . . 115
7.2.2 Corridor-Level Headway Coordination . . . 116
7.2.3 Rationality, Risk, and Information . . . 117
7.2.4 Factors that Influence Strategy Choice . . . 119
7.3 Conclusions . . . 120
8 Conclusion 121 8.1 Identifying Route Choice Strategies from AVL and AFC Data . . . 121
8.2 Improving Understanding of Passenger Behavior from a Web-Based Survey 122 8.3 Implications of the Strategy Analysis . . . 123
8.4 Future Research . . . 124
A Appendix 127
List of Figures
2-1 Load Profiles (from Larrain et al. (2010)) . . . 22
3-1 Map of the Beulah Corridor . . . 28
3-2 Frequency of Beulah Corridor Use . . . 29
3-3 Beulah Corridor Trips by User Type . . . 29
3-4 Beulah Inbound Boardings by Time of Day . . . 30
3-5 Beulah Outbound Boardings by Time of Day . . . 30
3-6 Beulah Inbound AM Peak Loads . . . 32
3-7 Beulah Outbound AM Peak Loads . . . 33
3-8 Map of Offset Norwood Road/ Robson Road Stops . . . 34
3-9 Map of the Uxbridge Corridor . . . 35
3-10 Inbound Trip Lengths By Service Type . . . 36
3-11 Outbound Trip Lengths By Service Type . . . 36
3-12 Frequency of Uxbridge Corridor Use (Fall 2012) . . . 37
3-13 Uxbridge Corridor Trips by User Type . . . 38
3-14 Uxbridge Inbound Boardings by Time of Day . . . 39
3-15 Uxbridge Outbound Boardings by Time of Day . . . 39
3-16 Uxbridge Inbound AM Peak Loads . . . 40
3-17 Frequency of Uxbridge Corridor Use (February 2013) . . . 42
4-1 Schematic of Bus Arrivals at a Stop . . . 44
4-2 Diagram of Headways Used in the Probabilistic Model . . . 49
4-3 Decision Tree for an Individual Choosing Between Three Routes . . . 50
4-4 Beulah Corridor AM Peak Inbound Loads . . . 53
4-5 Beulah Corridor AM Peak Outbound Loads . . . 54
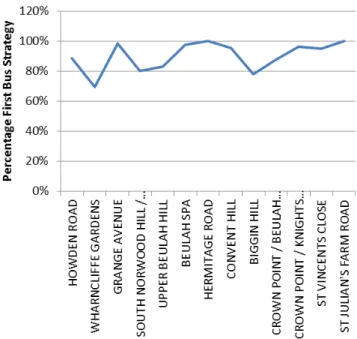
4-6 Beulah Corridor Proportion First Bus Strategy by Boarding Stop . . . 55
4-7 Uxbridge Corridor Inbound AM Peak Median Loads . . . 61
4-8 Beulah Corridor Panel Analysis . . . 70
4-9 Distribution of Selection between Offset Boarding Stops . . . 71
4-10 Distribution of Selection between Offset Destination Stops . . . 72
4-11 Uxbridge Corridor Panel Analysis . . . 73
5-1 Survey Strategy Identification Questions . . . 77
5-2 Survey Email . . . 78
6-1 Attitudes Towards Crowding . . . 97
6-2 Attitudes Towards Risk and Information . . . 98
6-4 Attitudes Towards Walking/In-vehicle Time Trade-off . . . 99
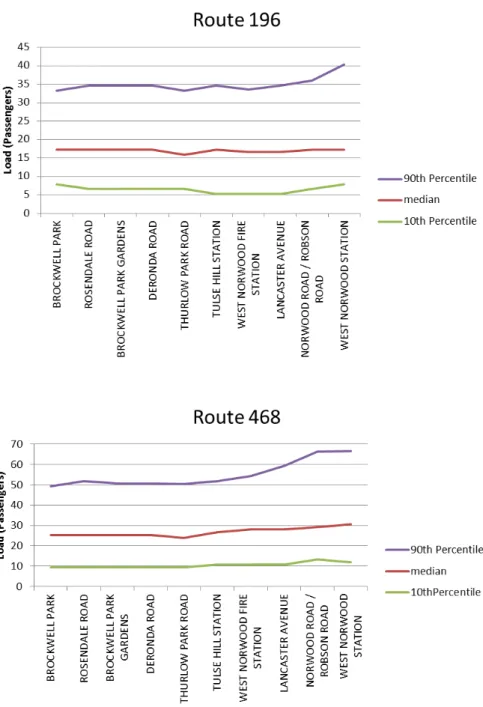
7-1 Route 196 AM Peak Loads . . . 112
7-2 Route 468 AM Peak Loads . . . 113
7-3 Uxbridge Corridor Loads . . . 115
A-1 Introduction to the Survey . . . 127
A-2 Attitude Ranking Statements . . . 128
A-3 Lead In Question . . . 129
A-4 Route Identification Question for Home-based Trip . . . 129
A-5 Direction Question . . . 130
A-6 Stop Selection Questions for Single Route Option . . . 130
A-7 Stop Selection Questions for Transfer Option . . . 131
A-8 Detailed Questions About Origin of Home-Based Trip . . . 132
A-9 Detailed Questions About Destination of Home-Based Trip . . . 133
A-10 Questions About Use of Countdown Information . . . 134
A-11 Strategy Identification Questions . . . 135
A-12 Route Identification for Trip from Somewhere Other Than Home . . . 135
A-13 Detailed Questions About Origin of Trip from Somewhere Other Than Home 136 A-14 Detailed Questions About Destination of Trip from Somewhere Other Than Home . . . 137
List of Tables
3.1 Beulah Corridor Ridership and Headways . . . 27
3.2 Summary of Beulah Corridor Data for Analysis . . . 31
3.3 Uxbridge Corridor Ridership, Headways, and Stop Spacing . . . 35
3.4 Uxbridge Corridor Trip Lengths by Route (Fall 2012) . . . 37
3.5 Summary of Uxbridge Corridor Data for Analysis . . . 40
3.6 Uxbridge Corridor Ridership (February 2013) . . . 41
3.7 Uxbridge Corridor Trip Lengths by Route (February 2013) . . . 42
4.1 Empirical Analysis Results for the Beulah Corridor . . . 45
4.2 Empirical Analysis Results for Uxbridge Inbound Samples in the Three-Route Market . . . 45
4.3 Characteristics of the Four Inbound Samples . . . 46
4.4 Empirical Analysis Results for Uxbridge Inbound Samples in the Two-Route Market . . . 46
4.5 Empirical Analysis Results for Uxbridge Corridor Outbound Samples in the Three-Route Market . . . 47
4.6 Characteristics of the Four Outbound Samples . . . 47
4.7 Empirical Analysis Results for Uxbridge Corridor Outbound Samples in the Two-Route Market . . . 48
4.8 Probabilistic Model Applied to the Beulah Corridor Empirical Analysis Samples 51 4.9 Test of the Probabilistic Model for Demand Assignment in the Beulah Corridor 51 4.10 Results of the Probabilistic Model for all Trips in the Beulah Corridor . . . 52
4.11 Results of the Probabilistic Model for all AM Peak Trips in the Beulah Corridor 52 4.12 Beulah Corridor Strategies by Frequency of Corridor Use . . . 56
4.13 Probabilistic Model Results for Uxbridge Inbound Samples . . . 57
4.14 Probabilistic Model Results for Uxbridge Outbound Samples . . . 57
4.15 Test of the Probabilistic Model for Demand Assignment in the Uxbridge Corridor (Inbound) . . . 58
4.16 Test of the Probabilistic Model for Demand Assignment in the Uxbridge Corridor (Outbound) . . . 58
4.17 Uxbridge Corridor Market 1 Strategies by Trip Length . . . 59
4.18 Uxbridge Corridor Market 2 Strategies by Trip Length . . . 59
4.19 Uxbridge Corridor Market 3 Strategies by Trip Length . . . 60
4.20 Market 2 Strategies at Crowded and Uncrowded Stops (Short Trips) . . . . 62
4.21 Market 2 Strategies at Crowded and Uncrowded Stops (Long Trips) . . . . 62
4.22 Market 3 Strategies at Crowded and Uncrowded Stops . . . 63
4.24 Market 2 Strategies for Frequent and Infrequent Users (Crowded Stops, Short
Trips) . . . 64
4.25 Market 2 Strategies for Frequent and Infrequent Users (Uncrowded Stops, Short Trips) . . . 64
4.26 Market 2 Strategies for Frequent and Infrequent Users (Crowded Stops, Long Trips) . . . 65
4.27 Market 3 Strategies for Frequent and Infrequent Users (Crowded Stops) . . 65
4.28 Market 3 Strategies for Frequent and Infrequent Users (Uncrowded Stops) . 65 4.29 Average Route 607 Trip Lengths in Frequency Analysis . . . 66
4.30 Strategies at Stops With and Without Countdown Signs . . . 67
4.31 Beulah Corridor Panel Analysis of Passengers with All Trips on One Route 69 4.32 Uxbridge Corridor Panel Analysis of Passengers with All Trips on One Route 72 5.1 Completeness of Survey Responses . . . 80
5.2 Percent of Users who Provided Emails by Route . . . 81
5.3 Proportions of Trips Made on Each Route . . . 81
5.4 Percentages of Elderly and Disabled Users . . . 82
5.5 Provision of Email Addresses by User Type . . . 82
5.6 Frequent and Infrequent users on Each Route . . . 83
5.7 Trip Lengths of Users Invited to Take the Survey . . . 83
5.8 Proportions of Trips Made on Each Route by Survey Respondents . . . 84
5.9 Survey Response Rates by User Type . . . 84
5.10 Average Trip Lengths for Survey Respondents . . . 85
5.11 Proportions of Trips Reported on Each Route . . . 85
5.12 Average Reported Trip Lengths . . . 87
6.1 Strategies by Trip Length in Market 1 . . . 92
6.2 Strategies by Trip Length in Market 2 . . . 92
6.3 Strategies at Crowded and Uncrowded Stops, Using Departing Load . . . . 93
6.4 Strategies at Crowded and Uncrowded Stops, Using Arriving Load . . . 93
6.5 Strategies and Use of Countdown Information in Market 2 . . . 94
6.6 Strategies and Use of Countdown Information in Market 1 . . . 94
6.7 Strategies with and without Countdwon Information by Trip Length . . . . 95
6.8 Strategies of Frequent and Infrequent Users . . . 95
6.9 Strategies of Frequent and Infrequent Users, Controlling for Trip Length . . 95
6.10 Strategies by Sensitivity to Crowding . . . 100
6.11 Strategies by Sensitivity to Crowding at Crowded Stops . . . 100
6.12 Risk Aversion and Strategies Without Countdown Information . . . 101
6.13 Risk Aversion and Strategies With Countdown Information . . . 101
6.14 Strategies and Trust of Countdown Information . . . 102
6.15 Strategies and Waiting/In-vehicle Time Trade-Off . . . 102
6.16 Strategies by Age . . . 103
6.17 Strategies by Income . . . 104
6.18 Strategies by Income, Trip Length Controlled . . . 104
6.19 Strategies by Gender . . . 105
6.20 Strategies by Trip Purpose . . . 105
6.21 Strategies by Trip Purpose, Controlling for Trip Length . . . 106
6.23 Comparison of Main Findings of the Probilistic Model and the Survey . . . 107
7.1 Beulah Headway Variation . . . 111
7.2 Beulah Corridor Waiting Time Improvements . . . 111
7.3 Proposed Shortening of Route 427 . . . 116
7.4 Uxbridge Headway Variation . . . 117
7.5 Potential Uxbridge Corridor Waiting Time Under Coordination . . . 117
Chapter 1
Introduction
In dense bus networks, multi-route corridors are common. In the context of this thesis, a multi-route corridor is defined as any instance in which two or more bus routes follow the same geographic trajectory for a significant distance. This thesis seeks to understand the behavior of those passengers who board and alight from buses within the multi-route corridor. This behavior is characterized by the strategy passengers use to select a bus route from the routes that serve their destination.
First, the thesis develops three methodologies for identifying passengers’ strategies. The strategy identification methods are applied to two multi-route corridors in London: one has only local routes and the other has both local routes and a limited stop service route. Each of these methods make inferences about passenger strategies using Automated Vehicle Location (AVL) and Automated Fare Collection (AFC) data.
Strategy information can also be gleaned more directly by asking passengers about their strategies in a survey. To this end, a web-based survey was developed. Some analysis was devoted to the representativeness and validity of the survey results to determine the viability of web-based surveys to collect data on route choice strategies, as well as to collect other ridership information.
For network and service planning, it is useful to understand not only which strategies passengers are using, but also why they select the strategy they do. Data from the web-based survey, as well as the inferences from the analysis of automatically collected data identify some explanatory factors that are correlated with passengers’ route choice strategy. Knowledge of passengers’ route choice strategies and of the reasons behind these choices can help planners make better decisions about network design, service frequency, and the oper-ation of buses in a corridor. This thesis considers the implicoper-ations of the informoper-ation gained from studying the two London corridors both for improvements to the specific corridors and as a more general source of information for corridor design and planning.
1.1
Motivation
London is an appropriate setting for this research because its bus network is both dense and well-used. London has a ratio of over 900 buses per one million residents (Land Transport
Authority, 2010) and these buses have a high utilization rate of an average of .3 million passengers per bus per year (LTA Academy, 2011). London residents make an average of .6 bus trips per day (Golub, 2004). With such high demand for bus service, London operates a bus network with many overlapping routes. As a result, about 40% of London’s bus trips can be made on more than one bus route (Sanchez Martinez, 2013). Understanding passenger behavior in the face of a bus route choice decision can therefore shed light on the experience of millions of London bus passengers.
The dense and heavily-used nature of the London bus network is not unique world-wide. Singapore’s bus network shares very similar statistics, with a bus fleet ratio of about 800 buses per one million residents (Land Transport Authority, 2010) and a utilization rate of .29 million passengers per bus per year (LTA Academy, 2011). Seoul counted an average of 5 million bus passengers per day in 2004 (Pucher et al., 2005) or .58 trips per resident per day (Golub, 2004). In Hong Kong, residents make an average of .71 bus trips per day and even higher bus ridership is observed in Brazil, with residents of Rio de Janeiro and Curitibia making an average of 1.00 and 1.02 bus trips per day, respectively. While bus ridership in the United States tends to be lower, New York City is not far behind London with an average of .53 daily bus trips per resident (Golub, 2004). In other parts of the world, a large volume of informal bus service speaks to the potential for planned multi-route bus corridors. Cairo, for example, has an average of 3.5 million passengers per day on the buses operated by the Cairo Transit Authority, and estimates an additional 6.5 million passengers per day on unregulated minibuses (Rodriguez, 2012).
In cities worldwide, concentrated demand for bus service has led to a focus on bus corridors. Guangzhou, China has developed a 22.4 kilometer bus rapid transit (BRT) corridor that is served by 31 different bus routes (Hughes and Zhu, 2011). The most-used bus corridor in Sao Paolo, Brazil serves 200,000 passengers every day. Bogota, Colombia is famous for its Transmilenio BRT system, which inspired similar systems in Jakarta and Mexico City (Golub, 2004). The prevalence of bus corridors worldwide underscores the importance of developing an understanding of these corridors in terms passenger behavior and its impli-cations for service and network planning.
Passengers who board and alight in a multi-route corridor have a choice of more than one bus route to make their trip. The strategies they use to select between these routes can impact important components of the bus passenger experience, including waiting time and vehicle loads. When the routes a passenger can select are of the same service type, researchers often assume that individuals take the first bus that serves their destination. This strategy assumes that the individuals have full knowledge; that is, they are aware of all the buses that serve their destination. It also assumes that buses are not reaching capacity constraints, in which boardings are denied because the bus is too full. One can also think of other scenarios where individuals may not take the first bus. They may choose to wait for a less-crowded bus even though they could have boarded a crowded bus sooner. There is also room for adaptive strategies. They may start off waiting for a less-crowded bus, expecting buses of another route to be less crowded. After a couple crowded buses pass, they may opt to board the third, equally crowded bus because they no longer expect future buses to be less crowded or are simply tired of waiting.
When passengers have options with varied service types, such as the choice between local service and limited stop service, there is additional potential for strategy variation. People who live closest to a bus stop served only by local buses may select to walk to a farther
stop that is served by limited stop buses as well. However, this decision may depend on real-time information they access about arrivals at each stop. Once at a combined (local and limited stop) bus stop, individuals may choose to wait for a limited stop bus or may not. This decision may depend on the expected arrival times for each route. People who do not have access to information may vary their behavior based on previous experiences or may plan to wait for a limited stop bus and then give up on it after a certain number of minutes. Passengers’ route choice strategies may also depend on characteristics of the routes, such as levels of crowding, characteristics of the trip, such as its length and purpose, and characteristics of the individual, such as his or her level of risk aversion and sensitivity to waiting time.
Route choice strategies are latent, or unobservable, making it necessary to develop methods to infer strategies based on observable data, such as vehicle location and passenger boarding data, or to find ways to reliably identify strategies through a survey. This thesis attempts to do both, as the analysis and evaluation of passengers’ route choice strategies is critical to any study of multi-route corridors. Depending on a passenger’s strategy, his or her waiting time and in-vehicle time may be a function of the headways and running times of just one route or of multiple routes. For passengers who take the first bus that serves their destination, average waiting time and in-vehicle time will be a function of the headways and running times of all possible routes. For those who prefer a specific route, these metrics should be judged based on the values for that route only. An understanding of route choice strategies can be incorporated into demand assignment to different routes in a corridor. Strategies will interact with the levels of service on the routes and this in turn will affect the load on vehicles of each route.
This implies that knowledge of passenger route choice strategies is important at each stage of bus network and service planning and operation. First, when evaluating existing service on a corridor, planners should understand that metrics such as expected waiting and in-vehicle time will vary depending on the passengers’ route choice strategy. Similarly, these strategies should be considered when evaluating potential service and network changes, such as altering the allocation of vehicles to routes on the corridor or changing stop locations. Passengers may alter their strategies in reaction to these service and network changes, which is why understanding the factors that influence route choice strategy is also important. Planners can use knowledge of the explanatory factors that affect route choice strategy to predict passengers’ responses to changes and then evaluate the options given the predicted distribution of route choice strategy. An understanding of route choice strategies on existing corridors can also inform planners when designing new corridors or considering the addition of a new service, such as a limited stop bus route, to a corridor. Route choice strategy is important for schedule planning and route operation, as well, as passengers who are willing to board multiple routes could potentially benefit from bus scheduling and operation that is coordinated at a corridor level, rather than at an individual route level.
1.2
Objectives
This research will analyze bus users’ route choice in two types of multi-route corridors. In the first all bus routes run the same service pattern, stopping at all stops along the common segment. The second type of corridor has both limited stop and local service.
The first goal of the research is to develop a methodology to characterize the strategies used by bus passengers traveling in the corridor. This is done by making inferences from AVL and AFC data, as well as using a web-based survey. This thesis also evaluates the viability of using an internet survey to collect information about route choice strategy and other bus trip and passenger information. The second goal of the research is to assess the factors that influence passengers’ strategy choice. This analysis uses both the inferences made from the AVL and AFC data and the data collected in the survey. Finally, this research considers the implications of these findings for network and service planning and corridor operation.
1.3
Overview of Methodology
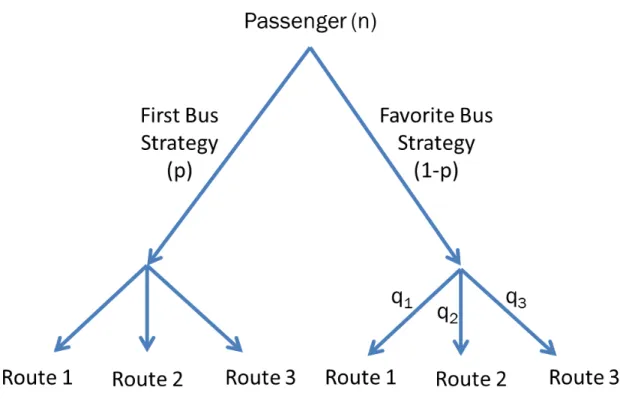
In this thesis, passenger behavior in a multi-route corridor is characterized by the passengers’ route choice strategies. While a variety of adaptive and flexible strategies may exist, this thesis simplifies the characterization by defining passengers as having either a first bus strategy or a favorite bus strategy. Passengers with a first bus strategy take the first bus that serves their destination. Passengers with a favorite bus strategy wait for a bus of a specific route and take that route only. In corridors with limited stop service, passenger strategy also includes the decision of which stop to board at, as the limited stop service route does not serve all stops. While this is an important part of passenger strategy on corridors with limited stop service, the majority of the analysis in this thesis focuses on the route choice strategy decision made after the stop has been selected.
First, three methods are developed to characterize passenger behavior using AVL and AFC data. The first is an empirical analysis that compares the expected proportion of passengers on each route, under the assumption that passengers board the first bus that serves their destination, to the actual proportions of users on each route. The second method is a probabilistic model that infers passengers’ route choice strategies from the headways that precede each boarding. The final method is a panel analysis that considers the variation in behavior of individuals who have multiple trips on the corridor over time.
Each of these methods are applied to two corridors in London. The first is called the Beulah Corridor and consists of two local bus routes that run parallel in the Beulah Hill area, south of Central London. The second is referred to as the Uxbridge Corridor and includes a limited stop bus route that parallels two local service routes from White City Bus Station to Uxbridge, west of Central London.
In addition to the inferences made from the AVL and AFC data, information on route choice strategy was collected from a web-based survey of users of the Uxbridge Corridor. Using both the inferences and the survey data, correlations are drawn between route choice strategies and explanatory factors, including trip length, crowding, experience, information, passenger attitudes, age, disabilities, gender, income, trip purpose, and time of day. Finally, the strategy analysis is combined with ridership data to make recommendations about service and network planning and to quantify the potential affects of operational changes such as the introduction of headway coordination at a corridor level.
1.4
Outline of the Thesis
The remainder of the thesis is organized as follows:
Chapter Two provides additional background for this thesis by reviewing the existing lit-erature on strategy identification and understanding route choice strategy. It also includes a brief synopsis of other work that has been done on bus corridor design and planning, focusing particularly on research that has attempted to incorporate route choice strategy in service and network planning decisions.
Chapter Three introduces the two corridors that were studied. Background information and statistics for each corridor are discussed.
Chapter Four focuses on three methods to infer route choice strategy using AVL and AFC data. Detailed methodologies as well as the results for the Beulah and Uxbridge corridors are presented. In addition, the data is segmented to evaluate the affects of trip length, crowding, experience, and information on route choice strategies in these corridors.
The web-based survey is presented in Chapter Five. This chapter explains the contents and design of the survey and also presents an evaluation of the representativeness and validity of the survey data.
Chapter Six uses the data collected in the web-based survey to assess the contributions of trip length, crowding, experience, information, passenger attitudes, age, disabilities, gender, income, trip purpose, and time of day to passengers’ route choice strategies.
In Chapter Seven, the implications of the results for network and service planning and operations are discussed.
Chapter 2
Literature Review
This chapter begins with some of the major recommendations and findings for service and network planning in high-demand corridors, which are often served by multiple bus routes. Next, a summary is provided of the research that has contributed to an understanding of user strategies in a transportation context. Finally, these two topics are brought together in a discussion of studies that propose methods for incorporating user strategies into demand assignment models used to make service and network planning decisions. This thesis de-velops new methods for understanding route choice strategies in multi-route bus corridors and uses this understanding to make recommendations for network and service planning and operation in multi-route corridors.
2.1
Service Planning for Multi-Route Corridors
When demand on a corridor is sufficient to justify multiple bus routes, the passenger expe-rience can be improved by diversifying service to suit the varied trips made on the corridor. Furth and Day (1985) summarize four service configuration options for heavy demand corri-dors: short-turning, restricted zonal, semi-restricted zonal and limited-stop zonal. Limited stop service, the option used in the Uxbridge Corridor, is defined as having a typical stop spacing of .5 to 1 miles. Furth and Day (1985) discuss the operational needs of each option such as the reliance on overtaking and the need for schedule coordination. For limited stop service, they indicate a strong need for overtaking and potential value in schedule coordi-nation, particularly during peak travel periods. They also note that limited stop service is ideal for long corridors with fast ambient travel speeds.
Larrain et al. (2010) build on this research, focusing on defining the characteristics that make a corridor ideal for express service1. They consider four parameters: the shape of the load profile along the corridor, the scale of demand, the demand imbalance between outbound and inbound travel, and the average trip length. They evaluate the potential benefits to passengers of express service under different values for the four parameters using simulation. They find that the most important parameter is average trip length, with more potential benefits of express service as the length of the average passenger trip increases.
1In many United States transit agencies, limited stop service is called “express”. For the purpose of this
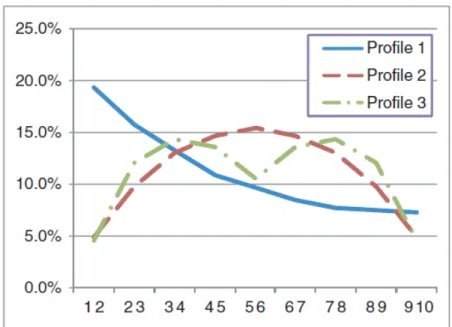
Figure 2-1: Load Profiles (from Larrain et al. (2010))
The shape of the load profile also influences potential benefits. The benefits are greatest for base load profiles that decrease monotonically, though peaked profiles also showed some benefit. Where load profiles have multiple peaks, more complex service patterns may be appropriate. Figure 2-1 shows a monotonically decreasing load profile (Profile 1), a peaked load profile (Profile 2) and a load profile with multiple peaks (Profile 3). The researchers also found a correlation between higher demand levels and potential benefits, though the relationship is weaker than expected. Finally, they do not find any meaningful relationship between the demand imbalance between inbound and outbound travel and the potential benefits of limited stop service.
This thesis analyzes other characteristics of the route, trip, and corridor, that are correlated with a strategy of waiting specifically for a limited stop service route. This helps identify additional factors that make a corridor a strong candidate for limited stop service. While not the main focus of this thesis, some consideration is given to stop choices and some recommendations with regard to stop locations is also given.
Chiraphadhanakul and Barnhart (2012) look in detail at stop configurations. Their service optimization model re-allocates buses from a local route to a parallel limited-stop route. The network based model determines which stops the limited stop route should serve as well as the number of vehicles that should be shifted from local to limited stop service. The model maximizes total welfare which is defined as the travel time savings minus the additional waiting time.
In terms of scheduling and operation, Ceder et al. (2001) discuss an algorithm developed to maximize the number of simultaneous bus arrivals at transfer nodes in the bus network. Verma and Dhingra (2006) propose a method for optimizing coordination between bus feeder routes and urban rail systems. Delgado et al. (2009) evaluate how two operational strategies, vehicle holding and boarding limits, can reduce the time passengers spend waiting and traveling in a bus corridor. This thesis builds on this work by using strategy analysis to demonstrate the potential benefits of schedule planning and operation at a corridor (instead
of single route) level.
2.2
Understanding User Strategies
In transportation, a strategy can be defined as a choice set and a decision rule. Kurauchi et al. (2012) conducted an exploratory survey in an attempt to understand passenger strate-gies in multi-route corridors. They found that passengers tend to consider a set of possible routes rather than one fixed path. The passengers surveyed were flexible both in terms of route choice and stop choice. Those who did not have accumulated knowledge from repeated trips on the corridor relied on information provided and were less flexible in their path choice than passengers who relied on their own knowledge and experiences.
Choudhury et al. (2010) also studied strategies, applying a dynamic latent plan model to driver strategies for entering a freeway. The dynamic latent plan model attempts to address the evolutionary nature of strategies that Choudhury et al. (2010) identify. They specify four factors that cause plans to evolve. First, people may be influenced by contextual changes. In the bus route choice context, this could include buses that are more crowded than expected. Second, people are influenced by past experiences. If they have to wait a long time for limited stop one day, they may choose not to wait for it the next day. Third, people have inertia in their plan choice. They may continue to go to their closest local stop, because it is a route they know well, whereas they would have to plan a new walking route to go to a stop served by a limited stop bus. Finally, people may change plans due to time-inconsistent preferences. For example, people may alter their behavior when they realize they are running late.
This thesis does not focus on the dynamic aspect of plan formation, but rather attempts to expand the understanding of passenger strategies in multi-route corridors by developing methods to identify passengers’ route choice strategies and the factors that explain these choices. One important contribution is the development of a web-based survey to collect information on passenger strategies, details of their trips, and personal characteristics. Not only does this demonstrate the feasibility of using a web-based survey for data collection, but it allows for a deeper understanding of passenger behavior in multi-route corridors.
2.3
Incorporating Strategy Analysis in Service Planning
Passengers’ access and egress time, waiting time, and in-vehicle time on a multi-route cor-ridor depend on the strategy that they use to select a boarding stop and route. Strategies influence the demand for each route as well as the loads on vehicles in the corridor. Pas-sengers are likely to change their strategies in response to service changes on a corridor. It is complicated to incorporate this interactive relationship between route choice strategies, demand, and quality of service into decisions about service planning. While some models for service planning on multi-route corridors make strong simplifying assumptions about passenger strategies, others have attempted to incorporate the concept of a route choice strategy.
Lampkin and Saalmans (1967) describe a method to determine the service frequencies on a multi-route corridor that minimizes the sum of total travel time for all passengers. Their method assumes fixed demand by origin and destination (OD) pair and allocates it deter-ministically to the route with the shortest total travel time. This does not incorporate the concept of choice set of routes that Kurauchi et al. (2012) discusses. This is problematic, as the following example demonstrates. A passenger’s preferred boarding and alighting stop are served by two bus routes. Both routes have the same in-vehicle time between stops, but Route 1 has headways of ten minutes and Route 2 has headways of two minutes. The expected waiting time for Route 1 is therefore longer than the expected waiting time for Route 2. Using deterministic assignment to the route with the shortest travel time, all flow would be assigned to Route 2. In reality, passengers are likely to board whichever of the two routes arrives at their stop first.
Han and Wilson (1982) introduced some complexity to the demand assignment process by defining passengers as part of either captive flows or variable flows. Passengers who can only take one route to their destinations make captive flow trips while passengers with options make variable flow trips. The variable flow trips are divided between the possible routes according to their frequency shares. While this does not incorporate any sort of decision rule that passengers use to select between routes, it does account for passengers’ tendency to consider a set of route options rather than a single route for their trips. Han and Wilson used this method of demand assignment in a model that allocates a fixed number of buses to parallel routes, in a manner that avoids vehicle capacity issues. The model estimates the number of vehicles that should be assigned to each route to minimize passenger flow2 on each route subject to loading feasibility and fleet size constraints. The loading feasibility constraint guarantees that on average, there will be capacity on each vehicle for the waiting passengers to board.
Chriqui and Robillard (1975) also used the idea that passengers conceive of a set of routes that serve their destination and board whichever arrives first. They assert that passengers may not be willing to take all possible routes, if some take much longer than others. In-stead, they formulated an optimization problem that generates a set of optimal routes that passengers traveling between a given OD pair would be willing to take. Their model also accounts for variation in vehicle arrival processes of different routes by allowing the planner to input different arrival distributions for each route. The model assumes that passengers board the first vehicle to arrive out of the optimal route set. They argue that this model provides more realistic estimates of loads on parallel links within a bus network. Spiess and Florian (1989) used a similar method to model passenger decisions at each transfer point in a network. Again, this provides public transit planners with more accurate demand assign-ments, and Spiess and Florian also suggest that it may be useful for other transportation applications such as the shipment of freight by different modes.
Focusing on a multi-route bus corridor in Chicago, Schwarcz (2005) developed a model tai-lored for corridors that have both local and limited stop service, in which not all passengers board the first bus to arrive that serves their destination. The model takes the existing demand for specific origin and destination pairs along the route and re-assigns it to one of three different markets using an all-or-nothing allocation minimizing total weighted travel time. The three markets are local preferred (those people who board at a stop served only
2Due to the difficulties of specifying a function of passenger flow, the model uses the occupancy at the
by local buses or choose to wait for local service), limited preferred (people who go to a stop that is served by the limited stop route and wait for limited stop service) and choice passengers, who she defines as people who will go to a stop that is served by local and limited stop service and will take the first bus to arrive. Based on these market shares, her model reassigns demand at the stop and route level. An important component of her model is the estimation and use of weights for each type of travel time. Passengers typically perceive access, waiting, and in-vehicle time differently. Schwarcz estimated these weights by applying five different sets of weights to her model for Chicago’s Western Avenue and determining which set most closely replicated reality. She then used her strategy assignment model to evaluate different potential service frequencies for limited stop and local service on the corridor.
In evaluating these service changes, Schwarcz assumes that demand on the corridor is fixed. Scorcia (2010) created a variable demand model that uses elasticities to predict demand changes in response to changes in travel time. He used an existing corridor in Chicago that had recently implemented limited stop service to estimate elasticities of demand. Like Schwarcz, Scorcia divided the population into three markets: local preferred, limited pre-ferred, and choice. While Schwarcz assigned demand to the strategy with the minimum travel time, using all-or-nothing assignment, Scorcia used strategies identified in an on-board survey to estimate a logit model that explained strategy choice in terms of weighted components of travel time. In the onboard survey, he asked passengers to identify their strategy - whether they waited for local or limited stop service or took the first bus. By conducting this survey, the work by Scorcia represents a departure from the previous studies, which made assumptions about strategies rather than attempting to measure them directly. This thesis builds on this work by providing three methodologies to infer route choice strategies from AVL and AFC data, and also by conducting a web-based survey on route choice strategy and related factors. The web-based survey data includes informa-tion on many addiinforma-tional factors that Scorcia could not ask about in his shorter onboard survey. For example, the survey conducted here collects information on attitudes such as sensitivity to crowding and levels of risk aversion. These questions were based on a survey conducted by Carrier (2008) who found that attitude influenced individuals’ selection of airline itineraries.
In addition, Scorcia was only able to survey 182 people, while the web-based survey was answered by more than 9000 individuals, and the methods for inferring strategies from AVL and AFC data can be applied even more broadly. Both the survey data and the inferences from the AVL and AFC data can be used to test the assumptions about route choice strategies that are used in demand assignment models. The analysis of the explanatory factors that are linked to route choice strategy can also inform these models and improve planners’ evaluations and decision-making processes with regard to multi-route corridors. This thesis strengthens the connection between a more detailed assessment of passenger route choice strategies and network and service planning, such as decisions about stop locations and the allocation of vehicles to routes. It also uses the strategy assessment to quantify some of the benefits of corridor-level schedule planning and operation.
Chapter 3
Background Information on the
Case Studies
In this thesis, route choice strategy identification techniques are applied to two corridors in London. The first is a corridor in the Beulah Hill area of South London (the Beulah Corridor), which consists of two parallel local service routes. The second corridor runs east-west from White City Bus Station to Uxbridge (the Uxbridge Corridor) and is made up of a limited stop service bus route that overlaps with two local service routes. This chapter summarizes background information about each of these corridors and also specifies the data sources used for analysis.
3.1
Beulah Corridor
In the Beulah Corridor, Route 196 and Route 468 run parallel for approximately 6.2 km (3.9 miles). Figure 3-1 shows a map of the corridor. They share 23 stops in the inbound direction and 26 stops in the outbound direction. Table 3.1 summarizes the corridor ridership and headways. The average weekday ridership is determined from ten weekdays in September and October 2012. Passengers whose Oyster card (smartcard) transactions revealed that they both boarded and alighted in the corridor (at stops served by both routes) were counted, and these numbers were scaled up at a route level to reflect Electronic Ticket Machine (ETM) counts for the ten days. Over 6,000 passengers board and alight in the Beulah Corridor each weekday. Route 468 provides more frequent service with headways of seven minutes in the inbound morning (AM) peak and headways of six minutes in the outbound AM peak. Route 196 has somewhat longer AM peak headways of eleven minutes.
Table 3.1: Beulah Corridor Ridership and Headways
Average Weekday Ridership AM Peak Headway
Inbound Outbound Inbound Outbound
Route 196 1,138 1,239 11 11
Figure 3-1: Map of the Beulah Corridor
Figure 3-2 shows the frequency with which passengers use the corridor over the ten weekdays analyzed in September and October. The majority of passengers who used the corridor in these ten days took just one trip on the corridor. Figure 3-3 displays the same data in another way, showing the proportion of trips made by different user types, categorized as infrequent, semi-frequent, frequent, or very frequent users. Less than 30% of trips are made by infrequent users, passengers who made just one or two trips on the corridor in the ten-day period. However, the majority of trips (almost 70%) in the corridor are made by infrequent or semi-frequent users, who made eight trips (or four round trips) or fewer over the ten-day period. Only 32% of trips on the corridor were made by frequent or very frequent users.
The majority of the analysis in this thesis focuses on the AM peak period, which was defined by considering a histogram of boardings on the corridor by half hour period. Figures 3-4 and 3-5 show the boardings by time of day on the corridor during the ten weekdays analyzed. In both directions, the AM peak shows a clearly defined rise in the number of boardings. In the inbound direction, the AM peak was defined as lasting from 7:00 to 9:30, while in the outbound direction, the AM peak is slightly shorter, lasting from 7:30 to 9:30.
These definitions were used to determine the median and range of loads on the two routes in the corridor. Each vehicle trip on a route is numbered and the AFC data records the vehicle trip number for the bus that an individual boarded. Using this boarding information and the inferred alighting stop for each passenger (alighting stops were inferred by the ODX program, see Section 3.3), the loads for each vehicle trip at each stop can be calculated. Because these loads only include passengers with inferred origin and destination stops, these values are scaled up by a constant at the route level to reflect ETM counts. All vehicle trips that reached the first stop in the corridor during the hours defined as the AM peak were used to calculate median, tenth percentile and ninetieth percentile loads. Figures 3-6
Figure 3-2: Frequency of Beulah Corridor Use
Figure 3-4: Beulah Inbound Boardings by Time of Day
and 4-5 show these values for the stops on the corridor using the data from ten weekdays in September and October 2012. Loads in the inbound direction are higher than in the outbound direction, and there is not much variation in load in either direction. The loads on Route 468 buses are somewhat higher than the loads on the Route 196 buses.
Three stops in the inbound direction and one stop in the outbound direction are geograph-ically offset for the two routes. That is, the stop for the Route 196 buses is a block or more away from the stop for the Route 468 buses. An example is shown in figure 3-8 of the Norwood Road/ Robson Road stops. These slight geographic discrepancies could cause bus users to favor one route or another if they are boarding or alighting at one of these stops. In addition, passengers who board at these offset stops are forced to choose to wait at one stop or the other, meaning that they must select a stop to board at rather than a route to board. Therefore, all trips that included a boarding or alighting at one of these stops were removed from the majority of the analysis, and set aside for a special panel analysis of passengers’ flexibility of stop choice which is summarized in Chapter 4.
Several other routes run parallel to routes 196 and 468 for parts of the corridor. Routes x68, 249, and 690 each visit eleven or more stops along the corridor. The strategy identification analyses presented in this thesis are dependent on the number of routes an individual can choose from and on the specific characteristics of each of these routes. Therefore, the analysis focuses exclusively on passengers traveling between OD pairs served by routes 196 and 468 only. Table 3.2 shows how this restricts the number of OD pairs and the number of trips covered in this analysis. Because of the prevalence of parallel routes in this area, only 25% of inbound trips and 35% of outbound trips are considered in the analysis presented in Chapter 4. However, to gain insight into the behavior of the other users of the corridor, the analysis could be repeated for the ODs served by each set of parallel routes.
Table 3.2: Summary of Beulah Corridor Data for Analysis
OD Pairs Included Oyster Trips Over Ten Days % of Corridor Ridership Inbound 90 7,380 25% Outbound 137 11,912 35%
3.2
Uxbridge Corridor
The Uxbridge Corridor is about 20.2 km (12.6 miles) long and is served by three routes: 207, 427, and 607. Route 607 is a limited stop route, which skips up to five consecutive local stops. Traveling inbound from Uxbridge, Route 607’s first six stops (3.9 miles) are also served by Route 427; its next nine stops (5.2 miles) are served by both Route 427 and Route 207; and its final six stops (2.3 miles) are served by Route 207. Figure 3-9 shows a map of this corridor and Table 3.3 summarizes some key corridor statistics. Notably, the corridor serves a high volume of passengers, with more than 90,000 passengers trips daily. The limited stop route, Route 607, has the least frequent service, with headways of eight minutes in the inbound direction and ten minutes outbound. The riderships counts
Figure 3-9: Map of the Uxbridge Corridor
are from ETM data for ten weekdays in September and October, while the headways are scheduled.
Table 3.3: Uxbridge Corridor Ridership, Headways, and Stop Spacing
Average Weekday Ridership AM Peak Headway
Average Stop Spacing
(meters)
Inbound Outbound Inbound Outbound
Route 207 21910 20754 5 5 306
Route 427 12895 12507 8 8 312
Route 607 12451 12042 8 10 1011
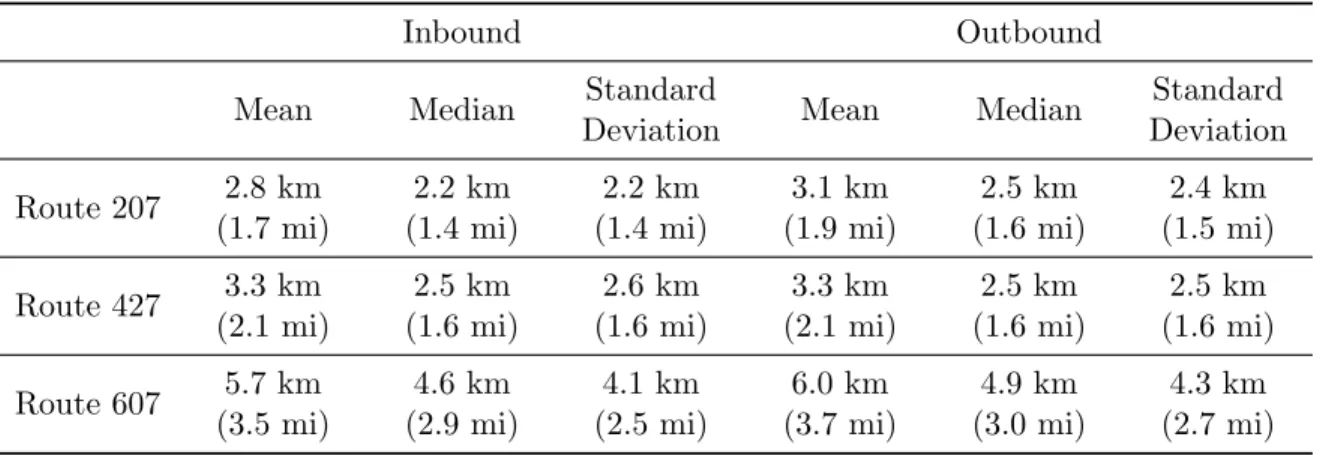
Figures 3-10 and 3-11 show that shorter trips are served mainly by the local service routes, while longer trips are concentrated on the limited stop service route. Table 3.4 further summarizes the characteristic trip lengths on each route. Typical trips on Route 427 are slightly longer than trips on Route 207 and trips on Route 607 are more than twice the length, on average, of Route 207 trips. The trip lengths are based on Oyster card data processed by the ODX program (see Section 3.3).
Figure 3-12 displays the number of trips made by users in the ten consecutive weekdays in September and October that were analyzed. The majority of passengers on the corridor take one or two trips. Compared to the Beulah Corridor, however, many more of the trips are made by frequent of very frequent users. Figure 3-13 shows that more than half of the trips on the Uxbridge Corridor are made by passengers who make nine or more trips in the ten-day period. This means that while the Uxbridge Corridor has many users, including a large share of infrequent users, the majority of trips on the corridor are made by frequent users.
Figure 3-10: Inbound Trip Lengths By Service Type
Table 3.4: Uxbridge Corridor Trip Lengths by Route (Fall 2012)
Inbound Outbound
Mean Median Standard
Deviation Mean Median
Standard Deviation Route 207 2.8 km (1.7 mi) 2.2 km (1.4 mi) 2.2 km (1.4 mi) 3.1 km (1.9 mi) 2.5 km (1.6 mi) 2.4 km (1.5 mi) Route 427 3.3 km (2.1 mi) 2.5 km (1.6 mi) 2.6 km (1.6 mi) 3.3 km (2.1 mi) 2.5 km (1.6 mi) 2.5 km (1.6 mi) Route 607 5.7 km (3.5 mi) 4.6 km (2.9 mi) 4.1 km (2.5 mi) 6.0 km (3.7 mi) 4.9 km (3.0 mi) 4.3 km (2.7 mi)
Figure 3-13: Uxbridge Corridor Trips by User Type
Due to the configuration of the routes, it is possible that a passenger would transfer from one corridor route to another. For example, a passenger who lives near a local stop on Route 427, may take Route 427 for a few stops until the bus reaches a combined, local and limited stop service bus stop. Then, the user could transfer from Route 427 to Route 607 at the combined stop and continue his or her journey on Route 607 to his or her destination. However, this behavior was found to be very rare. Only 3.3% of trips in the inbound direction and 3.8% of trips in the outbound direction formed part of this type of transfer.
The boardings on the Uxbridge Corridor throughout the day show that while defined AM and PM peaks exist, there is also a high level of ridership in the mid-day period (See figures 3-14 and 3-15. The inbound AM peak, which was the principal focus of analysis, was judged to last from 7:00 to 9:30. Some analysis also focuses on the outbound AM peak which lasts from 7:30 to 9:30.
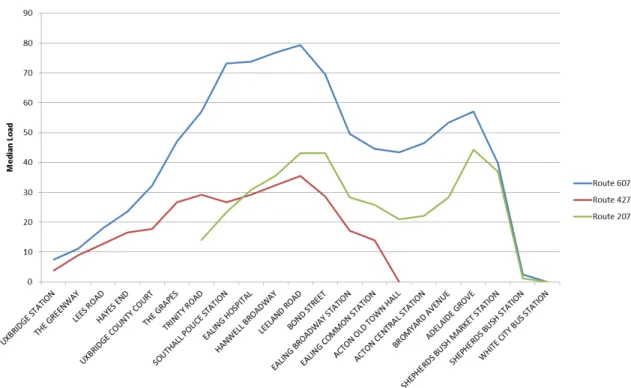
As in the Beulah Corridor, loads for individual vehicles were tracked using Oyster card data with origins and destinations inferred using the ODX program. These loads were then scaled up at a route level to meet ETM totals. Vehicle loads at each stop were calculated for all vehicle trips on the ten weekdays in September and October. Those vehicle trips that began during the AM Peak period were used to determine the median AM peak load at each stop along the corridor. Figure 7-3 shows the median loads at each combined stop (those stops served by Route 607 and one or more of the local routes) during the AM peak. Median loads on Route 607 are nearly double the loads on routes 207 and 427 in the middle portion of the corridor. In this middle area, crowding appears to be a serious issue on Route 607 given that the seated capacity on Route 607 is just 62 people. There is also space for 25 standees, resulting in a total capacity of 87 people. With median loads of nearly 80 from
Figure 3-14: Uxbridge Inbound Boardings by Time of Day
Figure 3-16: Uxbridge Inbound AM Peak Loads
Southall Police Station to Bond Street, this suggests that half of the inbound vehicles that arrive at these stops in the AM peak are very near capacity.
Like in the Beulah Corridor, other routes run parallel to these routes, serving some of the same stops and OD pairs. The route choice strategy identification methods are contingent on the set of routes available for an individual to choose between. Therefore, the analysis for the Uxbridge Corridor was restricted to those OD pairs that are served only by routes 207, 427 and/or 607. Table 3.5 shows that this removes about 35% of passenger trips from the analysis. Because parallel routes tend to follow the corridor for short distances, this process removes more shorter-distance OD pairs than longer-distance pairs. However, some shorter OD pairs remain, which can be used for comparison with the longer pairs.
Table 3.5: Summary of Uxbridge Corridor Data for Analysis
OD Pairs Included Oyster Trips Over Ten Days % of Corridor Ridership Inbound 2,151 290,936 62% Outbound 2,210 303,005 67%
3.3
Data Sources
Ridership and load data is from ten weekdays at the end of September and the beginning of October in 2012. Oyster data, from the smartcard fare collection system, records the
time that an individual taps his or her smartcard to board a bus, as well as the vehicle trip number and route number. This data was processed using the Origin Destination Interchange (ODX) program developed by Gordon (2012) which infers the stop at which these individuals alighted based on their other trips in the system on the same day. On the corridors analyzed, more than 98% of transactions were with smartcards. The ODX program inferred origins and destinations for 77% of these taps on the Beulah Corridor and 81% of taps on the Uxbridge Corridor. For ridership and vehicle load information, these trips are scaled up to meet Electronic Ticket Machine (ETM) data. The ETM data records all boardings regardless of ticket type and including non-paying passengers, such as young children.
Headway information was assessed from posted schedules as well as from Automated Vehicle Location data, called iBus. iBus data records the arrival and departure time of each vehicle from each stop. iBus data was also used to determine the running time between OD pairs.
The final data source used in this research is an online survey. The online survey was sent specifically to registered Oyster users who had provided email address and who used routes 207, 427, and/or 607 between February 4th and 17th, 2013. The survey asked respondents about two recent trips, asking them to identify their starting and ending location, access mode, boarding and alighting stop, the time of day of the trip, their use of real-time arrival information, and the trip purpose. They were also asked questions to identify their route choice strategy and a set of questions about indicators of their attitudes toward crowding, walking time, waiting time, and in vehicle time, their risk aversion, and their level of trust in the information given to them. Finally, they were asked some questions about their demographic characteristics, including age, income, and gender. More information about the survey design and the representativeness of the survey data can be found in Chapter 4.
In conjunction with the survey, Oyster and iBus data for the Uxbridge Corridor from two weeks in February 2013, and ODX-processed Oyster data from one week in February 2013 was used. The ridership patterns for February are similar to those in September and October of 2012. Table 3.6 shows the average daily ridership for the five weekdays in February that were analyzed. In general, ridership is slightly lower than it was in the September/ October days analyzed with the exception of inbound ridership on Route 207 which essentially remained the same.
Table 3.6: Uxbridge Corridor Ridership (February 2013)
Inbound Outbound Route 207 21920 19322 0.0% ∗ -6.9% ∗ Route 427 12289 12391 -4.7% ∗ -0.9% ∗ Route 607 12020 11095 -3.5% ∗ -7.9% ∗
∗ Indicates the % difference of these ridership February figures compared with two weeks in September/October 2012.
Figure 3-17: Frequency of Uxbridge Corridor Use (February 2013)
Table 3.7 shows the mean, median and standard deviation of trip length for the three routes from the February data. These values are almost identical to the values from September and October. At most they differ by .1 km (.06 miles). The pattern of frequency of corridor usage is also very similar to the Fall 2012 data. Figure 3-17 shows the number of passengers who took a given number of trips over ten weekdays in February. The shape is almost identical to Figure 3-12. The reason that the magnitude of passengers is greater in February is that all Oyster taps are included while in the fall data only Oyster taps with inferred origin and destination were considered.
Table 3.7: Uxbridge Corridor Trip Lengths by Route (February 2013)
Inbound Outbound
Mean Median Standard
Deviation Mean Median
Standard Deviation Route 207 2.8 km (1.7 mi) 2.2 km (1.4 mi) 2.2 km (1.4 mi) 3.0 km (1.9 mi) 2.5 km (1.6 mi) 2.4 km (1.5 mi) Route 427 3.3 km (2.1 mi) 2.5 km (1.6 mi) 2.5 km (1.6 mi) 3.3 km (2.1 mi) 2.5 km (1.6 mi) 2.5 km (1.6 mi) Route 607 5.7 km (3.5 mi) 4.6 km (2.9 mi) 4.1 km (2.5 mi) 5.9 km (3.7 mi) 4.9 km (3.0 mi) 4.2 km (2.6 mi)
Chapter 4
Analysis of Automatically
Collected Data
This chapter details three methods to characterize passengers’ route choice strategies in a multi-route corridor using only automatically collected data. For simplification, these methods ignore the dynamic properties of plan formation. For example, this analysis does not include a strategy in which passengers plan to wait for a specific route but alter their behavior given real-time information. Passenger strategies are categorized as either first bus (passengers take the first bus that serves their destination) or favorite bus (passengers wait for a bus of a specific route). The three methods employed are empirical analysis, probabilistic modeling, and panel-based analysis.
Both the empirical analysis and the probabilistic model are applied to samples of passen-gers segmented by trip length. The probabilistic model, which infers passenpassen-gers strategies based on the headways that preceded their boardings, is also applied to samples that are further-segmented based on stop-level crowding, passenger experience, and the availability of real-time countdown information. The empirical analysis and probabilistic model focus on passengers’ decisions once at a stop. The panel analysis sheds light on both the flexibility of passengers’ route choice once at a stop, and also on their flexibility of their stop selection. Each method is explained and then followed with the results for the Beulah and Uxbridge Corridors.
4.1
Empirical Analysis Methodology
The empirical analysis uses bus arrival times to estimate the proportion of time in a given time period (such as the AM peak) that each bus is the first bus to arrive. Bus arrivals of all routes in the choice set at a given stop are considered, as in Figure 4-1. Each color represents a different bus route. To calculate the proportion of time the green route is the first bus to arrive, the length (in time) of all green segments is summed, and divided by the total time period being considered. This represents the proportion of passengers expected to board the green route under the assumption that passengers board the first bus that serves their destination.
Figure 4-1: Schematic of Bus Arrivals at a Stop
These expected proportions are then compared to the actual proportions of passengers who boarded each route during that time period. Under the assumption of a constant mean passenger arrival rate at any stop, if all passengers boarded the first bus serving their destination, these proportions would be identical. A constant mean arrival rate means that the average arrival rate within each headway in the period analyzed is the same. Thus, the number of arrivals is proportional to the length of the headway. If the expected proportions under these assumptions are not identical to the actual proportions of passengers who board each route, either some passengers do not board the first bus that serves their destination, or the mean arrival rate is not constant across the period.
4.2
Empirical Analysis Results
4.2.1 Beulah Corridor
The empirical analysis was performed on the stop in each direction that had the greatest number of boardings in the analysis data set. The analysis data set excludes OD pairs that are served by additional parallel routes, other than Route 196 and Route 468. It also excludes trips in which the boarding or destination stops are geographically offset (not shared) between the two routes under study.
The Crown Point/ Knight’s Hill stop was selected in the inbound direction. The analysis was restricted to the AM peak period, to ensure that the assumption of a constant mean arrival rate would be more more realistic. The AM peak period was selected, as described in Section 3.1 by plotting a histogram of boardings over 30-minute time periods throughout the day, with boardings summed over ten weekdays. In the inbound direction, the AM peak was determined to last from 7:00 AM to 9:30 AM. 649 passengers boarded at this stop in the AM peak period and had a destination served by only routes 196 and 468.
In the outbound direction, the Norwood Road/ Robson Road stop was selected. Based on the histogram of boardings, the AM peak period was determined as 7:30 AM to 9:30 AM. During this period, in the ten weekdays analyzed, 529 people took trips on routes 196 and 468 that were served exclusively by these two routes.
For each direction, iBus data provides actual bus arrivals at the boarding stop for the AM peak period for ten days in the fall of 2012. This data was used to calculate the expected proportions. The actual proportions were determined using Oyster data processed through the ODX period for the same period and days. Table 4.1 shows the expected proportions compared to the actual proportions of passengers that boarded each route. In both directions, the actual proportion of passengers on Route 196 is slightly greater than expected. However, the differences between the actual proportions and the expected proportions are very small: less than .03 for both routes in both directions. The close match
between expected and actual proportions suggests that a first bus strategy is dominant along the corridor.
Table 4.1: Empirical Analysis Results for the Beulah Corridor
Inbound Outbound
Route 196 Route 468 Route 196 Route 468
Expected Proportion 0.431 0.569 0.372 0.628
Actual Proportion 0.458 0.542 0.389 0.611
4.2.2 Uxbridge Corridor
For the Uxbridge Corridor in the inbound direction, trips from Southall Police Station were analyzed. This stop was selected because it had a substantial number of boardings with trips of varied distances. The analysis focuses on the AM peak period, determined based on a histogram of boardings over time (see Section 3.2). For the inbound direction, the AM peak period was designated as 7:00 AM to 9:30 AM.
This research hypothesized that route choice decisions would vary depending on the length of the trip on the Uxbridge Corridor. For longer trips, the in-vehicle time savings of taking Route 607, the limited stop route, are greater than for shorter trips. This suggests that passengers with longer trips will be more likely to wait for a limited stop bus. The distri-bution of trip length by service type (see Section 3.2) confirms this theory by showing that longer trips are far more likely to be taken on Route 607 than shorter trips. To measure this variation, the actual proportions were calculated for a set of samples of passengers defined by these passengers’ destination stops.
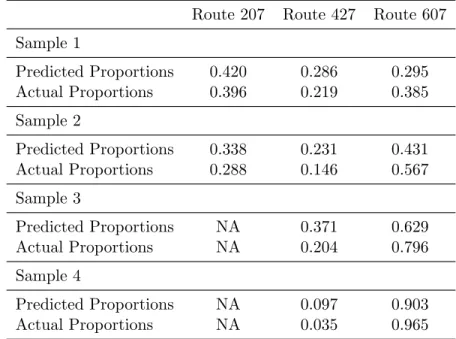
Table 4.2 shows the expected proportions under the first bus assumption (calculated from iBus data) compared to the actual proportions (determined from ODX-processed Oyster data) for two samples. These samples consist of passenger trips from Southall Police Station to destinations served by all three of the Uxbridge Corridor routes: 207, 427, and 607, and not served by additional parallel routes. Table 4.3 lists the destination stops considered in each sample and the expected in-vehicle travel time on the local and limited stop routes.
Table 4.2: Empirical Analysis Results for Uxbridge Inbound Samples in the Three-Route Market
Route 207 Route 427 Route 607 First Bus Proportions 0.528 0.240 0.232
Sample 1 0.378 0.167 0.455
Sample 2 0.300 0.215 0.486
The first sample consists of trips during the AM peak from Southall Police Station to Leeland Road. This trip takes approximately 14 minutes on routes 207 or 427 and 11 minutes on Route 607. The second sample is composed of trips from Southall Police Station to Ealing Broadway Station. The trip time is approximately 23 minutes on the local routes and 19 minutes on Route 607. For the longer trip, the proportion of passengers selecting Route 607