Publisher’s version / Version de l'éditeur:
Vous avez des questions? Nous pouvons vous aider. Pour communiquer directement avec un auteur, consultez la première page de la revue dans laquelle son article a été publié afin de trouver ses coordonnées. Si vous n’arrivez pas à les repérer, communiquez avec nous à [email protected].
Questions? Contact the NRC Publications Archive team at
[email protected]. If you wish to email the authors directly, please see the first page of the publication for their contact information.
https://publications-cnrc.canada.ca/fra/droits
L’accès à ce site Web et l’utilisation de son contenu sont assujettis aux conditions présentées dans le site LISEZ CES CONDITIONS ATTENTIVEMENT AVANT D’UTILISER CE SITE WEB.
Research Report (National Research Council of Canada. Institute for Research in Construction), 2003-12-01
READ THESE TERMS AND CONDITIONS CAREFULLY BEFORE USING THIS WEBSITE. https://nrc-publications.canada.ca/eng/copyright
NRC Publications Archive Record / Notice des Archives des publications du CNRC :
https://nrc-publications.canada.ca/eng/view/object/?id=67cd1698-7edc-451c-87f1-5b00fec50838 https://publications-cnrc.canada.ca/fra/voir/objet/?id=67cd1698-7edc-451c-87f1-5b00fec50838
NRC Publications Archive
Archives des publications du CNRC
For the publisher’s version, please access the DOI link below./ Pour consulter la version de l’éditeur, utilisez le lien DOI ci-dessous.
https://doi.org/10.4224/20378283
Access and use of this website and the material on it are subject to the Terms and Conditions set forth at The Effect of Office Design on Workstation Lighting: Simulation Results
The Effect of Office Design on Workstation Lighting:
Simulation Results
G. R. Newsham, D. M. Sander
Institute for Research in Construction
National Research Council Canada, Ottawa, ONT, K1A 0R6, Canada
IRC-RR-148
Acknowledgements
This work was part of the COPE (Cost-effective Open Plan Environments) project supported by Public Works and Government Services Canada, Ontario Realty Corporation, USG Corporation, Natural Resources Canada, Steelcase, British Columbia Buildings Corporation, and The Building Technology Transfer Forum. The authors would like to thank Ms. Jennifer De Kleine who performed extensive exploratory simulations. We are also grateful for the contributions for the other members of the COPE research team.
Executive Summary
0.5 0.6 0.7 0.8 0.9 1.0 1.1 24 30 36 42 48 54 60 66 72 78 Partition Height (in.)Ede s k ( fr act io n o f b ase case, 30" ) parabolic 0.6 0.7 0.8 0.9 1.0 1.1 4 6 8 10 WS Size (ft.) Ede s k ( fr a ct io n o f b a se ca se , 10 f t. )
The Cost-effective Open-Plan Environments (COPE) study was designed to investigate the effect of open-plan office design on the indoor environment, and on occupant satisfaction with that environment. As part of this investigation, we conducted computer simulations to investigate the effect of office design on the luminous
environment in open-plan space, for a variety of lighting designs.
Effect of workstation partition height on desktop illuminance relative to illuminance with no partitions above desktop, by luminaire type.
prismatic
The office space variables we examined were partition height, workstation size, workstation reflectivity, and ceiling reflectivity. We examined the effects of each of these on desktop illuminance, illuminance around the computer, illuminance uniformity, partition luminance, and VDT screen glare risk. We examined these effects for 14 of the most common
ambient lighting designs for open-plan offices, and developed general realtionships from these results. The general relationships relating to desktop illuminance are shown in this Executive Summary.
Workstation size = 10’x10’; workstation reflectivity = 50%; ceiling reflectivity = 80%.
indirect component
Effect of workstation size on desktop illuminance relative to illuminance for a 10’ x 10’ workstation.
Like any study, this one has its limits and assumptions, which are detailed in the main body of the report. Nevertheless, we found that office space design has a large effect on the luminous environment experienced by the occupant, all the more interesting considering that much office lighting design is done without considering furniture at all.
Partition height = 64”; workstation reflectivity = 50%; ceiling reflectivity = 80%.
Increasing partition height, decreasing workstation size or reflectivity, or decreasing ceiling reflectivity, will all lower desktop illuminance and partition
luminance, and increase illuminance uniformity. For example, varying partition height or workstation size over ranges typical of practice can change desktop illuminance by 20%, whereas varying the reflectance of partitions and desktop over typical practice ranges can change
desktop illuminance by 10%. Changing ceiling reflectivity has a substantial effect on illuminance only if the luminaires have a sizeable indirect component. Glare risk is mainly a function luminaire type. Fixtures with prismatic lenses are the worst offenders, louvered fixtures reduce glare at the expense of lower partition luminance, indirect fixtures have the lowest potential glare, provided the reflective ceiling does not become a source of glare itself.
The workstations modelled in the majority of our simulations did not include storage elements or occupant-related items (e.g., books, office supplies, plants). These items can have substantial local shadowing effects. Task lighting can be very effective at providing localised supplementary lighting. 0.5 0.6 0.7 0.8 0.9 1.0 1.1 0 10 20 30 40 50 60 WS Reflectance (%) Ed esk ( fr a c tio n o f b a s e c a s e , 8 0 /5 0 /2 0 ) parabolic 0.8 0.9 1.0 1.1 1.2 1.3 60 70 80 90 100 Ceiling Reflectance (%) Ede s k ( fr ac tio n o f b ase case, 80/ 50 /20) direct Effect of workstation reflectivity on
desktop illuminance relative to illuminance for a workstation of 50% reflectivity, by luminaire type.
prismatic indirect component indirect component Workstation size = 10’x10’; partition height = 64”; ceiling reflectivity = 80%.
Effect of ceiling reflectivity on desktop illuminance relative to illuminance for a ceiling of 80% reflectivity, by luminaire type.
Workstation size = 10’x10’; partition height = 64”; workstation reflectivity = 50%
The results of these simulations both support the findings of other studies, and extend our understanding of the effects of obstructions on the luminous
environment. These results will now be used in combination with the results of other COPE tasks in tools aid designers of open-plan office accommodation.
Table of Contents
1. INTRODUCTION ... 6
2. METHODS & PROCEDURES... 7
2.1 SELECTING A TOOL... 7
2.1.1 Validation exercise... 8
2.2 SPACE DESIGN VARIABLES... 9
2.3 LIGHTING DESIGN VARIABLES... 10
2.3 SPECIFICATION OF DATA POINTS... 11
2.3.1 Multi-workstation evaluations and “dithering” ... 12
2.4 OTHER SIMULATION INFORMATION... 13
2.4.1 Simulation time vs. accuracy ... 13
2.5 CRITERIA DERIVATION... 15
3. RESULTS ... 16
3.1 DESKTOP ILLUMINANCE (EDESK) ... 16
3.1.1 Effect of partition height ... 16
3.1.2 Effect of workstation size ... 19
3.1.3 Effect of workstation reflectivity ... 20
3.1.4 Effect of ceiling reflectivity ... 21
3.2 ILLUMINANCE UNIFORMITY (UEDESK) ... 22
3.2.1 Effect of partition height ... 22
3.2.2 Effect of workstation size ... 23
3.2.3 Effect of workstation reflectivity ... 24
3.2.4 Effect of ceiling reflectivity ... 25
3.3 ILLUMINANCE AROUND THE COMPUTER (EVDT)... 26
3.3.1 Effect of partition height ... 26
3.3.2 Effect of workstation size ... 27
3.3.3 Effect of workstation reflectivity ... 28
3.3.4 Effect of ceiling reflectivity ... 29
3.4 PARTITION LUMINANCE BEHIND COMPUTER (LPT3,4)... 30
3.4.1 Effect of partition height ... 31
3.4.2 Effect of workstation size ... 31
3.4.3 Effect of workstation reflectivity ... 32
3.4.4 Effect of ceiling reflectivity ... 33
3.5 VDT GLARE RISK (VDTG) ... 33
3.7 EFFECT OF STORAGE ELEMENTS... 34
4. DISCUSSION ... 37
4.1 COMPARISON TO OTHER WORK... 37
4.1.1 Comparison to other research studies... 37
4.1.2 Comparison to the Lumen Method ... 39
4.2 COMPLIANCE WITH DISTRIBUTION-BASED DESIGN CRITERIA... 41
4.3 GENERALISING RESULTS FOR OTHER LIGHTING DESIGNS... 43
4.4 ACCOUNTING FOR THE NON-INDEPENDENCE OF EFFECTS ON EDESK... 50
4.5 EXAMPLE CALCULATION FOR AN ARBITRARY LIGHTING SYSTEM... 51
5. CONCLUSIONS ... 54
The Effect of Office Design on Workstation Lighting:
Simulation Results
G. R. Newsham, D. M. Sander Institute for Research in Construction
National Research Council Canada
1. Introduction
The Cost-effective Open-Plan Environments (COPE) study was designed to investigate the effect of open-plan office design on the indoor environment, and on occupant satisfaction with that environment. To conduct this investigation, COPE employed literature reviews, lab. studies, computer simulations, and field studies. This document reports on computer simulations to investigate the effect of office design on the luminous environment in open-plan space, for a variety of lighting designs.
The primary design criterion for office lighting continues to be desktop
illuminance. The most common method used to predict desktop illuminance at design time, the Lumen Method [IESNA, 2000], was originally developed
assuming that there were no obstructions of any kind within the space. However, it has long been recognised [e.g., Spencer, 1957] that obstructions can
substantially reduce the desktop illuminance in a real space, depending on the geometrical relationship between the obstruction and the working plane. Such considerations are particularly important in the open-plan office environment where the nature of systems furniture results in many obstructions between sources of light (direct and reflected) and the working plane (the desktop), and where the desktop directly abuts one or more vertical obstructions (cubicle partitions).
There have been a number of studies investigating the effect of obstructions on luminous conditions, and the IESNA Handbook now includes a modified version of the Lumen Method for calculating mean working plane illuminance within open-plan workstations. However, these previous studies are limited in relation to the needs of the COPE task either because:
1. they did not include the full range of workspace parameters of interest (workstation size, partition height, surface reflectances); or,
2. they did not examine the full range of dependent variables of interest (desktop illuminance, illuminance around the computer, illuminance uniformity, partition luminance, reflections in the computer screen),
or because they were deficient in both. In fact, with respect to dependent variables, previous studies have focussed almost exclusively on desktop
illuminance. In light of these deficiencies, we decided to pursue our own study. In the Discussion section below, we will describe the previous studies in more detail in comparing their results to the results of our study.
2. Methods & Procedures 2.1 Selecting a tool
Previous studies into the effect of obstructions have adopted one of two methods:
1. measurements in full-scale or scale models; or 2. analytical modelling.
Given the range of independent and dependent variables in this study, it seemed impractical to employ the physical modelling approach, which left us with
analytical modelling (simulation). Previous investigators have developed their own analytical models. However, there are now several publicly-available tools to choose from, capable of doing a much better job than any model we could develop ourselves given the resources available.
We considered realistic rendering capability as important, primarily for evaluation of reflections in the computer screen, and also for presentation purposes. We considered both RadianceTM and LightscapeTM as potential tools. Radiance uses primarily a ray-tracing method, whereas Lightscape uses primarily a radiosity model. Radiance is generally considered more accurate [Houser et al., 1999; Lee & Maunder], but (at the time we began this work) was a lot harder to use and required more computing power. We considered the errors due to mistakes in operation to be a serious risk, and so we opted for Lightscape ver 3.2.
All lighting simulation tools are known to have limitations in the prediction of absolute luminous values, even for relatively simple spaces. However, it is important to note the difficulties in making comparisons to measured values in real spaces. First, it is known that errors in field-photometry (e.g., using a
handheld luminance meter to measure the luminance at a spot on a real surface) can be of the order of 10%. Secondly, it is notoriously difficult to accurately evaluate the surface properties of a material (reflectance, specularity etc.) in order to input them into a model. As a result, we can have a lot more confidence in the relative values output from a simulation tool than the absolute values. For example, we can have more confidence in a statement such as “increasing the height of partitions 12” decreased the desktop illuminance by 10%,” than in the statement, “increasing the height of partitions 12” decreased the desktop illuminance from 500 to 450 lux.” Nevertheless, in comparing our results to design criteria, or to luminous values demonstrated to be important to occupants in human factors studies, we need to use absolute values. In this regard, it is important to remember that the application of the results of this study will be at design time, prior to the specification of particular obstructions and materials. Given this uncertainty, inherent at design time, we will consider the absolute predictions as appropriate for comparative evaluation of design options at the early design stage, though they may not accurately predict the luminous conditions in the final space as-built.
2.1.1 Validation exercise
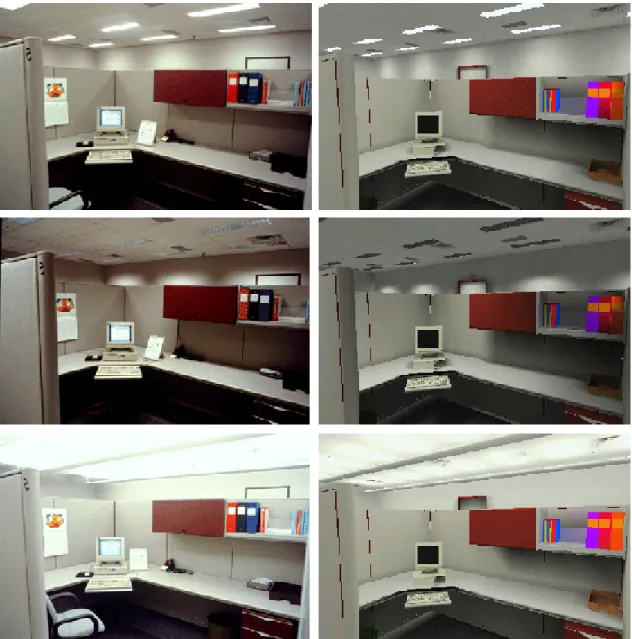
To gain a better understanding of the limitations of Lightscape in predicting absolute luminous values, we conducted a validation exercise. For this exercise we simulated the luminous environment in the IERF under three different lighting designs. The predicted values of illuminance and luminance at certain points were compared to the values measured when those designs were physically installed in the space during an experiment on lighting quality in offices [Veitch & Newsham, 1998]. Reflectances and photometric data were taken from a similar exercise carried out by Houser et al. [1999] in the same space.
Figure 1. An open-plan office space lit with three different lighting systems. Photographs of the real space (left) are compared with Lightscape renderings (right).
Figure 1 shows a visual comparison between Lightscape simulations and photographs of the real space. Table 1 compares the predicted and measured luminous values.
Table 1. Comparison of measured luminous values and those predicted by Lightscape for an open-plan office lit by three different lighting systems.
Desktop, close to computer Desktop, under storage Partition behind computer, upper Partition behind computer, lower Partition under storage lx lx cd/m2 cd/m2 cd/m2
meas sim meas sim meas sim meas sim meas sim
Lens 360-450 410-480 360-430 430 44-49 49-51 30-38 41-44 21-23 15 Louver 460-540 490-530 410-440 420 23-35 31-36 21-30 33-35 7-8 8 Indirect 610-710 480-570 430-470 410 65-80 61-63 50-60 48-50 20-27 20
Visually, the computer renderings from Lightscape match the photographs of the real space quite well. All of the major differences between systems are reflected in the renderings. Note, for example, the luminance patterns on the distant walls, the ceiling brightness, and the shadowing on the partitions behind the computer and below the partition-mounted storage elements.
Numerically, the predicted values of luminance and illuminance differ from the measured values by up to 20%. The predicted luminance on the partitions behind the computer tends to be higher than the measurements for the direct systems, and lower than the measurements for the indirect system. A similar observation can be made for the desktop illuminances. Nevertheless, the trends between the systems are similar for both the measurements and the simulations. Partition luminances are highest for the indirect system, next highest for the lensed system, and lowest for the louvered system. Desktop illuminances are highest for the indirect system, next highest for the louvered system, and lowest for the lensed system
The agreement between the measurements in the real space and predictions from the simulations are reasonable in the context of this work; i.e., relative comparisons between lighting systems at the design stage. It is also worth noting that differences between the photometrics of the luminaires in the
simulations (based manufacturers’ data) and between actual performance in the IERF, could explain some of the lack of agreement.
2.2 Space design variables
Table 2 shows the independent variables related to the space design for this study. These are all variables where effects on luminous conditions have been demonstrated by other studies, or for which we would expect effects.
There are too many variables and too many values of each variable to study all combinations in a reasonable time with our resources. Our approach is to consider Workstation Size, Partition Height, Ceiling Height and Reflectances as
independent variables – each will be looked at separately as variations on the base case.
Table 2. Open-plan office design variables addressed in Lightscape simulations. Base case is shown in shaded.
Variable Range Unit
Workstation Size 10 x 10 8 x 8 6 x 6 ft Partition Height 72 64 48 in Ceiling Height 9 8 ft Reflectances* 90/50/20 80/50/20 80/35/20 80/20/20 % * these are ceiling/workstation surfaces/floor respectively – workstation surface value applies to partition walls and desktop. Reflectance of boundary walls was fixed at 50%.
2.3 Lighting Design Variables
Table 3 shows the lighting designs simulated in this study. These designs were chosen after consultation with COPE clients and with leading North American lighting designers. Our goal in this consultation was to identify the most commonly specified lighting designs for open-plan office space.
Table 3. Basic description of lighting designs used in the simulations.
Description Size (ft) Lamps Layout (ft) Code
Prismatic 1 x 4 1 5 x 5 P11 Prismatic 2 x 4 3 8 x 8 P22 Prismatic 2 x 2 2 8 x 8 P32 Louver 1 x 4 1 5 x 5 L21 Louver 2 x 4 2 8 x 10 L32 Louver 2 x 4 3 8 x 10 L42 Louver 2 x 2 2 8 x 8 L53 Dir/Indirect 1 x 4 2 5 x 10 I11
Dir/Indirect 1 x 4 2 Rows @ 10’ I14
Dir/Indirect 1 x 4 2 Centred on WS I15
Dir/Indirect 1 x 4 3 Rows @ 12’ I22
Indirect 1 x 4 2 8 x 8 I33
Indirect 1 x 4 2 1 fixture/partition I36
Dir/Indirect 2 x 4 2 8 x 8 I43
The specific fixtures used were those that came with the Lightscape fixture library. While they are modelled on a particular fixture from a particular
manufacturer, we expect the results that emerge from the study will allow us to draw conclusions about generic fixture types. In all cases the output of the fixture was multiplied by a factor of 0.8 to account for total lumen depreciation
(lamp ageing, dirt accumulating on fixture etc.), to more accurately reflect the maintained luminous conditions to be expected. In addition, 1x4, 1-lamp fixtures (P11, L21) were simulated by halving the output from a 1x4 2-lamp fixture, since no 1-lamp fixture was available in the Lightscape fixture library.
Note, this study addresses only electric lighting, there was no daylight simulated in these studies. This is reasonable because it is the common design
assumption, so that adequate lighting is also provided at night. In addition, in many deep-plan office buildings, interior workstations receive no appreciable daylighting even during the day. In fact, it is commonly assumed that there is no appreciable daylight contribution at points further than 15’ from a window.
Nevertheless, we are planning to address daylight effects in a future COPE task.
2.3 Specification of data points
The locations of individual data points used in the analysis are shown in Figure 2.
24” 34” VDTG F FWWDD L LEEFFTT U UPP D DOOWWNN R RIIGGHHT B BAACCKK T I ILL44 I ILL33 I ILL22 I ILL11 I IRR44 I IRR33 I IRR22 I IRR11 O OLL OORR M MLL MMRR VL VR KL KR OLL OLU ILL ILU IRU IRL ORL ORU
Figure 2. Individual data points for a single workstation. Illuminances are shown in yellow, luminances in green. The red text indicates a measure of screen glare, which was the fraction of
the screen with a visible image.
Values for all the points shown in Figure 2 were predicted using Lightscape simulations. Various derived measures were calculated from the values at the individual points. Measures referring to desktop illuminance involved the points OLU, OLL, ILU, ILL, IRL, IRU, ORL and ORU. Measures referring to illuminance at the computer involved the points KL, KR, VL and VR. General measures of partition luminance involved the points IR3, IR4, IL3 and IL4, as these were the only points that were meaningful for partition heights as low as 48”. Cubic illuminance measurements refer to the points LEFT, RIGHT, UP, DOWN, FWD,
BACK, the illuminances on the six faces of a cube at the position of the head of a seated occupant.
These particular points were chosen to be compatible with the data points chosen during the IRC Lighting Quality project [Veitch & Newsham, 1998] and the COPE field study measurements. They were also chosen to be
representative of certain design criteria or measures shown to correlate with subjective responses (see Table 4).
2.3.1 Multi-workstation evaluations and “dithering”
Even for a regular array of light fixtures and workstations, no one workstation will necessarily have the same relationship to the luminaires as any other
workstation, as shown in Figure 3. So taking predicted values from only one workstation might bias the results. Therefore we decided to take predictions from six workstations. 4 3 2 0 1
Figure 3. Relationship between lighting and workstation layouts, and shifts during “dithering”.
Even then, no one arrangement of workstations to luminaires is unique or favoured – for most typical general illumination applications there’s no reason why the whole array of workstations could not be shifted a little in any direction relative to the luminaires. With these considerations in mind, we adopted a process we call “dithering”, running each simulation five times for each
workstation/luminaire combination. Four of these were with the WS moved a few feet in various directions (where appropriate), and the fifth rotates the luminaires by 90° (where appropriate), as shown Figure 3. By simulating six workstations in five different relationships to the luminaire grid (or five “dither” states), we hoped to get a representative data set without it becoming unmanageable.
2.4 Other simulation information
Figure 4 shows the general layout for the space as simulated. A 100’ x 100’ floor space was used with 12 identical workstations located near the centre of the space, so as to minimise the effects of the boundary walls. The arrangement of the workstations is typical of practice. Data were taken from six of the 12
workstations, as shown in Figure 2. These six were chosen to include
workstations with differing numbers of neighbouring workstations, representative of real workplaces. In this way we included the effect of neighbouring
workstations on the lighting distribution.
Figure 4. Typical arrangement of workstations on a larger simulated office floor. The location of luminaires in the ceiling is indicated by the light orange boxes.
The light fixtures were located according to the designs specified in Table 3. Generally this involved regular arrays of luminaires over the whole floor, so that distant surfaces were appropriately lit. In this way we aimed to get the most realistic lighting conditions on the workstations being studied, without including a whole floor of workstations, which would have made calculation time prohibitive.
2.4.1 Simulation time vs. accuracy
The radiosity simulation process involves iterative redistribution of light energy between the tens of thousands of surfaces in the model. Complete distribution of the energy, so that all surfaces are in equilibrium with each other, signifies the
final completion of the simulation. Unfortunately, for relatively complex simulations like ours, 100% distribution of energy can take a long time to achieve. Using a number less than 100% represents a trade-off between potential accuracy and time. Figure 5 shows the relationship between energy distribution, simulation time, and predicted desktop illuminance for a relatively simple case (P11) and a much more complex case (I11).
0 100 200 300 400 500 600 0 20 40 60 80 100 120 140 160
Simulation Time (mins)
M e an D e skt o p I ll u m in an ce (l x) 96% 60% 94% 99% 99.5% 99.9% 99.99% 0 100 200 300 400 500 600 0 100 200 300 400 500 600 700 800 900 1000 1100
Simulation Time (mins)
M ean D es kt o p I ll u m in a n c e ( lx) 94% 60% 96% 99% 99.5% 99.9% 99.99%
Figure 5. The relationship between mean desktop illuminance and simulation time for a simpler lighting design (P11, upper) and a more complex design (I11lower). The labels on the curves
show initial lighting energy distributed.
The curve shapes are essentially the same, though the simulation times are very different. Desktop illuminance does increase by around 5% by running the simulation beyond 99% energy distribution to 99.99%, however, this quadruples simulation time. In absolute terms, the increase in simulation time is manageable for a simple simulation, but is unacceptable for a complex simulation –
remember, the examples in Figure 5 represent only one “dither” of one combination of office design variables, for one lighting design. Running the simulations longer for the simple cases only would introduce inconsistencies
between lighting designs. Given this information, the decision to stop the
simulations at 99% energy distribution strikes a reasonable compromise between practicality and potential accuracy. Note, any underestimates introduced will be similar for all lighting designs and should not compromise relative comparisons.
2.5 Criteria derivation
The results of the simulations were compared to a variety of different criteria derived from codes, standards and recommended practice, or from studies showing subjective effects for certain luminous variables at certain levels. Table 4 summarises these criteria.
Table 4. Performance criteria for simulations
Luminous variable Criterion Derivation
Desktop Illuminance (Edesk)
% data points <450 lx Labour Canada [1990], CLC [1991], IESNA [2000]. The Canada Labour Code states that for task positions in offices where “continuous reading or writing” is performed, that the minimum desktop illuminance shall not be less than 500 lx. However, in recognition of the errors in photometry, a measured value of 10% less is permissible. For general office work, the IESNA also recommends 500 lx.
Desktop Illuminance (Edesk)
% data points <300 lx % data points >600 lx
Newsham & Veitch [2000]. The second of their lighting quality experiments indicated that for occupant preference a desktop illuminance of around 300 to 600 lx would be preferred in a VDT space. Illuminance around
computer (Evdt)
% data points >550 lx Labour Canada [1990], CLC [1991], ANSI/IESNA [1993]. The Canada Labour Code states that for task positions in offices where “data entry” is performed, that the average desktop illuminance shall not exceed 500 lx. However, in recognition of the errors in photometry, a measured value of 10% less is permissable. For VDT spaces IESNA RP-1 also recommends a maximum illuminance of 500 lx. Desktop Illuminance
uniformity (UEdesk)
% data points <80% of mean Edesk
CIBSE LG7 [1993] states “The ratio of minimum illuminance to average illuminance should not be less than 0.8 over the relevant area.
Luminance on partition behind computer (Lpt3,4)
% data points <25 cd/m2 Veitch & Newsham [2000]. Review of work from several sources indicates that occupant preference is around 20-30 cd/m2, so we chose a mid-point.
3. Results
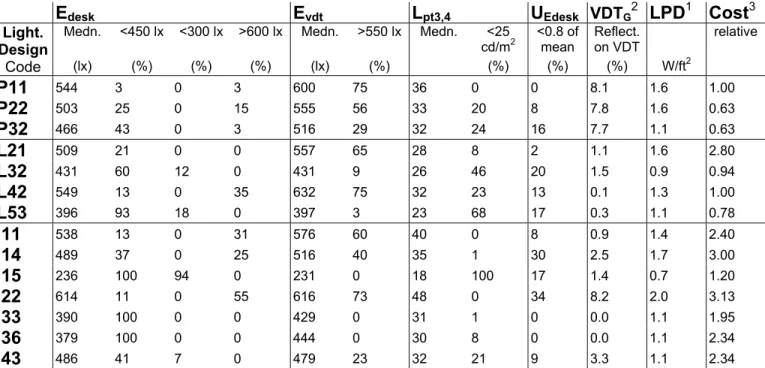
Table 5 shows summary predicted data for all lighting designs for the basecase workstation (10’ x 10’, 64” partitions, 50% reflectance, 9’ ceiling).
Table 5. Summary data for all lighting designs for the basecase workstation.
Edesk Evdt Lpt3,4 UEdesk VDTG
2
LPD1 Cost3
Light. Design
Medn. <450 lx <300 lx >600 lx Medn. >550 lx Medn. <25 cd/m2 <0.8 of mean Reflect. on VDT relative Code (lx) (%) (%) (%) (lx) (%) (%) (%) (%) W/ft2 P11 544 3 0 3 600 75 36 0 0 8.1 1.6 1.00 P22 503 25 0 15 555 56 33 20 8 7.8 1.6 0.63 P32 466 43 0 3 516 29 32 24 16 7.7 1.1 0.63 L21 509 21 0 0 557 65 28 8 2 1.1 1.6 2.80 L32 431 60 12 0 431 9 26 46 20 1.5 0.9 0.94 L42 549 13 0 35 632 75 32 23 13 0.1 1.3 1.00 L53 396 93 18 0 397 3 23 68 17 0.3 1.1 0.78 I11 538 13 0 31 576 60 40 0 8 0.9 1.4 2.40 I14 489 37 0 25 516 40 35 1 30 2.5 1.7 3.00 I15 236 100 94 0 231 0 18 100 17 1.4 0.7 1.20 I22 614 11 0 55 616 73 48 0 34 8.2 2.0 3.13 I33 390 100 0 0 429 0 31 1 0 0.0 1.1 1.95 I36 379 100 0 0 444 0 30 8 0 0.0 1.1 2.34 I43 486 41 7 0 479 23 32 21 9 3.3 1.1 2.34 1
LPD calculated assuming 32W lamps and 1 ballast/fixture drawing 8W.
2
Only the screen for one workstation (#2) at one dither (#0) used here for comparison.
3
From information supplied by PWGSC, based on their experience of fixtures and installation costs. In the following sections we illustrate in more detail the predicted effects of the various office design parameters on the different luminous outcome variables.
3.1 Desktop Illuminance (Edesk)
3.1.1 Effect of partition height
Figure 6 shows the effect of partition height on the predicted desktop illuminance from the simulations; other design parameters are as for the base case defined in Table 2. Lighting design I36 was excluded from this analysis because it uses partition-mounted fixtures, so partition heights differing from the base case were not relevant. In this plot we are looking for general relationships, so the desktop illuminance is expressed as a fraction of the desktop illuminance for the same lighting design but with no partitions above desktop height1, best expressed in this case as a partition height equal to desktop height (30”). In this case, the
1
This was actually modelled by removing all partitions, but the difference between having no partitions and having partitions up to desktop level is insubstantial. Other workstation furniture was included in the ‘no partitions’ simulation.
partitions’ case (30”) is the obvious normalisation point, rather than the previously stated basecase partition height (64”). Normalising to the no-partitions case will allow for a better comparison with work by other researchers, who have generally examined the effect of obstructions with reference to an empty room.
0.5 0.6 0.7 0.8 0.9 1.0 1.1 24 30 36 42 48 54 60 66 72 78
Partition Height (in.)
Ede s k (fr a c ti o n o f b a se ca se , 30 ") P11 P22 P32 L21 L32 L42 L53 I11 I14 I15 I22 I33 I43
Figure 6. Median desktop illuminance vs. partition height, normalised to the desktop illuminance with no partitions above the desktop. Fixtures with prismatic lenses are shown in yellow hues, parabolics in greens, and fixtures with an indirect component in reds. Workstation size = 10’ x
10’, workstation reflectivity = 50%, ceiling reflectivity = 80%.
There is a clear and expected trend for Edesk to decrease with increasing partition
height. This main effect appears to interact with luminaire type, and again, this is as expected. Parabolic louvered fixtures, which generally have a greater fraction of their light output directed straight down, are least affected in a relative sense by an increase in partition height. Fixtures with a prismatic lens, with more light directed off the vertical axis, tend to be more affected by partition height,
because a greater proportion of the light reaching the desktop would arrive from angles that are blocked by vertical obstructions. Fixtures with an indirect
component, and which rely most on inter-reflection of light to reach the desktop, are most affected.
Figure 7. The fixture type I43, shown left in manufacturer’s literature and right, in a similar design, as simulated. 0.5 0.6 0.7 0.8 0.9 1.0 1.1 24 30 36 42 48 54 60 66 72 78 Partition Height (in.)
Ed esk ( fr act io n o f b ase case, 30" ) parabolic prismatic indirect component
Figure 8. General relationship between normalised desktop illuminance and partition height, by fixture type. Workstation size = 10’ x 10’, workstation reflectivity = 50%, ceiling reflectivity = 80%.
One anomaly is the fixture type I43, shown in Figure 7. This fixture aims to provide some of the characteristics of an indirect fixture in a ceiling-recessed mounting. Nevertheless, in appearance it more closely resembles a recessed prismatic-lensed fixture, and its curve in Figure 6 concurs with this observation. Therefore, in future categorising of fixtures by predicted performance, I43 will be included with the prismatic fixtures.
Given the grouping by fixture type displayed in Figure 6, it seems reasonable to derive general relationships by fixture type, these are shown in Figure 8.
3.1.2 Effect of workstation size
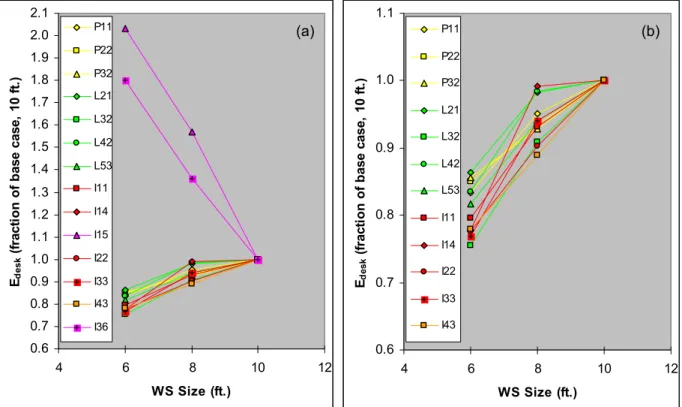
Figure 9 shows the effect of workstation size on the predicted desktop
illuminance from the simulations; other design parameters are as for the base case defined in Table 2. In this case the data are normalised to the value for a square cubicle workstation of size 10’, the basecase size, because there is no obvious reason (as there was for partition height, for example) to normalise to something other than the base case. Figure 9(a) shows results for all lighting designs. Designs I15 and I36 are unusual in that they employ fixtures at the centre of workstations and on partitions respectively, thus the number of fixtures increases as the workstation size decreases. In Figure 9(b) these two designs were excluded to allow examination of the more general trend.
0.6 0.7 0.8 0.9 1.0 1.1 1.2 1.3 1.4 1.5 1.6 1.7 1.8 1.9 2.0 2.1 4 6 8 10 12 WS Size (ft.) Ede s k ( fr act io n o f b as e cas e, 10 f t. ) P11 P22 P32 L21 L32 L42 L53 I11 I14 I15 I22 I33 I43 I36 0.6 0.7 0.8 0.9 1.0 1.1 4 6 8 10 WS Size (ft.) Ed esk ( fr ac ti o n o f b ase c ase, 10 f t. ) P11 P22 P32 L21 L32 L42 L53 I11 I14 I22 I33 I43 (b) (a) 12
Figure 9. The effect of workstation size on median desktop illuminance, normalised to the basecase workstation size (10’). In (a) results for all lighting designs are shown. In (b) the two
designs which increase the number of fixtures with decreasing workstation size are excluded. Partition height = 64”, workstation reflectivity = 50%, ceiling reflectivity = 80%.
In Figure 9(b) there is a clear trend in the expected direction. As workstation size decreases and the density of obstructions in the space increases, Edesk
decreases. In this case there is no obvious grouping by fixture type, so the results from all fixture types are used together to derive a general relationship, as shown in Figure 10. For this relationship we can hypothesise a non-linear trend, because the number of obstructions would be related to the area of the
workstation, and not the linear size.
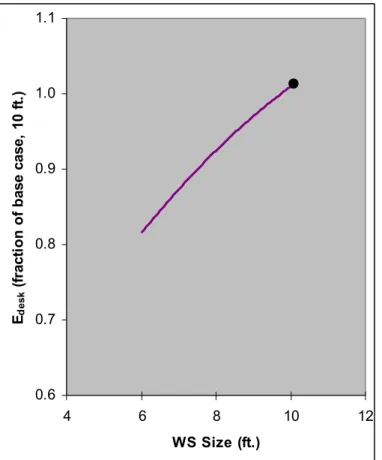
0.6 0.7 0.8 0.9 1.0 1.1 4 6 8 10 WS Size (ft.) Ede s k (fr a c ti o n o f b a se ca se , 10 ft. ) 12
Figure 10. General relationship between normalised desktop illuminance and workstation size. Partition height = 64”, workstation reflectivity = 50%, ceiling reflectivity = 80%.
3.1.3 Effect of workstation reflectivity
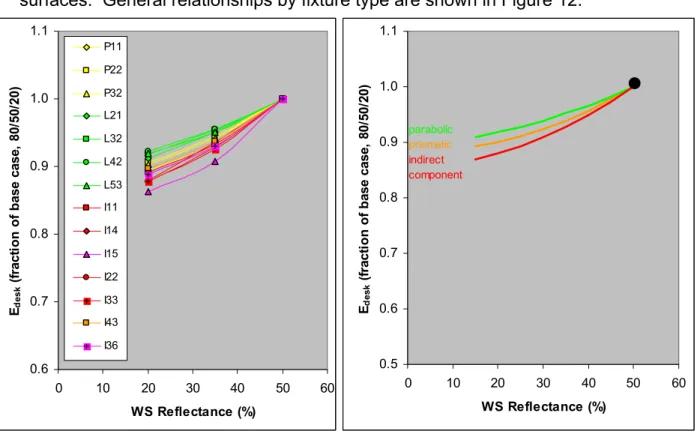
Figure 11 shows the effect of workstation reflectivity on the predicted desktop illuminance from the simulations; other design parameters are as for the base case defined in Table 2. In this case the data are normalised to the value for reflectivities of 80/50/20, the basecase values.
The results show the expected trend: as the workstation (partitions and desktop) reflectance decreases, so does Edesk. The principal mechanism to explain this
effect is the reduced reflection of light from the partition closest to the data point. Therefore, it is no surprise that there is an interaction with fixture type – those fixture types that are most reliant on reflection of light from surfaces to reach the
working plane have the largest dependency on the reflectance of workstation surfaces. General relationships by fixture type are shown in Figure 12.
0.6 0.7 0.8 0.9 1.0 1.1 0 10 20 30 40 50 60 WS Reflectance (%) Ed esk ( fr act io n o f b ase ca se , 80 /50 /20) P11 P22 P32 L21 L32 L42 L53 I11 I14 I15 I22 I33 I43 I36 0.5 0.6 0.7 0.8 0.9 1.0 1.1 0 10 20 30 40 50 60 WS Reflectance (%) Ed esk ( fr a ct io n o f b a se cas e, 8 0/ 5 0/ 2 0) parabolic prismatic
Figure 11. The effect of workstation reflectance on normalised desktop illuminance for all lighting designs studied. Partition height = 64”, workstation size = 10’
x 10’, ceiling reflectivity = 80%.
Figure 12. General relationship between normalised desktop illuminance and workstation reflectance, by fixture type. Partition height = 64”, workstation size = 10’
x 10’, ceiling reflectivity = 80%.
3.1.4 Effect of ceiling reflectivity
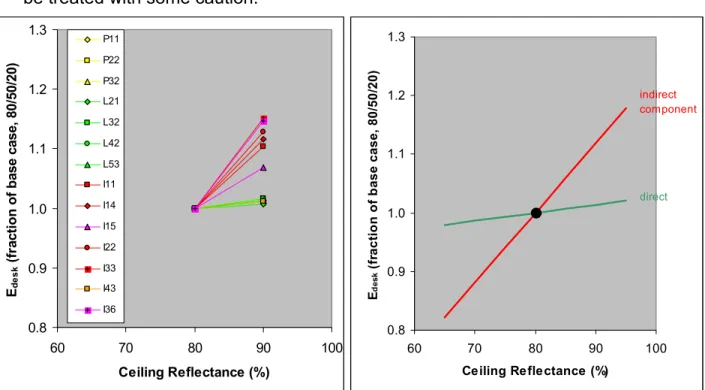
Figure 13 shows the effect of ceiling reflectivity on the predicted desktop illuminance from the simulations; other design parameters are as for the base case defined in Table 2. In this case the data are normalised to the value for reflectivities of 80/50/20, the basecase values.
The results show the expected trend, as the ceiling reflectance increases, so does Edesk. However, as expected, there is a strong effect of luminaire type.
Fixtures recessed in the ceiling with primarily direct delivery of light to the desktop (prismatic, parabolic and the recessed indirect I43) exhibit only a small effect of ceiling reflectance. Fixtures with a substantial indirect component, for which the ceiling is the target surface and principal light distribution medium, exhibit a strong effect.
Generic relationships, presented separately for direct fixtures and fixtures with an indirect component, are shown in Figure 14. Note that the extension of the
indirect component
curves below 80% reflectance is an extrapolation of available data, and should be treated with some caution.
0.8 0.9 1.0 1.1 1.2 1.3 60 70 80 90 100 Ceiling Reflectance (%) Ede s k ( fr act io n o f b ase case, 80/ 50/ 20) P11 P22 P32 L21 L32 L42 L53 I11 I14 I15 I22 I33 I43 I36 0.8 0.9 1.0 1.1 1.2 1.3 60 70 80 90 100 Ceiling Reflectance (%) E de s k ( fr ac tio n o f b ase case, 80/ 50 /20) direct
Figure 13. The effect of ceiling reflectance on normalised desktop illuminance for all lighting designs studied. Partition height =
64”, workstation reflectivity = 50%, workstation size = 10’ x 10’.
Figure 14. General relationship between normalised desktop illuminance and ceiling reflectance, by fixture type. Partition height =
64”, workstation reflectivity = 50%, workstation size = 10’ x 10’.
It is worth noting that while increasing ceiling reflectivity might be an effective way of boosting desktop illuminance, if the reflectivity is too high there is the risk that the ceiling itself can become a source of glare.
3.2 Illuminance Uniformity (UEdesk)
3.2.1 Effect of partition height
Figure 15 shows the effect of partition height on the uniformity of predicted desktop illuminance from the simulations; other design parameters are as for the base case defined in Table 2. Again, lighting design I36 was excluded from this analysis because it uses partition-mounted fixtures.
Note that for UEdesk we are counting the percentage of data points below 0.8 x
mean Edesk, for each lighting design/workstation design combination. The mean
Edesk used for this criterion is the mean for that particular lighting
design/workstation design combination.
The effect of partitions is striking, with the exception of one lighting design (I14) none of the measured points on the desktop had an illuminance less than 80% of the mean illuminance in the no-partitions case. However, in most cases, the
indirect component
shadowing caused by even 48” partitions results in some data points falling below the 80% criterion, and, as expected, as partition height increases uniformity generally declines (UEdesk increases).
In this case, there is no obvious simple grouping by fixture type, but there are effects of lighting design that would be expected. In general, we would expect more uniform luminaire layouts to exhibit better uniformity, with more luminaires of lower output performing better than fewer luminaires of higher output.
Compare P11 to P22 for example, or L21 to L42. We might expect luminaires with an indirect component to provide better uniformity, however, we see the opposite if those luminaires are arranged in widely spaced rows (I14, I22).
0 10 20 30 40 50 24 30 36 42 48 54 60 66 72 78
Partition Height (in.)
Ede s k poi nt s < 0 .8 x E de s k (m e a n ) (% ) P11 P22 P32 L21 L32 L42 L53 I11 I14 I15 I22 I33 I43
Figure 15. The effect of partition height on desktop illuminance uniformity for all lighting designs studied (I36 excluded). Workstation size = 10’ x 10, workstation reflectivity = 50%, ceiling
reflectivity = 80%.
Note the similarity of the performance of P22 and I43, again reinforcing the decision to group I43 with the prismatic fixtures.
3.2.2 Effect of workstation size
Figure 16 shows the effect of workstation size on the uniformity of predicted desktop illuminance from the simulations; other design parameters are as for the base case defined in Table 2. Lighting designs I15 and I36 were excluded from
this analysis because, as noted above, they both require that the number of fixtures be increased as the size of the workstation decreases.
The general relationship is as we would expect, as workstation size decreases the shadowing from the increased density of obstructions in the space results in a decrease in uniformity. The trends by lighting design are similar to those described in section 3.2.1. Interestingly, three of the designs with indirect
components show uniformity improving from 10’ to 8’ workstations, before getting decidedly worse again for 6’ workstations. Our belief is that this is an anomaly of the particular relationship between luminaire and workstation layout for the 8’ case, rather than a property of the luminaires involved. Note that as workstation size changes, the position of most of the workstations in the space also changes to maintain continuous rows of workstations.
0 10 20 30 40 50 4 6 8 10 WS Size (ft.) Ede s k poi nt s < 0 .8 x E de s k (m ea n ) (% ) P11 P22 P32 L21 L32 L42 L53 I11 I14 I22 I33 I43 12
Figure 16. The effect of workstation size on desktop illuminance uniformity for all lighting designs studied (I15 and I36 excluded). Partition height = 64”, workstation reflectivity = 50%, ceiling
reflectivity = 80%.
3.2.3 Effect of workstation reflectivity
Figure 17 shows the effect of workstation reflectivity on the uniformity of
predicted desktop illuminance from the simulations; other design parameters are as for the base case defined in Table 2.
We might have expected that lower reflectivities lead to lower uniformity, but Figure 17 clearly shows that there is no substantial effect. On further
consideration, this is perhaps not so surprising. Figure 11 demonstrated that workstation reflectance has a much smaller effect on desktop illuminance than either partition height or workstation size. Also remember that this measure of uniformity is relative to the mean illuminance for that lighting design/workstation design combination. It seems that lowering workstation reflectance depresses the overall desktop illuminance somewhat, without changing the distribution much (increasing partition height and decreasing workstation size increase the density of obstructions and shadowing, lower reflectance does not). Therefore, the number of data points with an illuminance below 80% of the new lower mean does not change substantially.
0 10 20 30 40 50 0 10 20 30 40 50 60 WS Reflectance (%) Edesk points <0.8 x E desk (mean) (%) P11 P22 P32 L21 L32 L42 L53 I11 I14 I15 I22 I33 I43 I36 0 10 20 30 40 50 60 70 80 90 100 E des k p o in ts <0 .8 x E des k (m ea n) ( % ) P11 P22 P32 L21 L32 L42 L53 I11 I14 I15 I22 I33 I43 I36 WS Reflectance (%) Ceiling Reflectance
Figure 17. The effect of workstation reflectance on desktop illuminance uniformity for all lighting designs studied. Workstation size = 10’ x 10, partition height
= 64”, ceiling reflectivity = 80%.
Figure 18. The effect of ceiling reflectance on desktop illuminance uniformity for all lighting designs studied. Workstation size =
10’ x 10, partition height = 64”, ceiling reflectivity = 80%.
3.2.4 Effect of ceiling reflectivity
Figure 18 shows the effect of ceiling reflectivity on the predicted desktop illuminance from the simulations; other design parameters are as for the base case defined in Table 2. In this case the data are normalised to the value for reflectivities of 80/50/20, the basecase values.
The results show there is no appreciable effect for recessed fixtures with a direct light distribution. For fixtures with a substantial indirect component, there is a slight tendency, as would be expected, for a higher reflectance ceiling to improve uniformity.
3.3 Illuminance around the Computer (Evdt)
3.3.1 Effect of partition height
Figure 19 shows the effect of partition height on the predicted illuminance around the VDT from the simulations; other design parameters are as for the base case defined in Table 2. VDT illuminance includes the illuminance points on the keyboard and those at the top of the computer screen. Lighting design I36 was excluded from this analysis because it uses partition-mounted fixtures. Again, illuminance is expressed as a fraction of the VDT illuminance in the no-partitions case. 0.5 0.6 0.7 0.8 0.9 1.0 1.1 24 30 36 42 48 54 60 66 72 78
Partition Height (in.)
Evd t ( fr a c ti o n o f b a se ca se , 30 ") P11 P22 P32 L21 L32 L42 L53 I11 I14 I15 I22 I33 I43
Figure 19. Median VDT illuminance vs. partition height, normalised to the VDT illuminance with no partitions above the desktop. Workstation size = 10’ x 10, workstation reflectivity = 50%,
ceiling reflectivity = 80%.
There is a clear and expected trend for Evdt to decrease with increasing partition
height. The decline with partition height is more rapid than that for desktop illuminance (Figure 6), probably due to the influence of the points on top of the
VDT, which remain relatively unaffected by low partitions. This main effect appears to interact with luminaire type, and again, this is as expected, for reasons identical to those mentioned in section 3.1.1.
0.5 0.6 0.7 0.8 0.9 1.0 1.1 24 30 36 42 48 54 60 66 72 78 Partition Height (in.)
Evd t ( fr act io n o f b ase case, 30" ) parabolic prismatic indirect component
Figure 20. General relationship between normalised VDT illuminance and partition height, by fixture type. Workstation size = 10’ x 10, workstation reflectivity = 50%, ceiling reflectivity = 80%.
Given the grouping by fixture type displayed in Figure 19, it seems reasonable to derive general relationships by fixture type, these are shown in Figure 20.
3.3.2 Effect of workstation size
Figure 21 shows the effect of workstation size on the illuminance around the VDT from the simulations; other design parameters are as for the base case defined in Table 2. In this case the data are normalised to the value for a square cubicle workstation of size 10’, the basecase size. Figure 21 shows results for all lighting designs except I15 and I36, where the number of fixtures increases as the
workstation size decreases.
In Figure 21 there is a weak trend in the expected direction. As workstation size decreases and the density of obstructions in the space increases, Evdt decreases.
However, because Evdt includes data points on top of the VDT, this measure is
less susceptible to the effect of increased partition obstruction. The results for designs I14 and I22 are anomalous. Our belief is that this is due to the particular
relationship between luminaire and workstation layout for these cases, rather than a property of the luminaires involved. Note that as workstation size changes, the position of most of the workstations in the space also changes to maintain continuous rows.
0.6 0.7 0.8 0.9 1.0 1.1 4 6 8 10 12 WS Size (ft.) Evd t ( fr act io n o f b ase case, 10 f t. ) P22 P32 L21 L32 L42 L53 I11 I14 I22 I33 I43 0.6 0.7 0.8 0.9 1.0 4 6 8 10 12 WS Size (ft.) Evd t ( fr ac ti o n o f b a se c ase , 10 f t. ) 1.1 1.2 (a) (b) P11
Figure 21. The effect of workstation size on VDT illuminance, normalised to the basecase workstation size (10’). Results for
all lighting designs except I15 and I36 are shown. Partition height = 64”, workstation reflectivity = 50%, ceiling reflectivity = 80%.
Figure 22. The general relationship between workstation size and VDT illuminance, I14 and I22 have also been excluded. Partition height = 64”, workstation
reflectivity = 50%, ceiling reflectivity = 80%
In this case there is no grouping by fixture type, so the results from all fixture types (except I15, I36, I14, and I22) are used together to derive a general relationship, as shown in Figure 22. For this relationship we can hypothesise a quadratic trend, because the number of obstructions would be related to the area of the workstation, or the square of the linear size.
3.3.3 Effect of workstation reflectivity
Figure 23 shows the effect of workstation reflectivity on the predicted VDT illuminance from the simulations; other design parameters are as for the base case defined in Table 2. In this case the data are normalised to the value for reflectivities of 80/50/20, the basecase values.
The results show an expected, though weak, trend, that as the workstation (partitions and desktop) reflectance decreases, so does Evdt. The effect is
weaker than for desktop illuminance because of the influence of data points on top of the VDT that do not ‘see’ the partitions as much as desktop data points do. There is an interaction with fixture type, those fixture types that are most reliant on reflection of light from surfaces to reach the working plane have the largest dependency on the reflectance of workstation surfaces. General relationships by fixture type are shown in Figure 24.
0.5 0.6 0.7 0.8 0.9 0 10 20 30 40 50 60 WS Reflectance (%) Ed esk ( fr ac ti o n o f b a se cas e, 80 /50 /20 ) parabolic 0.6 0.7 0.8 0.9 1.0 0 10 20 30 40 50 60 WS Reflectance (%) Evd t ( fr a ct io n o f b ase cas e, 8 0/ 50 /20) P32 L21 L32 L42 L53 I11 I14 I15 I22 I33 I43 I36 1.1 1.0 1.1 P11 P22 prismatic
Figure 23. The effect of workstation reflectance on normalised VDT illuminance
for all lighting designs studied. Partition height = 64”, workstation size = 10’ x 10’,
ceiling reflectivity = 80%.
Figure 24. General relationship between normalised VDT illuminance and workstation
reflectance, by fixture type. Partition height = 64”, workstation size = 10’ x 10’, ceiling
reflectivity = 80%.
.
3.3.4 Effect of ceiling reflectivity
Figure 25 shows the effect of ceiling reflectivity on the predicted VDT illuminance from the simulations; other design parameters are as for the base case defined in Table 2. In this case the data are normalised to the value for reflectivities of 80/50/20, the basecase values.
The results show the expected trend, as the ceiling reflectance increases, so does Evdt. However, as expected, there is a strong effect of luminaire type.
Fixtures recessed in the ceiling with primarily direct delivery of light to the desktop exhibit only a small effect of ceiling reflectance. Fixtures with a substantial indirect component, for which the ceiling is the target surface and principal light distribution medium, exhibit a strong effect.
Generic relationships, presented separately for direct fixtures and fixtures with an indirect component, are shown in Figure 26.
indirect component
0.8 0.9 1.0 1.1 1.2 1.3 60 70 80 90 100 Ceiling Reflectance (%) Evd t ( fr act io n o f b as e c ase, 8 0/ 5 0/ 2 0) direct 0.8 0.9 1.0 1.1 1.2 1.3 60 70 80 90 100 Ceiling Reflectance (% ) Evd t ( fr act io n o f base case, 80/ 50/ 2 0) P11 P22 P32 L21 L32 L42 L53 I11 I14 I15 I22 I33 I43 I36
Figure 25. General relationship between normalised desktop illuminance and ceiling reflectance, by fixture type. Partition height = 64”, workstation size = 10’ x 10’, workstation
reflectivity = 80%.
Figure 26. The effect of ceiling reflectance on normalised desktop illuminance for all lighting designs studied. Partition height = 64”, workstation size = 10’ x 10’, workstation
reflectivity = 80%.
3.4 Partition Luminance behind Computer (Lpt3,4)
Figure 27. Median partition luminance vs. partition ht., normalised to luminance for basecase workstation. Workstation size= 10’ x 10’, workstation reflectivity=
50%, ceiling reflectivity= 80%.
Figure 28. General relationship between normalised partition luminance and partition ht., for all fixture types.
Workstation size= 10’ x 10’, workstation reflectivity= 50%, ceiling reflectivity= 80%. indirect component 0.7 0.8 0.9 1.0 1.1 1.2 1.3 1.4 24 30 36 42 48 54 60 66 72 78
Partition Height (in.)
Lpt 3 ,4 ( fr ac ti o n o f b ase ca se, 64") P11 P22 P32 L21 L32 L42 L53 I11 I14 I15 I22 I33 I43 0.7 0.8 0.9 1.0 1.1 1.2 1.3 1.4 24 30 36 42 48 54 60 66 72 78
Partition Height (in.)
Lpt 3 ,4 ( fr a c ti on of ba s e c a s e , 6 4 ")
3.4.1 Effect of partition height
Figure 27 shows the effect of partition height on the predicted luminance behind the VDT from the simulations; other design parameters are as for the base case defined in Table 2. Lpt3,4 includes only those luminance points relevant for
partition heights as low as 48”. Lighting design I36 was excluded from this analysis because it uses partition-mounted fixtures. Because the no-partitions case is not meaningful for partition luminance, the values in Figure 27 have been normalised to the basecase partition height of 64”.
There is a clear and expected trend for Lpt3,4 to decrease with increasing partition
height and therefore spatial obstruction. There does not appear to be consistent effect of fixture type, and a generic relationship for all fixture types, derived from a linear fit to the points, is shown in Figure 28.
3.4.2 Effect of workstation size
0.5 0.6 0.7 0.8 0.9 1.0 1.1 4 6 8 10 12 WS Size (ft.) Lpt 3 ,4 ( fr ac ti o n o f b ase c ase, 1 0 f t. ) P11 P22 P32 L21 L32 L42 L53 I11 I14 I22 I33 I43 0.6 0.7 0.8 0.9 1.0 1.1 4 6 8 10 WS Size (ft.) Lpt 3 ,4 ( fr act io n o f b as e case , 10 f t. ) 12
Figure 29. Median partition luminance vs. workstation size, normalised to the luminance for the basecase workstation
(partitions = 64”); results for all lighting designs except I15 and I36 are shown. Partition height = 64”, workstation reflectivity
= 50%, ceiling reflectivity = 80%.
Figure 30. General relationship between normalised partition luminance and workstation size. Partition height = 64”,
workstation reflectivity = 50%, ceiling reflectivity = 80%.
Figure 29 shows the effect of workstation size on the predicted partition luminance from the simulations; other design parameters are as for the base case defined in Table 2. In this case the data are normalised to the value for a
square cubicle workstation of size 10’, the basecase size. Figure 29 shows results for all lighting designs except I15 and I36, where the number of fixtures increases as the workstation size decreases.
There is a trend in the expected direction. As workstation size decreases and the density of obstructions in the space increases, Lpt3,4 decreases.
In this case there is no obvious grouping by fixture type, so the results from all fixture types (except I15, I36) are used together to derive a general relationship, as shown in Figure 30.
3.4.3 Effect of workstation reflectivity
Figure 31 shows the effect of workstation reflectivity on the predicted partition luminance from the simulations; other design parameters are as for the base case defined in Table 2. In this case the data are normalised to the value for reflectivities of 80/50/20, the basecase values.
0.0 0.1 0.2 0.3 0.4 0.5 0.6 0.7 0.8 0.9 1.0 1.1 0 10 20 30 40 50 60 WS Reflectance (%) Lpt 3 ,4 ( fr a c ti on of ba s e c a s e , 8 0 /5 0 /2 0 ) P11 P22 P32 L21 L32 L42 L53 I11 I14 I15 I22 I33 I43 I36 0.0 0.1 0.2 0.3 0.4 0.5 0.6 0.7 0.8 0.9 1.0 1.1 0 10 20 30 40 50 60 WS Reflectance (%) Lpt 3 ,4 ( fr act io n o f b as e cas e, 80 /50/ 20 )
Figure 31. The effect of workstation reflectance on normalised partition luminance for all lighting designs studied. Partition height = 64”, workstation size = 10’
x 10’, ceiling reflectivity = 80%.
Figure 32. General relationship between normalised partition luminance and workstation reflectance. Partition height =
64”, workstation size = 10’ x 10’, ceiling reflectivity = 80%.
The results show a strong trend, as the workstation (partitions and desktop) reflectance decreases, so does Lpt3,4. Since luminance for diffuse surfaces is
simply a function of the light incident on a surface and that surface’s reflectance, this strong relationship is entirely expected. There is no substantial effect of
luminaire type, and a general relationship applicable to all fixture types is shown in Figure 32. The best-fit curve has a slight quadratic component, and is forced through the point (0,0); i.e., Lpt3,4 must be zero when reflectance is zero. The
slight quadratic nature of the curve is explainable through consideration of inter-reflection effects. As reflectance increases more light leaves the target surface that could be reflected back to the target surface from other surfaces.
3.4.4 Effect of ceiling reflectivity
Figure 33 shows the effect of ceiling reflectivity on the predicted partition luminance from the simulations; other design parameters are as for the base case defined in Table 2. In this case the data are normalised to the value for reflectivities of 80/50/20, the basecase values.
0.8 0.9 1.0 1.1 1.2 1.3 60 70 80 90 100 Ceiling Reflectance (% ) L pt 3 ,4 ( fr act io n o f b ase case, 80/ 50/ 20) P11 P22 P32 L21 L32 L42 L53 I11 I14 I15 I22 I33 I43 I36 0.8 0.9 1.0 1.1 1.2 1.3 60 70 80 90 100 Ceiling Reflectance (% ) L pt 3 ,4 ( fr act io n o f b ase case, 80/ 50/ 20) direct
Figure 33. General relationship between normalised partition luminance and ceiling reflectance, by fixture type. Partition height
= 64”, workstation size = 10’ x 10’, workstation reflectivity = 50%.
Figure 34. The effect of ceiling reflectance on normalised partition luminance for all lighting designs studied. Partition height = 64”, workstation size = 10’ x 10’, workstation
reflectivity = 50%.
The results show the expected trend, as the ceiling reflectance increases, so does Lpt3,4. However, as expected, there is a strong effect of luminaire type.
Fixtures recessed in the ceiling with primarily direct delivery of light to the desktop exhibit only a small effect of ceiling reflectance. Fixtures with a substantial indirect component exhibit a strong effect. Generic relationships, presented separately for direct fixtures and fixtures with an indirect component, are shown in Figure 34.
3.5 VDT Glare Risk (VDTG)
Table 5 shows representative data for glare risk for each of the lighting designs studied. Values are the percentage of the VDT screen covered by a bright
indirect component
reflected glare image in the screen renderings shown in the Appendix. The values were derived for a single workstation and a single dither. Although we generated screen renderings for all workstation design/lighting design
combinations, we present data only for the base case workstation, because risk of glare on the computer screen (VDT) is mainly a function luminaire type.
Fixtures with prismatic lenses are the worst offenders with reflected glare on over 7% of the computer screen. Louvered fixtures reduce glare below 2% (at the expense of lower partition luminance). Indirect luminaires have the lowest potential glare, provided the reflective ceiling does not become a source of glare itself.
3.6 Effect of Ceiling Height
Simulations were run for two ceiling heights, 9’ and 8’ for each lighting design, where appropriate. All lighting designs involving suspended luminaires were excluded from the simulations with 8’ ceilings because this would require unrealistically short suspension lengths or fixtures hanging unacceptably low.
When the ceiling is lowered there are mechanisms acting to both increase and decrease illumination. For data points directly below a fixture (or close to directly below) the reduction in distance to the principal illumination source will increase illumination. For data points between luminaires, the shorter distances to luminaires is counteracted by the larger angle between the line joining the
illumination source and the data point and the normal to the illumination source. In addition, when the ceiling is lowered partitions will cause shadowing from a greater number of distant luminaires.
The net result is that when the ceiling is lowered from 9’ to 8’ (with other base case workstation parameters held constant) maximum Edesk increases and
minimum Edesk decreases, in most cases. Therefore, uniformity is also
decreased. Median Edesk changes by +3 to –18%, an increase occurring for the
partition-mounted indirect fixtures (I36), and the biggest decreases generally occurring for the designs with widely dispersed luminaires. These results are detailed in the Appendix
3.7 Effect of Storage Elements
The workstations modelled in this study did not include storage elements such as shelves, cupboards, or binder bins, which are often suspended from partitions above the desk surface. We made this choice to maintain consistency across simulations for different partition heights – the shorter partitions could not have supported storage elements, and the taller partitions would have supported them at differing heights. Nevertheless, we did conduct simulations for the basecase workstation with P11 lighting, to provide some information on the effect.
A single shelf of typical dimensions was added to one side of the workstation, as shown in Figure 35. Also shown in Figure 35 is the case with a linear fluorescent task light underneath the shelf.
Figure 35. Renderings of the right side of the desktop for lighting design P11, for no shelf, with a storage shelf, and with a storage shelf and undershelf tasklight. Partition height = 64”,
workstation size = 10’ x 10’, workstation reflectivity = 50%, ceiling reflectivity = 80%.
0.4 0.6 0.8 1.0 1.2 1.4 1.6 1.8 2.0 2.2 2.4
No shelf Shelf Shelf + Task
Ed esk (fracti on of no shel f case) 0.40 0.60 0.80 1.00 1.20 1.40 1.60 1.80 2.00 2.20 2.40 0.4 0.6 0.8 1.0 1.2 1.4 1.6 1.8 2.0 2.2 2.4
No shelf Shelf Shelf + Task
Lpt 3 ,4 ( fr act io n o f n o sh elf case) 0.40 0.60 0.80 1.00 1.20 1.40 1.60 1.80 2.00 2.20 2.40 (b) (a)
Figure 36. The effect of a shelf and an undershelf task light on desktop illuminance and partition luminance for the P11 lighting design and basecase workstation. Values are normalised to the no
shelf case; bars indicate median, vertical lines on the bars indicate the min-to-max range. Partition height = 64”, workstation size = 10’ x 10’, workstation reflectivity = 50%, ceiling