Publisher’s version / Version de l'éditeur:
International Journal of Lighting Research and Technology, 32, 4, pp. 199-212, 2001-04-01
READ THESE TERMS AND CONDITIONS CAREFULLY BEFORE USING THIS WEBSITE.
https://nrc-publications.canada.ca/eng/copyright
Vous avez des questions? Nous pouvons vous aider. Pour communiquer directement avec un auteur, consultez la première page de la revue dans laquelle son article a été publié afin de trouver ses coordonnées. Si vous n’arrivez pas à les repérer, communiquez avec nous à [email protected].
Questions? Contact the NRC Publications Archive team at
[email protected]. If you wish to email the authors directly, please see the first page of the publication for their contact information.
Archives des publications du CNRC
This publication could be one of several versions: author’s original, accepted manuscript or the publisher’s version. / La version de cette publication peut être l’une des suivantes : la version prépublication de l’auteur, la version acceptée du manuscrit ou la version de l’éditeur.
Access and use of this website and the material on it are subject to the Terms and Conditions set forth at Preferred luminous conditions in open-plan offices: research and practice recommendations
Veitch, J. A.; Newsham, G. R.
https://publications-cnrc.canada.ca/fra/droits
L’accès à ce site Web et l’utilisation de son contenu sont assujettis aux conditions présentées dans le site LISEZ CES CONDITIONS ATTENTIVEMENT AVANT D’UTILISER CE SITE WEB.
NRC Publications Record / Notice d'Archives des publications de CNRC:
https://nrc-publications.canada.ca/eng/view/object/?id=672803f7-7b32-442f-a513-8560bfae6518 https://publications-cnrc.canada.ca/fra/voir/objet/?id=672803f7-7b32-442f-a513-8560bfae6518
offices: research and practice
recommendations
Veitch, J.A.; Newsham, G.R.
A version of this paper is published in / Une version de ce document se trouve dans : International Journal of Lighting Research and Technology, v. 32, no. 4, 2000, pp.
199-212
www.nrc.ca/irc/ircpubs
© 2000, Her Majesty in right of Canada. All rights reserved. National Research Council of Canada.
Jennifer A. Veitch, Ph.D.2 and Guy R. Newsham, Ph.D.
National Research Council of Canada / Institute for Research in Construction
Citation: Veitch, J. A., & Newsham, G. R. (2000). Preferred luminous conditions in open-plan
offices: Research and practice recommendations. Lighting Research and Technology, 32, 199-212.
Summary
This paper compares research participants' office lighting choices to recommended practice and existing research, and concludes with practical recommendations for lighting installations. Participants were given the opportunity to choose lighting conditions for VDT office work as part of an experiment concerning the effects of individual control over lighting on task performance and satisfaction. Most participants' choices bettered current energy code specifications for lighting energy use, while largely following both CIBSE and IESNA recommended practice for desktop illuminance. Average luminance ratios between the VDT screen and background were lower than recommended practice but consistent with other
investigations. No effects of age or sex were observed. Participants who made lighting choices at the end of the day-long session chose conditions that created less VDT-screen glare from reflected images, as compared to those who chose lighting conditions at the start of the day. Despite a high degree of variability in the chosen luminous conditions, overall ratings of lighting quality and environmental satisfaction were high.
1
A version of this paper was presented at the 24th Session of the Commission Internationale de l'Eclairage, Warsaw, Poland, June 24-30, 1999, under the title "Preferred Luminous Conditions in Open-Plan Offices: Implications for Lighting Quality Recommendations".
2
Address for correspondence: National Research Council of Canada, Institute for Research in Construction, Bldg M-24, Montreal Road Campus, Ottawa, ON K1A 0R6 Canada. e-mail: [email protected]
List of Symbols
(Refer to Figure 3 for a graphical presentation showing the field of view.)
ED unobstructed desktop illuminance away from task lamp (lux)
ID unobstructed desktop luminance (derived from illuminance and measured
reflectance) (cd/m2)
Iave average luminance (1o squares, approx.) in 40-degree field-of-view band (cd/m2)
ID: Iave ratio of desktop to average luminance
LMM natural log of the ratio of maximum to minimum luminance in 40-deg band
VDT
IW average VDT luminance, showing Windows™ Program Manager screen (cd/m2)
VDT
IB average luminance of black VDT screen (cd/m2)
VDT
G% percentage of black VDT screen with luminance >40 cd/m2 (indicates glare spot)
VDT
GI average luminance of points in black VDT screen with luminance > 40 cd/m2, = 0
for cases with no points > 40 cd/m2 (cd/m2)
CEIL
IMAX maximum luminance in ceiling view (cd/m2)
LPD total lighting power density, including task lighting (measured) (W/m2)
Eh horizontal illuminance (lx)
Esr scalar illuminance (lx)
E:Esr vector/scalar illuminance ratio
Ecl cylindrical illuminance (lx)
Ecl:Eh cylindrical/horizontal illuminance ratio
Eeye vertical illuminance at the eye (lx)
1.0 Introduction
Lighting quality has been defined as the degree to which a lighting installation fulfils the requirements of human needs and architectural integration within its unique constraints of economics, energy consumption, maintenance and the like.(1,2) Lighting designers, and some lighting researchers, hold the implicit theory that occupant preference for luminous conditions can identify the conditions that will satisfy the human needs in the equation.(3) If this is true, then recommended practice documents should present guidelines based on knowledge about the preferred luminous conditions in a variety of settings. Information on preferred luminous conditions might also address the fear that lighting quality will inevitably decline as energy-efficiency regulations limit lighting power densities. Such information would also prove useful to researchers wishing to test the theory that certain, preferred, luminous conditions create a state of positive affect that leads to improved work performance, creativity, and social behaviour. The literature to date shows little consensus about which luminous conditions are preferred. Various investigations have attempted to determine preferred wall:ceiling luminance ratios, task:wall luminance ratios, average luminances and the like, but no consensus is apparent.(4) The answer is complicated by the high degree of individual variability in these preferences(5) and by the fact that a wide range of luminous conditions are acceptable to most people.(6) Some authors report sex differences in lighting preferences.(7) There might also be cultural variability in lighting preferences.(8) Moreover, as lighting technologies change, and occupants become more sophisticated in their tastes, lighting preferences might be expected to alter accordingly.(1)
Variability in reporting is another reason for the lack of consensus about preferred luminous conditions. It is difficult, often impossible, to compare preferred luminous conditions across research reports because each study reports these conditions in a different way, often with insufficient detail.(9) For example, some authors report desktop illuminance in one location, whereas others report luminance across a zone of the field of view. Incomplete information about surface reflectances makes conversion from luminance to illuminance impossible. Classification of lighting schemes as good, indifferent, or bad, as Boyce(1) has advocated, is impossible without a common set of criteria by which to describe and to judge them. Poor or variable reporting also makes it more difficult to apply research results into a common set of recommended practice documents. Consequently, these documents bear only vague connections to the empirical literature.(10,11)
A recent experiment at the National Research Council of Canada provided an opportunity to collect descriptive data about preferred luminous conditions in open-plan offices with VDTs. The principal hypothesis of the experiment concerned the effects of individual control over lighting on performance and satisfaction; detailed results concerning this hypothesis are reported elsewhere.(12,13) This paper compares the lighting preferences to existing data and to the relevant current codes and standards. The comparison leads to recommendations for lighting practice as well as to directions for future research.
2.0 Method 2.1 Setting
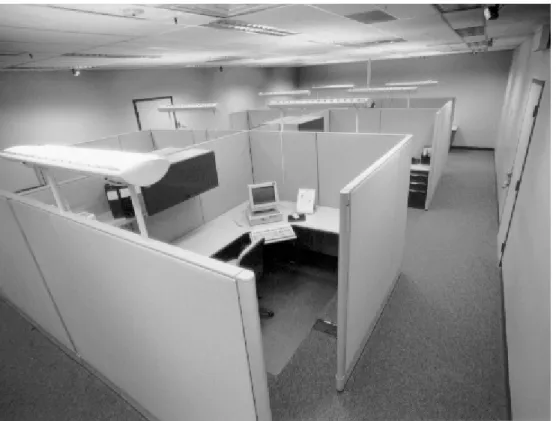
The investigation took place in a windowless, 83 m2 (880 ft2), open-plan office space containing six workstations (two rows of three), each 6 m2 (65 ft2) defined by 1.67 m (66 in) partitions, each equipped with a personal computer. The furniture layout is typical of North American mid-level office accommodation. Figure 1 is a photograph of the space and Table 1 describes the room surfaces and reflectances.
The facility was outfitted with three lighting circuits providing ambient illumination, all
dimmable. Figure 2 and Table 2 provide details about the layout and equipment: (1) two rows of five recessed 1' x 4' parabolic-louvered luminaires along the centre of the long axis of the space (directly over the workstations); (2) two rows of five recessed 1' x 4' parabolic-louvered luminaires on the outside of the space (over the corridor area); (3) a set of eight furniture-mounted indirect luminaires on the partitions. The investigation occurred in the two central workstations, which were also outfitted with one, non-dimmable, undershelf task light (4) covering part of the desk area. All ballasts were electronic, and all lamps were 3500K and 80 CRI.
2.2 Participants and Procedure
Data from 42 men and 52 women are reported in this paper. They participated in age-and sex-matched pairs, with each pair participating in a one-day session. The age range was 18-58 years. There were 120 participants (60 pairs) in total, but data from 26 people were excluded because one or both participants in the pair did not meet the screening criteria for either English language skills or age-matching. In 11 pairs, examination of the performance data and comments from the
experimenter gave clear indications that one or both individuals had insufficient English skills to have fully understood the instructions or the tasks; in two pairs, the age difference between individuals was greater than 5 years. Full details of the procedure used to make these decisions are provided in reference 12.
One member of the pair (designated LC, for 'Lighting Control') was given the opportunity to select the lighting settings under which both would work for the day (the controls were configured to provide symmetrical lighting choices in the two occupied workstations). The controls offered the opportunity to turn the task light on or off and to dim each of the three ambient systems up or down as they wished. Once selected, these conditions were fixed for the day. The second participant (designated NC, for 'No Control') was unaware that LC had chosen the lighting settings, but worked all day under the same lighting conditions as LC. At the end of the workday, NC was offered the opportunity to demonstrate the lighting conditions that he or she would have wanted to work under. In both cases, the starting conditions for their choices were intermediate settings of the three dimmable circuits, and task lights on (Table 3).
2.2.1 Participant ratings and preferences. In this paper, only general lighting preferences and
ratings of satisfaction are considered (for results concerning task performance and other
variables, see ref. 13). These questionnaires were completed towards the end of the session, but before participants knew the purpose of the experiment. The lighting satisfaction measures consisted of ten questions about the quality of the lighting, which were combined to give separate ratings of lighting quality and bothersome glare. There was also a four-item scale registering overall environmental satisfaction. There were eleven questions concerning general lighting preferences.
2.2.2 Photometric data. The photometric analysis included measurements taken during the
session and detailed measurements taken on a subsequent day. The delayed measurements employed a feature of the lighting control system that saves settings as separate scenes for later recall. Data collected during the session included:
• illuminances at fixture output for the three ambient systems, from sensors permanently fixed to selected luminaires;
• manual recording of task lamp status;
• measured power for lighting, including task lighting.
On a later date, each participant's lighting choices were recalled and the following data collected: • spot illuminance on the desktop both left and right of the computer monitor;
• illuminances at the location of the head of a seated person (top, forward, left, right, and back). These were used to derive six cubic illuminance values [as described by Cuttle(14)]: horizontal illuminance, scalar illuminance, cylindrical illuminance, the vector:scalar ratio, the cylindrical:horizontal ratio, and the vertical illuminance at the eye. These indicators have been proposed as meaningful predictors of interior lighting effects.
• CapCalc digital images(15) of the entire workstation. The workstation images were used to derive field-of-view luminance values based on Loe et al, (16) using an averaging procedure to convert from luminance values based on individual pixels to values based on an approximate 1o spot size. Figure 3 displays a photograph of the field of view and a line diagram showing the derivation of key values.
• CapCalc digital images of the VDT screen alone. Visual inspection of CapCalc images of the VDT screen suggested that a threshold of 40 cd/m2 defined the spatial extent of a glare source. Accordingly, any area of the screen with a luminance greater than 40 cd/m2 was deemed to be glare. The weighted average luminance of these glare spots on each image (VDTGI) was
calculated using linear interpolation from binned luminance frequency data (the bins were 10 cd/m2 wide). If there were no luminance values greater than 40 for a given image, the value for that image was 0. Another measure of glare was the area of the screen occupied by reflected images (VDTG%): this is the proportion of raw pixels with luminance > 40 cd/m2. We also
recorded the average luminance of the VDT screen when black (VDTIB) and when showing the
Windows™ Program Manager screen (VDTIW). These measurements also used the 1o array
procedure.
3.0 Results and Discussion
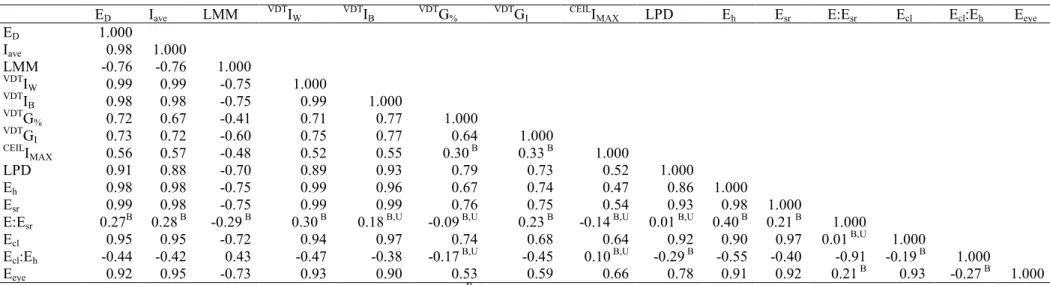
The photometric data in any scene describe simultaneously-occurring luminous conditions; i.e., the measurements reported here are all descriptors of different aspects of one scene. Fourteen indicators of luminous conditions, plus lighting power density, were chosen as dependent
variables describing participants' lighting choices. The choices were based on the values used in recommended practice documents, other investigations, and on the authors' experience in
lighting quality research. The goal was to fully describe the luminous conditions selected by each participant, using those variables thought most likely to have influenced their choices. The photometric variables are highly intercorrelated (Table 4), as one would expect for a set of measurements of simultaneous luminous conditions in a scene. The table shows the correlation matrix for the 15 variables. Superscripts identify those values that are not statistically significant correlations. All correlation coefficients in this matrix without a superscript U reach statistical signficance (p<.05) by uncorrected probability testing. The superscript B denotes those that fail to reach statistical significance by the conservative Bonferroni correction. Even by this more difficult test, the majority of these variables are significantly correlated.
High intercorrelations are problematic because they complicate (and can prevent) the use of these variables as predictors in multivariate analyses such as linear regression, canonical correlation, and factor analysis. Some authors have addressed this problem by selecting variables with low intercorrelations for reporting, or by choosing one from a pair of highly correlated variables.(17) This procedure avoids the problem of conclusions that are not
independent. However, it can lead to differences in reported photometric conditions that make cross-comparisons difficult or impossible because each researcher is free to make a different choice. Moreover, the degree of intercorrelation between variables is somewhat a function of the specific geometry of the space, the lighting systems, and of the specific measurement protocol. A standard protocol for the photometry of luminous conditions in realistic situations (one
protocol for both laboratory and field settings) would lead to the development of data sets that could be compared for the purpose of advancing research into the effects of luminous conditions on behavioural outcomes,(1,9) and for the purpose of developing recommended practice
documents that set out photometric conditions for good-quality lighting in meaningful terms. In the absence of such agreement the authors have attempted to provide a comprehensive
description, despite the intercorrelations between luminous conditions and the redundancy between certain measurements. (In a development subsequent to the investigation reported in this paper, CIE formed a technical committee (CIE TC 3-34, Protocols for Describing Lighting) to develop such protocols. The first author chairs the committee, which should complete its report in June, 2001.)
3.1 Participants' Lighting Choices
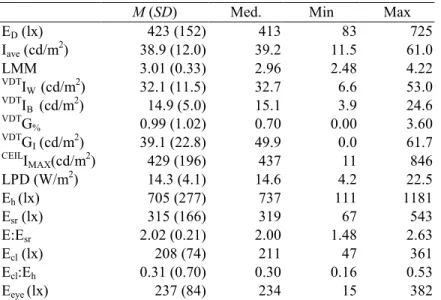
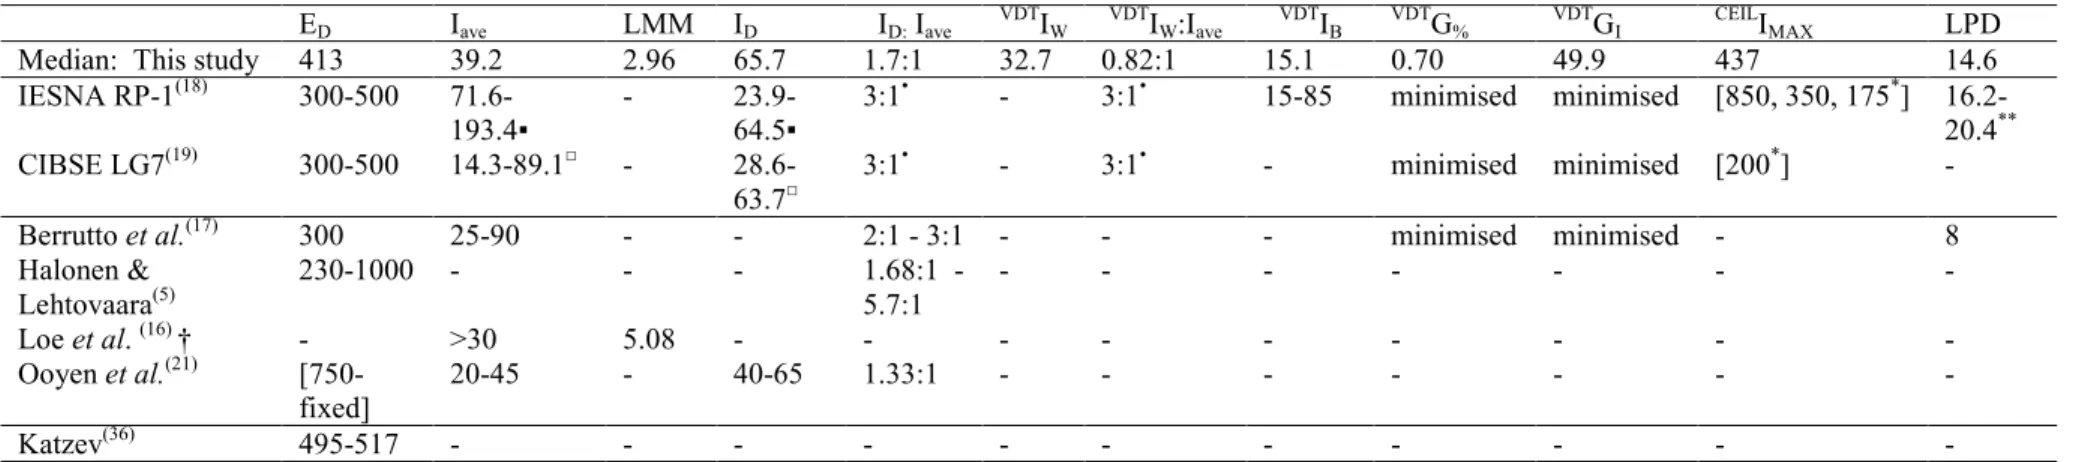
Table 5 displays the descriptive statistics for the 15 indicators of the luminous conditions reporting the mean, standard deviation, median, maximum and minimum values for all 94 participants. These values define both the boundaries and the central tendencies of preferred luminous conditions (i.e., this table combines the choices of LC and NC participants; between-group differences are discussed below). Table 6 compares these data to two recommended practice documents [IESNA RP-1(18) and CIBSE LG7(19)], and to selected empirical
investigations.3 Investigations were included in the table if they were relevant to offices where VDT work is undertaken (this effectively removed work prior to 1985), if the participants were naive (not lighting experts), and if the relevant photometruc values were published or could be inferred from the publication. Previous work in the same space was excluded to ensure
independent comparisons.(20)
3.1.1 Desktop illuminance. Luminous conditions in this investigation demonstrate wide
individual variability. Desktop illuminance, for instance, varied from 83-725 lx. Figure 4(A) shows the frequency distribution of this variable. The upper limit of IESNA RP-1 recommended illuminance (500 lx) is marked for reference. Over 60% of participants chose illuminance levels lower than 500 lx, which is in keeping with the results of other investigations.
Preferred desktop luminance (ID) was calculated from the illuminance and reflectance data.
Expressed in these terms, these participants' preferences fall at the high end of recommended desktop luminances for both CIBSE and IESNA, and that observed by Ooyen et al.(21) (Table 6). Ooyen et al., however, had fixed desktop illuminance at a higher level (750 lx) than was possible in this experiment, and varied desktop luminance by changing the reflectance.
3.1.2. Lighting power density. Mean lighting power density was 14.3 W/m2 (SD=4.1), which is notable for being lower than present-day North American energy code maximum prescriptions for offices of 16.2 - 20.4 W/m2 (22,23) and well below the maximum possible load for this set of lighting systems (22.0 W/m2). As illustrated in Figure 4(B), a large majority of the lighting choices would meet, or improve upon, current energy code restrictions for lighting.
3
Cross-cultural differences in lighting preferences are known to exist(8), but common practice among lighting researchers is to pay scant attention to these differences. We included a range of cultures in the data presented in Table 6. However, we identified no investigations from places other than North America or Europe that met our selection criteria, and decided that the data are inadequate for a thorough discussion here of this issue.
3.1.3. Luminances in the field of view. Two dimensions of the field of view are widely
considered to be important to lighting quality assessments: the average luminance in the field of view, and the variability of luminances in the field of view. Loe et al., for example, related the former to judgements of lightness and the latter to judgements of interest.(16) This report includes the two measures they proposed and also more conventional luminance ratios for task and near surround; in this case, desk-to-partition and VDT-to-partition ratios, for comparison with codes and standards. (Our setting did not permit examination of long-distance luminance ratios. The high partitions effectively cut off any view of the walls.)
However, the conventional luminance ratios have several known weaknesses, notably their weak link to empirical support(10,17) and the high degree of dependence on the photometric technique of the researcher and on the spot size of the photometer.(24)
The average luminance in the field of view was highly variable, ranging from 11.5 to 61.0 cd/m2 [see Figure 4(C)]. The median value, 39.2 cd/m2, falls within the range of recommended
luminances extrapolated from CIBSE LG7, but is lower than the levels suggested by IESNA RP-1. (In both cases, luminances were calculated from horizontal illuminance,
illuminance/luminance ratios and desired surface reflectances.) When one examines the empirical evidence, one sees further consistency with European findings.
Few investigators have yet taken up Loe et al.'s (16) suggestion that interest in the scene relates to the log ratio of maximum to minimum luminance in the field of view. The higher this value, the greater the range of luminances in the field of view. The range of this value for our 94
participants, from 2.48 to 4.22, is lower than the value of the most interesting scene studied by Loe et al. (5.08), but is approximately equal to the level (LMM=2.99) at which the
interestingness ratings levelled off.(16)
Our luminance variability findings suggest two things. First, the most preferred luminous conditions for office work might not create the most interesting scene. Our median LMM score (2.96) was far below the score for the most interesting scene of the set studied by Loe et al.(16) Interest in the visual scene is not the principal issue in selecting lighting conditions for office work. Studies including measures of preference and interest are needed to resolve this question. Second, the degree of desirable luminance variation might be greater than current
recommendations. Both IESNA and CIBSE say only that luminance ratios higher than 10:1 are needed to achieve dramatic effects, such as to highlight an architectural feature or to add interest to the space; more generally, both documents appear to regard 10:1 as an upper limit of
variability. In the present study, participants' maximum:minimum luminance ratios in the 40-degree band range from 11:1 through 68:1. Loe et al. found that interestingness ratings levelled off around 20:1 (LMM=2.99).(16)
Answers to both issues will require agreement on a practical metric and a standard procedure for measuring luminance variation over the field of view. Luminance ratios are highly dependent on the measurement technique used, which can lead, either by accident or by design, to the inclusion or exclusion of any point the observer chooses. Resolution of the issue should also take into account the size, visual dominance, and meaning of areas of extreme luminance (e.g., a small area of very high luminance might be acceptable if it highlights an interesting feature but the
same luminance might be unacceptable over a larger area, or in a different part of the visual field).
More traditional indices of luminance variability are luminance ratios between task and background areas. The desk-to-partition luminance ratios chosen by these participants reveal somewhat lower variability than the outside limits set by current codes and standards. The median preferred desk-to-partition luminance ratio (for this study, calculated using ID: Iave), 1.7:1,
is lower than the 3:1 ratio limit set by IESNA and CIBSE, but similar to the other observations.(5,17) The VDT-to-partition ratio is even smaller, 0.82:1 (note that this VDT luminance was measured with the default Windows™ version 3.11 Program Manager screen active). The median VDT screen luminance in this condition was 32.7 cd/m2, against the partitions with median luminance 39.2 cd/m2. One explanation for this pattern of luminances might be that participants sought to minimise the difference between the VDT screen luminance and the partitions, to avoid creating the effect of a bright luminous object against a dark field. That is, the recommended ratio might be too high for a VDT environment using a colour display with dark characters on a light background.
3.1.4 Direct and reflected glare. The maximum ceiling luminance, measured from CapCalc
images, was selected as the indicator of direct glare for this study. The method of measurement did not permit calculating glare indices for the ceiling conditions, because the camera geometry differed from the angle of view of a seated occupant. The maximum as seen by the camera might have differed from that seen by the seated occupant. In any case these indices are not derived from discomfort data arising from non-uniform sources. The predictive metrics for discomfort glare overestimate discomfort associated with non-uniform luminance patterns.(25) The median value of the maximum ceiling luminance, 437 cd/m2, includes lamp luminance (if any were visible). This value is not directly comparable to either the IESNA or CIBSE
guidelines, which limit the average ceiling luminance without lamp luminance4. However, logic suggests that direct glare was not a problem, given that the luminaires were designed to conform to IESNA RP-1 criteria and were generally run at dimmer levels below the maximum.
Regarding reflected glare problems, recommended practice guides at present state only that reflected images in VDT screens should be minimised. There are no set values for the permissible limits. In the present study, the preferred luminous conditions resulted in a small degree of image loss in the VDT screen as a result of reflected images (range 0-3.6 % of screen; Table 5). The median screen luminance of a black screen (an indicator of veiling luminances) in this experiment (15.1 cd/m2) is at the lower limit of screen luminances, according to IESNA RP-1. Overall, these participants chose conditions that resulted in relatively good screen conditions (but see below, in relation to morning and afternoon lighting choices).
4
RP-1 acknowledges that maximum luminance is probably a better predictor of problems associated with reflected glare, but sets no limits because there is no agreed-upon method for measuring luminaire maximum luminance.(18) Ashdown has argued that with present-day digital image analysis, maximum luminance and the projected area of maximum luminance at that angle are easily measured for any angle of sight using existing far-field
goniophotometers.(26) This is true, but to relate maximum luminance to the experience of discomfort or other behavioural outcomes will require protocols for near-field measurements of maximum luminance. These should be assessed for lines of sight approximating real viewing conditions.
3.1.5 Derived illuminance metrics. The derived illuminance measures, calculated from cubic
illuminance measurements, are as yet rarely specified in office lighting design. Recommended practice documents do not set limits or targets for these values, and researchers rarely report them; consequently, they are not included in Table 6 although we reported them for our sample in Table 5. As Table 4 illustrates, some of these values correlate highly with derived luminance measurements, which suggests that the illuminance measures are worthy of further attention. Derived luminance measurements requiring digital image analysis are both expensive and technically complex, whereas cubic illuminance measurements are easily obtained with
commonly-available equipment and algebraic calculation.(14) Derived illuminance measurements might be a practical alternative for specifying desirable luminous conditions, for example in recommended practice documents.
3.1.6 Morning versus afternoon choices. As described above, these luminance choices were
made by two experimental groups. One group, LC, set their lighting choices in the morning; the NC group did so at the end of an all-day experimental session. The lighting choices of these two groups were compared using MANOVA, with 15 photometric dependent variables. The overall MANOVA did not reach statistical significance (Wilks' Λ=0.798, F(15,78)=1.32, n.s.).
Standard practice in this laboratory is not to interpret univariate tests if the multivariate test is not statistically significant. However, an earlier analysis using a subset of the dependent variables gave reason to examine the univariate tests in this case. The initial test was a between-groups MANOVA with six dependent variables, chosen as indicators of what were believed to be the most salient and least redundant aspects of the lighting choices (ED, Iave, LMM, CEILIMAX,,VDTGI,
and LPD). It revealed a significant multivariate effect accompanied by significant univariate tests for VDTGI and LPD.(13) NC participants' lighting choices had lower average luminance of
reflected images in the VDT screen and lower LPD. In a separate MANOVA on the degree of use of the three dimmable systems, again there was a statistically significant multivariate effect accompanied by a statistically significant univariate test for the perimeter parabolic system.(13) NC participants made less use of this system than LC participants. Moreover, LC participants commented in an exit questionnaire that had they been permitted to change the lighting settings during the day, they would have done so; some of these participants specified that they would have dimmed the perimeter parabolic system. This consistent pattern of results was interpreted as evidence that participants learned through their day's experience how to ameliorate imperfect aspects of their lighting situations. (13)
Although the MANOVA test for the 15 dependent variables was not statistically significant, we further examined the univariate tests to determine whether or not the initial pattern of outcomes was maintained with the addition of nine dependent variables. In addition to the two significant univariate tests reported earlier above, two more univariate tests were statistically significant. These were for the size of reflected image glare on the VDT (VDTG%) and the cylindrical
illuminance (Ecl). The pattern was maintained: in both cases, the NC participants chose levels
lower than the LC participants (Table 7).
3.1.7 Age and sex effects. Separate multivariate analyses of variance (MANOVA) on the
photometric data examined the possibility of age and sex differences. For the age model, participants were grouped into three age categories (<30, 30-39, and >40) and examined two non-orthogonal planned comparisons (linear effects with age, and differences between those
under and over 40). There were no significant multivariate differences in either analysis;
therefore, no univariate effects were interpreted (of which there were two in the thirty univariate tests of age effects, and none for sex). Age and sex did not influence lighting choices in this investigation.
The absence of sex and age differences is generally consistent with the literature. A thorough review could locate no study that reported age differences in lighting preferences across the range studied here. Both Berrutto et al. (17) and Boyce(27) looked for, but did not find, age differences in preferred luminous conditions. Veitch and Newsham(20) did not observe sex differences in environmental satisfaction or lighting quality. Leslie and Hartleb(7) reported sex differences in preferred illuminance levels, but their sample included 23 men and only six women (the unequal sample size throws the significance test into question and also risks the possibility that the small sample of women were not as representative of the population as the larger sample of men). Knez(28) and Knez and Enmarker (29) reported Sex X Lamp Type
interaction effects on measures of affect (men and women had different mood responses to cool-white versus warm-cool-white fluorescent lighting), but these effects were in opposite directions in the two studies. Taken as a whole, the literature does not provide firm support for the notion that age or sex influences preferred luminous conditions for office work.
3.1.7 Direct versus indirect lighting. We examined our participants' choices in terms of their
relative use of direct and indirect sources. The data included the fraction of maximum output for the three dimmable circuits, and the task light status, for each participant's lighting choices. A multiple regression of the unobstructed desktop illuminance on these four variables obtained the following equation. The intercept was set at 0, given that with all circuits at zero output (in a windowless space), desktop illuminance would be zero. Data from all 120 participants in the experiment were included because there was no reason to believe that participant characteristics would have corrupted the relationship between desktop illuminance and lighting circuit state (even though their characteristics might have altered the choices themselves).
ED=0 + 325.6 * C1 + 132.7 * C2 + 240.8 * C3 + 20.6 * C4 [R2=0.974, N=120].
C1: centre parabolic louvered luminaires, fraction of maximum output C2: perimeter parabolic louvered luminaires, fraction of maximum output C3: indirect partition-mounted luminaires, fraction of maximum output C4: undershelf task lamp, on/off
Because each lighting circuit delivered illuminance to the desktop (virtually) independent of the other circuits, the regression coefficients represent the illuminance in lux contributed by the associated circuit when set to maximum output. For example, the perimeter parabolic luminaires contribute 132.7 lux when set to maximum. This interpretation was confirmed by additional post-hoc physical measurements.
The equation was used to calculate the contribution to ED of each ambient system for each
individual, then combined the contributions of C1 and C2 to give a total for direct illumination (C3 alone describes the indirect contribution). The descriptive statistics for the overall use of direct and indirect illumination are shown in Table 8, along with a third variable that is the difference between them. This variable was used to conduct tests for between-group, age, and
sex effects on the proportions of direct and indirect illumination (88% of participants used the task light, which was judged high enough not to warrant further analysis of its use). None of these tests were statistically significant. Although the NC participants made less use of the perimeter parabolic luminaires(13), it did not result in an overall change in the relative proportions of direct and indirect illumination. The median participant chose approximately 41% indirect and 55% direct ambient illumination, with the remainder contributed by the task lamp.
3.2 Participant Ratings and Preferences
3.2.1 Satisfaction measures. Participants rated their satisfaction with luminous conditions in the
late afternoon of the experimental session. The conditions they rated were only those chosen by the LC participants, whose lighting choices set the conditions for the entire working day. These
results are summarized in Table 9. Veitch and Newsham(13) conducted a MANOVA analysis of
the three ratings -- lighting quality, bothersome glare, and overall environmental satisfaction -- in relation to the experimental groups. LC and NC participants did not differ in their satisfaction with the lighting (despite the fact that NC participants were rating conditions they had not chosen). There were no age or sex differences in any of the satisfaction ratings.
The ratings of lighting quality were very high (overall median 4.1 on a scale from 1-5, where higher values reflect better quality), as were the environmental satisfaction ratings (median 3 on a scale 0-4). Ratings of bothersome glare were low (median 1.8 on a scale 1-5). This finding was surprising given both the LC participants' exit questionnaires and the NC participants' low-glare lighting choices; however, it confirmed the impression that direct low-glare was not
problematic. This high overall satisfaction with such diverse luminous conditions further confirms Boyce's observation that a wide range of conditions can satisfy people.(1)
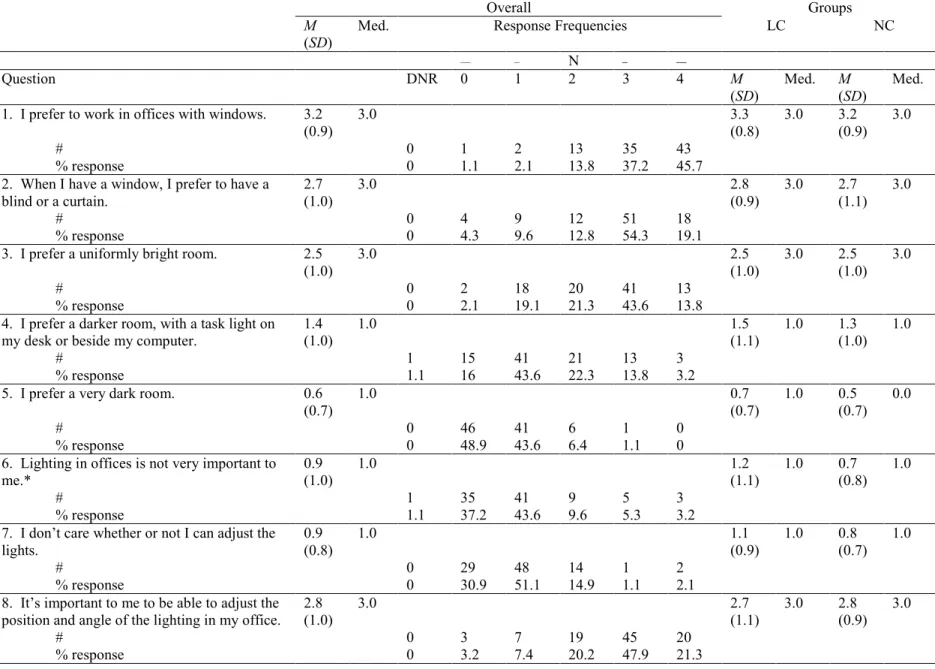
3.2.2 General lighting preferences. As part of the experimental session, participants completed
a questionnaire concerning their general lighting preferences. This set of 11 items was rated on a scale from 0-4, and is reproduced in Table 10. The responses from LC and NC participants were analysed as one group on the basis of MANOVA results indicating no systematic differences. 5 Participants reported a strong preference for having a window, and generally would want a blind or curtain on the window (items 1 and 2). Window preferences are well-known.(30,31) Over 50%, however, also wanted electric lighting to supplement natural daylight (item 9).
The majority of participants reported a preference for a uniformly bright room to work in (57.4% reporting scores of 3 or 4, item 3). Only 17 % reported a preference for dark ambient levels and task lighting (item 4). Even fewer (7.5 %) reported a preference for working in a dark room (item 5). The fact that any participant reported this preference might come as a surprise to some
5
MANOVA analysis of responses to the 11 items by experimental group revealed a significant multivariate effect (Wilks' Λ = 0.783 F(11,79)= 1.99, p<.05, R2ave=2.2%), accompanied by two significant univariate tests. Participants
in the NC group reported that lighting was more important to them, and LC participants reported a stronger desire to be able to adjust lighting during the workday. Both effects are artifacts. The latter effect is an artifact of the experimental manipulation (LC participants were aware that the control they had had in the morning was not given to them in the remainder of the day, whereas NC participants were unaware at that point that lighting controls could have been made available). The former effect, ratings of lighting importance, is an artifact of the skewness in the data. A small number of individuals in the LC group indicated agreement with the statement (i.e., that lighting was not important to them), but the median scores for both groups was 1.
practitioners, whose credo has been summarised as "light the walls, hide the sources, don't cause glare" (M. Kohn, IESNA National Capital Region Office Lighting Seminar, May 3, 1996,
Ottawa, Canada.). The finding reminds us that although bright surfaces are widely preferred, the preference is not universal.
Indirect lighting was desired by 46.8% of participants in this study. Unfortunately, the question did not specify whether this was to be provided alone or in combination with direct illumination, so a comparison between this item and the actual lighting system choices is impossible.
A large majority of participants reported that lighting in their offices is important to them (item 6), a finding consistent with previous surveys. (32) The ability to control office lighting is also important to most participants: 81 % reported wanting to adjust the lights, 69.2 % reported wanting to change position or angle of lights, and 78.5 % wanted to be able to turn lights on or off during the workday (items 7,8, and 11). The percentages not wanting these choices ranged from 3-7 %. Veitch et al.also reported a strong desire for control over lighting in office-like settings. (32)
3.3 Future Research Directions
The development of a common protocol for applied photometry in field and laboratory settings should be a high priority for the lighting community. Without standards for describing the luminous conditions in an experiment or a survey, it is impossible either to compare results or to develop a meaningful, empirically-based set of recommended practices. Such protocols should address the following issues:
• the need for specificity of definitions and techniques;
• the relation to criteria used in recommended practice documents;
• the high degree of intercorrelation between luminous conditions in a scene; • the high error rate intrinsic in applied photometry; and,
• the need for practical, affordable measurements for lighting practitioners (e.g., by using derived illuminance measurements in place of (or in parallel to) luminance and luminance ratios for the visual field).
If lighting quality recommendations are to be based on empirical evidence about the effects of luminous conditions on behavioural outcomes, as has been suggested,(9) then experimental and quasi-experimental work is needed to identify the luminous conditions that are the strongest predictors of outcomes generally deemed to be important. For example, Lloyd et al. presented a model of disturbance associated with reflected images in VDT screens, in which 85% of the variance in disturbance ratings was predicted by the modulation of the displayed image, the modulation of the glare source image, and the width of the reflected image of a standard glare source. (33) The terms in the model are obtainable using seven measurements that require only standard luminance and illuminance meters and a mirror. Once the important predictors are identified by such models, further research can focus on the limits of acceptability for these
photometric quantities.
3.4 Lighting Quality Recommendations
Perhaps the most encouraging result of this investigation is the evidence that participants, using off-the-shelf present-day equipment for VDT offices, spontaneously chose luminous conditions well within current energy code limits for office lighting, and furthermore that their lighting choices resulted in high ratings of satisfaction with the lighting. The findings also suggest a caveat: The achievement of proposed further reductions in allowable lighting power densities probably will require further improvements in lighting system energy efficiency, and should not rely on changes in lighting design that could result in unacceptable luminance patterns. In this data set, only a small percentage of participants chose luminous conditions resulting in very low LPD values (< 10 W/m2) and low desktop illuminance.
Good-quality lighting encompasses more than only occupant satisfaction,(2) but we can take steps forward by improving our understanding of preferences for luminous conditions. This
investigation has identified certain conditions as being likely to satisfy most occupants, which the authors present here to stimulate independent replication and validation in a variety of spaces and with a variety of lighting designs and equipment.
First among these is the opportunity to adjust or change the lighting at will to suit individual preferences, using controls that permit the creation of luminous conditions across the range of preferences. This would allow individuals with minority preferences to obtain or approximate their desired conditions. However, this is a costly alternative; therefore, the following
recommendations are presented as being likely to satisfy most occupants.
• A mixture of direct and indirect ambient lighting, with approximately 40% being indirect. • Desktop illuminances in the range specified by current recommended practice for VDT office lighting, although some individuals have higher preferences (and the possible range in this
experiment was as high as 725 lx).
• A moderate degree of interest, represented by maximum to minimum luminance ratios in the visual field (40-degree band) on the order of 20:1 [LMM≈3].
• Ratios of average luminance between VDT and vertical surfaces in the visual field that are rather uniform, when VDT screens with light backgrounds are used.
• Very low or no reflected luminaire images in VDT screens, despite the use of light-background screens.
• A window, preferably with a blind.
4.0 Conclusions
Members of the lighting community have asked the rhetorical question, "Does lighting quality really matter?", noting that some people are oblivious to the lighting conditions around them provided they are above some minimum level.(1,34) This might be true, particularly at the level of
justifying more costly lighting choices. However, the high percentage of disagreement with the statement that "The lighting in an office is not important to me" suggests that lighting does matter to the ordinary occupant, at least at the most simple level. The problem remains that we are only slowly identifying the lighting conditions that would satisfy most people, a problem that is further complicated by the fact that preferred conditions vary widely from one individual to another.
Acknowledgements
The preparation of this paper was supported by the Canadian Electrical Association (Agreement No. 9433 U 1059), Natural Resources Canada, the Panel on Energy Research and Development, and the National Research Council of Canada (NRC), as part of the NRC project “Experimental Investigations of Lighting Quality, Preferences, and Control Effects on Task Performance and Energy Efficiency” (A3546). Lighting equipment used in this experiment was donated by CANLYTE Inc., General Electric Co., Ledalite Architectural Products Inc., Litecontrol Corp., Luxo Lamp Ltd., Osram-Sylvania Inc., Peerless Lighting Ltd, and Philips Lighting. We are grateful to Jana Svec and Steffan Jones for their work as experimenters; Ralston Jaekel, Marcel Brouzes, and Roger Marchand for technical assistance; Vilayvanh Sengsouvanh for conducting pilot tests; Steffan Jones and Jennifer Roberts for data management; Dale Tiller and Terry McGowan for advice; and, Sherif Barakat for moral and financial support.
References
1 Boyce P R Lighting quality: The unanswered questions In J A Veitch (Ed) Proceedings of
the First CIE Symposium on Lighting Quality CIE x015-1998 (pp 72-84) (Vienna Austria:
Commission Internationale de l'Eclairage) (1998)
2 Veitch J A Julian W and Slater A I A framework for understanding and promoting
lighting quality In J A Veitch (Ed) Proceedings of the First CIE Symposium on Lighting
Quality CIE-x015-1998 pp 237-241 (Vienna Austria: CIE Central Bureau) (1998)
3 Baron R A Rea M S and Daniels S G Effects of indoor lighting (illuminance and spectral
distribution) on the performance of cognitive tasks and interpersonal behaviors: The potential mediating role of positive affect Motivation and Emotion 16 1-33 (1992)
4 Veitch J A and Newsham G R Determinants of lighting quality II: Research and
recommendations Paper presented at the 104th Annual Convention of the American
Psychological Association Toronto Ontario Canada (ERIC Document Reproduction
Service No ED408543) (1996a August)
5 Halonen L and Lehtovaara J Need of individual control to improve daylight utilization and
user's satisfaction in integrated lighting systems Proceedings of the 23rd Session of the
Commission Internationale de l’Éclairage New Delhi India November 1-8 1995 Vol 1 pp
200-203 (Vienna Austria: CIE Central Bureau) (1995 November)
6 Collins B L Fisher W S Gillette G L and Marans R W Second level post-occupancy
7 Leslie R P and Hartleb S B Human response and variability in the luminous environment
Proceedings of the CIBSE National Lighting Conference Cambridge England 8-11 April 1990 pp 87-99 (London UK: CIBSE) (1990 April)
8 Veitch J A and Newsham G R Experts’ quantitative and qualitative assessments of
lighting quality Proceedings of the 1996 Annual Conference of the Illuminating
Engineering Society of North America Cleveland OH August 5-7 1996 pp 504-518
(August 1996)
9 Veitch J A and Newsham G R Determinants of lighting quality I: State of the science
Journal of the Illuminating Engineering Society 27(1) 92-106 (1998a)
10 Boyce P R Lighting research and lighting design: Bridging the gap Lighting Design and
Application 17(5) pp 10-12 50-51; and 17(6) pp 38-44 (1987 May and June)
11 Boyce P R Illuminance selection based on visual performance - and other fairy stories
Journal of the Illuminating Engineering Society 25(2) 41-49 (1996)
12 Veitch J A and Newsham G R Experimental investigations of lighting quality preferences
and control effects on task performance and energy efficiency : Experiment 2 primary analyses -- Final report IRC Internal Report No 767/Client Report No A3546.5 (Ottawa
ON: National Research Council Canada / Institute for Research in Construction) (1998b) 13 Veitch J A and Newsham G R Exercised control, lighting choices, and energy use: An office
simulation experiment Journal of Environmental Psychology 20 219-237 (2000)
14 Cuttle C Cubic illumination Lighting Research and Technology 29(1) 1-14 (1997)
15 Rea MS and Jeffrey I G A new luminance and image analysis system for lighting and
vision I equipment and calibration Journal of the Illuminating Engineering Society 19(1) 64-72 (1990)
16 Loe D L Mansfield K P and Rowlands E Appearance of lit environment and its relevance
in lighting design: Experimental study Lighting Research and Technology 26 119-133 (1994)
17 Berrutto V Fontoynont M and Avouac-Bastie P Importance of wall luminance on users'
satisfaction: pilot study on 73 office workers Proceedings of the 8th European Lighting
Conference Lux Europa 1997 Amsterdam the Netherlands 11-14 May 1997 pp 82-101
(1997)
18 Illuminating Engineering Society of North America (IESNA) American national standard
practice for office lighting (ANSI/IESNA-RP-1-1993) (New York NY: IESNA) (1993)
19 Chartered Institution of Building Services Engineers (CIBSE) Lighting for offices
Lighting Guide LG7: 1993 (London UK: CIBSE) (1993)
20 Veitch J A and Newsham G R Lighting quality and energy-efficiency effects on task
performance mood health satisfaction and comfort Journal of the Illuminating
Engineering Society 27(1) 107-129 (1998)
21 Ooyen M H F van Weijgert J C A van de and Begemann S H A Preferred luminances in
offices Journal of the Illuminating Engineering Society 16(2) 152-156 (1987)
22 American Society of Heating Refrigeration and Air Conditioning Engineers/Illuminating
Engineering Society of North America Energy efficient design of new buildings except
new low-rise residential buildings ASHRAE/IESNA Standard 90.1 (Atlanta: American
Society of Heating Refrigeration and Air Conditioning Engineers) (1989)
23 Canadian Commission on Building and Fire Codes Model National Energy Code for
24 Nakamura Y Toward effective use of luminance in lighting design Proceedings of the
23rd Session of the Commission Internationale de l’Éclairage New Delhi India November 1-8 1995 Vol 1 pp 262-263 (Vienna Austria: CIE Central Bureau) (1995 November)
25 Waters C E Mistrick R G and Bernecker C A Discomfort glare from sources of
nonuniform luminance Journal of the Illuminating Engineering Society 24(2) 73-85 (1995)
26 Ashdown I Luminance gradients: Photometric analysis and perceptual reproduction
Journal of the Illuminating Engineering Society 25(1) 69-82 (1996)
27 Boyce P R Age illuminance visual performance and preference Lighting Research and
Technology 5 125-140 (1973)
28 Knez I Effects of indoor lighting on mood and cognition Journal of Environmental
Psychology 15(1) 39-51 (1995)
29 Knez I and Enmarker I Effects of office lighting on mood and cognitive performance and
a gender effect in work-related judgment Environment and Behavior 30 553-567 (1998)
30 Collins B L Windows and people: A literature survey NBS Building Science Series 70
(Washington DC: US Government Printing Office) (1975)
31 Heerwagen J H and Heerwagen D R Lighting and psychological comfort Lighting Design
+ Application 16(4) pp 47-51 (1986 April)
32 Veitch J A Hine D W and Gifford R End users' knowledge beliefs and preferences for
lighting Journal of Interior Design 19(2) 15-26 (1993)
33 Lloyd C J Mizukami M and Boyce P R A preliminary model of lighting-display
interaction Journal of the Illuminating Engineering Society 25(2) 59-69 (1996)
34 Miller N J A recipe for lighting quality In J A Veitch (Ed) Proceedings of the First CIE
Symposium on Lighting Quality CIE x015-1998 pp 40-47 (Vienna Austria: Commission
Internationale de l'Eclairage) (1998)
35 Houser K W Tiller D K and Pasini I C Toward the accuracy of lighting simulations in
physically based computer graphics software Journal of the Illuminating Engineering
Society 28(2) 117-129 (1999)
36 Katzev R The impact of energy-efficient office lighting strategies on employee satisfaction and productivity Environment and Behavior 24 759-778 (1992)
Table 1 Measured room surface reflectances
Room Surface Material Colour Reflectance
ceiling acoustic tile matte white .89
partition fabric matte light grey .46
partition frame enamel paint low gloss light grey .47
VDT screen (off) specular glass black .12
desk top Formica low gloss light grey .50
binder bin Formica low gloss maroon .07
floor carpet tile matte multi-colour .12
Note. From Houser et al.(35) The space these authors modelled was the same space, and included the same furnishings, as was used in this study.
Table 2 Lighting system characteristics
Circuit # General Description
Position Details
1 Direct parabolic Ceiling (centre) 1' x 4' fixture with 2-32 W lamps (x 10), dimmable (10 – 100 % maximum)
2 Direct parabolic Ceiling (perimeter) 1' x 4' fixture with 2-32 W lamps (x 10), dimmable (10 – 100 % maximum)
3 Indirect Partition-mounted 4' fixture with 2-32 W lamps (x 8), dimmable (30 – 100 % maximum) 4 Task prismatic Undershelf 2' fixture with 1-17 W lamp (x 6),
non-dimmable
Note. Circuit numbers are shown in Figure 2. All ballasts were electronic. All lamps were T8, 3500 K Colour Temperature, Colour Rendering Index =80.
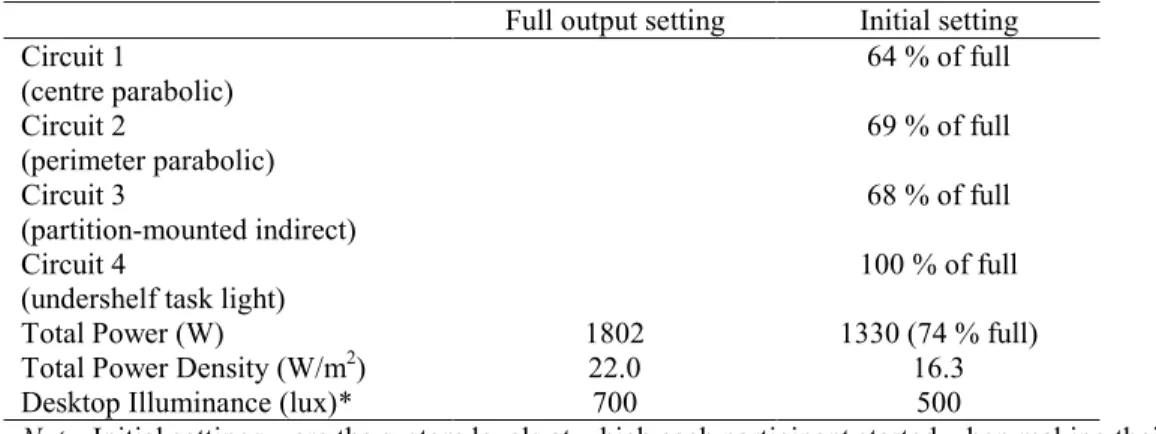
Table 3 Full output and initial lighting conditions
Full output setting Initial setting Circuit 1 (centre parabolic) 64 % of full Circuit 2 (perimeter parabolic) 69 % of full Circuit 3 (partition-mounted indirect) 68 % of full Circuit 4
(undershelf task light)
100 % of full
Total Power (W) 1802 1330 (74 % full)
Total Power Density (W/m2) 22.0 16.3
Desktop Illuminance (lux)* 700 500
Note. Initial settings were the system levels at which each participant started when making their lighting choices. * Measured close to the PC on the side without the task light.
Table 4 Correlation matrix of photometric variables
ED Iave LMM VDTIW VDTIB VDTG% VDTGI CEILIMAX LPD Eh Esr E:Esr Ecl Ecl:Eh Eeye
ED 1.000 Iave 0.98 1.000 LMM -0.76 -0.76 1.000 VDT IW 0.99 0.99 -0.75 1.000 VDT IB 0.98 0.98 -0.75 0.99 1.000 VDT G% 0.72 0.67 -0.41 0.71 0.77 1.000 VDT GI 0.73 0.72 -0.60 0.75 0.77 0.64 1.000 CEIL IMAX 0.56 0.57 -0.48 0.52 0.55 0.30 B 0.33 B 1.000 LPD 0.91 0.88 -0.70 0.89 0.93 0.79 0.73 0.52 1.000 Eh 0.98 0.98 -0.75 0.99 0.96 0.67 0.74 0.47 0.86 1.000 Esr 0.99 0.98 -0.75 0.99 0.99 0.76 0.75 0.54 0.93 0.98 1.000
E:Esr 0.27B 0.28 B -0.29 B 0.30 B 0.18 B,U -0.09 B,U 0.23 B -0.14 B,U 0.01 B,U 0.40 B 0.21 B 1.000
Ecl 0.95 0.95 -0.72 0.94 0.97 0.74 0.68 0.64 0.92 0.90 0.97 0.01 B,U 1.000
Ecl:Eh -0.44 -0.42 0.43 -0.47 -0.38 -0.17 B,U
-0.45 0.10 B,U -0.29 B -0.55 -0.40 -0.91 -0.19 B 1.000
Eeye 0.92 0.95 -0.73 0.93 0.90 0.53 0.59 0.66 0.78 0.91 0.92 0.21 B 0.93 -0.27 B 1.000
Note. All correlations are statistically signficant (p<.05), except: (1) marked B, which are not statistically significant using Bonferroni-corrected probabilities (this adjusts for the number of simultaneous tests); (2) marked U are not statistically significant by uncorrected probability testing (p>.05).
Table 5 Overall descriptive statistics for luminous conditions
M (SD) Med. Min Max
ED (lx) 423 (152) 413 83 725 Iave (cd/m2) 38.9 (12.0) 39.2 11.5 61.0 LMM 3.01 (0.33) 2.96 2.48 4.22 VDT IW (cd/m2) 32.1 (11.5) 32.7 6.6 53.0 VDT IB (cd/m2) 14.9 (5.0) 15.1 3.9 24.6 VDT G% 0.99 (1.02) 0.70 0.00 3.60 VDT GI (cd/m 2 ) 39.1 (22.8) 49.9 0.0 61.7 CEIL IMAX(cd/m2) 429 (196) 437 11 846 LPD (W/m2) 14.3 (4.1) 14.6 4.2 22.5 Eh (lx) 705 (277) 737 111 1181 Esr (lx) 315 (166) 319 67 543 E:Esr 2.02 (0.21) 2.00 1.48 2.63 Ecl (lx) 208 (74) 211 47 361 Ecl:Eh 0.31 (0.70) 0.30 0.16 0.53 Eeye (lx) 237 (84) 234 15 382
Table 6 Comparison of preferred and recommended luminous conditions
ED Iave LMM ID ID: Iave VDTIW VDTIW:Iave VDTIB VDTG% VDTGI CEILIMAX LPD
Median: This study 413 39.2 2.96 65.7 1.7:1 32.7 0.82:1 15.1 0.70 49.9 437 14.6 IESNA RP-1(18) 300-500 71.6-193.4▪ - 23.9-64.5▪ 3:1• - 3:1• 15-85 minimised minimised [850, 350, 175*] 16.2-20.4** CIBSE LG7(19) 300-500 14.3-89.1□ - 28.6-63.7□ 3:1• - 3:1• - minimised minimised [200*] -Berrutto et al.(17) 300 25-90 - - 2:1 - 3:1 - - - minimised minimised - 8 Halonen & Lehtovaara(5) 230-1000 - - - 1.68:1 -5.7:1 - - - -Loe et al. (16) † - >30 5.08 - - - -Ooyen et al.(21) [750-fixed] 20-45 - 40-65 1.33:1 - - - -Katzev(36) 495-517 - - -
-Note. Table shows comparisons of recommended or preferred luminous conditions for offices with VDTs, not including daylight, from this study, current
standards, European and North American studies. Values are for most-preferred lighting conditions in experimental reports, or for the authors' final
recommendations for best practice based on experimental or survey results. Empty cells reflect unavailable information. ▪ Range of vertical luminances on near surfaces, assuming 25-45% desktop reflectance and 1:3 task:surround luminance ratio. • Recommendation is for partition luminance ratio. For task-to-distant wall, the recommendation is 10:1. □ LG7 recommendations are written for horizontal desktop illuminance and illuminance ratios; luminance and luminance ratios were calculated using LG7-recommended reflectances. * Maximum permissible average luminance at limiting angles (preferred levels at 55 o, 65 o, and 75 o shown for RP-1, one value holds for 55 o, 65 o, or 75 o for LG-7). ** Ref 22,23. † Suggested best practice for Iave, and LMM for most interesting
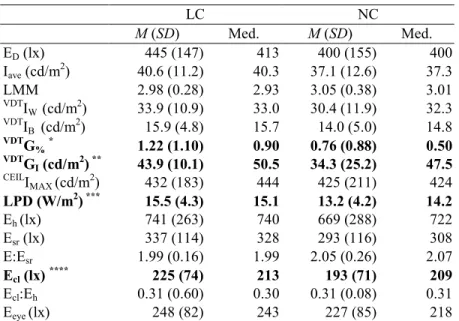
Table 7 Descriptive statistics of photometric variables for experimental groups LC NC M (SD) Med. M (SD) Med. ED (lx) 445 (147) 413 400 (155) 400 Iave (cd/m2) 40.6 (11.2) 40.3 37.1 (12.6) 37.3 LMM 2.98 (0.28) 2.93 3.05 (0.38) 3.01 VDT IW (cd/m2) 33.9 (10.9) 33.0 30.4 (11.9) 32.3 VDT IB (cd/m2) 15.9 (4.8) 15.7 14.0 (5.0) 14.8 VDTG %* 1.22 (1.10) 0.90 0.76 (0.88) 0.50 VDT GI (cd/m2) ** 43.9 (10.1) 50.5 34.3 (25.2) 47.5 CEIL IMAX (cd/m2) 432 (183) 444 425 (211) 424 LPD (W/m2) *** 15.5 (4.3) 15.1 13.2 (4.2) 14.2 Eh (lx) 741 (263) 740 669 (288) 722 Esr (lx) 337 (114) 328 293 (116) 308 E:Esr 1.99 (0.16) 1.99 2.05 (0.26) 2.07 Ecl (lx) **** 225 (74) 213 193 (71) 209 Ecl:Eh 0.31 (0.60) 0.30 0.31 (0.08) 0.31 Eeye (lx) 248 (82) 243 227 (85) 218
Note. LC=Lighting Control group, N=47, chose lighting conditions in the morning. NC=No Control group, N=47, chose lighting conditions at the end of the workday. M = arithmetic mean. SD = standard deviation. Med. = median. *F(1,92)=5.03, p<.05, R2=.052. ** F(1,92)=4.30, p<.05, R2=.045. *** F(1,92)=6.7, p<.05, R2=.068. **** F(1,92)=4.5, p<.05, R2=.047.
Table 8 Proportional use of indirect and direct lighting systems
Direct Indirect Difference
M (SD) Med. M (SD) Med. M (SD) Med. Overall .52 (.20) .55 .43 (.19) .41 .09 (.39) .14 LC (N=47) .53 (.21) .58 .42 (.19) .38 .11 (.39) .20 NC (N=47) .51 (.20) .53 .44 (.19) .42 .07 (.38) .10 Note. M = arithmetic mean. SD = standard deviation. Med. - median.
Table 9 Descriptive statistics for lighting quality and satisfaction
Lighting Quality Bothersome Glare Environmental Satisfaction M (SD) Med. M (SD) Med. M (SD) Med. Overall 4.1 (0.7) 4.1 1.8 (1.1) 1.5 2.8 (0.8) 3.0 LC (N=47) 4.2 (0.6) 4.2 1.9 (1.2) 1.5 2.8 (0.7) 3.0 NC (N=47) 4.0 (0.8) 4.0 1.8 (1.0) 1.5 2.7 (0.8) 3.0
Note. Lighting Quality and Glare are on scales from 1-5. Low values of Glare indicate less bother from glare. Environmental satisfaction is on a scale from 0-4, with higher values reflecting greater satisfaction. M = arithmetic mean. SD = standard deviation. Med. - median.
Table 10 General lighting preferences
Overall Groups
M
(SD)
Med. Response Frequencies LC NC
OO O N P PP Question DNR 0 1 2 3 4 M (SD) Med. M (SD) Med. 1. I prefer to work in offices with windows. 3.2
(0.9) 3.0 3.3 (0.8) 3.0 3.2 (0.9) 3.0 # 0 1 2 13 35 43 % response 0 1.1 2.1 13.8 37.2 45.7
2. When I have a window, I prefer to have a blind or a curtain. 2.7 (1.0) 3.0 2.8 (0.9) 3.0 2.7 (1.1) 3.0 # 0 4 9 12 51 18 % response 0 4.3 9.6 12.8 54.3 19.1
3. I prefer a uniformly bright room. 2.5 (1.0) 3.0 2.5 (1.0) 3.0 2.5 (1.0) 3.0 # 0 2 18 20 41 13 % response 0 2.1 19.1 21.3 43.6 13.8
4. I prefer a darker room, with a task light on my desk or beside my computer.
1.4 (1.0) 1.0 1.5 (1.1) 1.0 1.3 (1.0) 1.0 # 1 15 41 21 13 3 % response 1.1 16 43.6 22.3 13.8 3.2
5. I prefer a very dark room. 0.6 (0.7) 1.0 0.7 (0.7) 1.0 0.5 (0.7) 0.0 # 0 46 41 6 1 0 % response 0 48.9 43.6 6.4 1.1 0
6. Lighting in offices is not very important to me.* 0.9 (1.0) 1.0 1.2 (1.1) 1.0 0.7 (0.8) 1.0 # 1 35 41 9 5 3 % response 1.1 37.2 43.6 9.6 5.3 3.2
7. I don’t care whether or not I can adjust the lights. 0.9 (0.8) 1.0 1.1 (0.9) 1.0 0.8 (0.7) 1.0 # 0 29 48 14 1 2 % response 0 30.9 51.1 14.9 1.1 2.1
8. It’s important to me to be able to adjust the position and angle of the lighting in my office.
2.8 (1.0) 3.0 2.7 (1.1) 3.0 2.8 (0.9) 3.0 # 0 3 7 19 45 20 % response 0 3.2 7.4 20.2 47.9 21.3
Overall Groups
M
(SD)
Med. Response Frequencies LC NC
OO O N P PP Question DNR 0 1 2 3 4 M (SD) Med. M (SD) Med. 9. When I have an office with a window, I
don’t need electric lights during the day.
1.7 (1.1) 1.0 1.7 (1.1) 1.0 1.7 (1.1) 1.0 # 0 9 43 17 19 6 % response 0 9.6 45.7 18.1 20.2 6.4
10. I’d like to have indirect lighting (fixtures that bounce light off walls or ceiling, to light room surfaces). 2.4 (0.9) 2.0 2.4 (0.8) 2.0 2.8 (0.9) 2.0 # 0 2 10 38 37 7 % response 0 2.1 10.6 40.4 39.4 7.4
11. I like to be able to turn lights on and off as I wish during the workday. **
2.9 (0.8) 3.0 3.2 (0.7) 3.0 2.7 (0.8) 3.0 # 1 1 3 15 55 19 % response 1.1 1.1 3.2 16 58.5 20.2
Note. DNR = did not respond. OO = 0; O= 1; N = 2; P = 3; PP = 4. Overall MANOVA of item means by Lighting Choice condition: Wilks' Λ = 0.783 F(11,79)= 1.99, p<.05, R2ave=2.2%. *F(1,89)= 6.21, p<.001, R2=6.5%. **F(1,89)= 9.74, R2= 9.9%. M = arithmetic mean. SD = standard deviation. Med. - median.
Figure 1. Photograph of NRC's Indoor Environment Research Facility, as configured for this experiment.
Participants in this experiment occupied the two middle workstations in each row.
Figure 2. Layout of furniture and reflected ceiling. Numbers indicate the individual circuits described in text and in
Table 1. 1 1 1 1 1 1 2 2 2 2 2 2 2 2 2 2 3 3 3 3 3 3 3 3 WS2 WS5 4 4 4 4 4 4 1 1 1 1
Figure 3(A & B). Photograph (A) of workstation view and line diagram (B), showing definitions of derived
photometric values, based on Loe et al.(16)
This area is approx. 40º field of view.
LMM is the log of
the max/min luminance ratio in this area. Iave is the
mean luminance in this area. CEIL IMAX is the maximum luminance in this area. VDT
IB is the mean luminance
of the VDT screen, when screen is off. VDT GI is the mean luminance of areas on the VDT screen > 40 cd/m2, when screen is off. VDT G% is the % of the VDT screen > 40 cd/m2. ED is measured on the
desktop, on the side opposite the task light.
Figure 4 (A-D). Histograms of selected photometric quantities. (A) ED; (B) LPD; (C) Iave; (D) LMM. 0 5 10 15 20 25 30 100 200 300 400 500 600 700 800
Desktop Illuminance (lux)
Frequency IESNA RP-1 0 5 10 15 20 25 30 6 8 10 12 14 16 18 20 22 24 LPD (W/m2) Fr e q ue n c y ASHRAE/IESNA 90.1-1989
0 2 4 6 8 10 12 14 16 15 20 25 30 35 40 45 50 55 60 65
Average Luminance (40-deg) (cd/m2)
Frequency Approx. median 0 5 10 15 20 25 30 2.5 2.75 3 3.25 3.5 3.75 4 4.25 Approx. median LMM

![[PDF] Formation Visual Basic et les Bases de Données | Cours informatique](data:image/gif;base64,R0lGODlhAQABAIAAAP///wAAACH5BAEAAAAALAAAAAABAAEAAAICRAEAOw==)