*Indian Institute of Management ^Massachusetts Institute of Technology †Yale University ‡ Rajasthan Police
We thank Clément Imbert, Selvan Kumar, Dhruva Kothari, Neil Buddy Shah, and Pankaj Verma for their outstanding contributions as research assistants on this project. We are indebted to M.K. Devarajan, and M. L. Lather for their insights and comments, and A.S. Gill, formerly Director General of Police of Rajasthan police, for initiating and con-stantly supporting this research. The findings and opinions expressed in this paper are those of the authors and do not in any way engage the responsibility of the Rajasthan police. The paper was written in complete independence and the Rajasthan police, as an institution, did not weigh in on the analysis of the data or the drafting of the report. All the data collected in the course of this project is available for download and public use (including, but not limited to, replica-tion of our results) at http://dvn.iq.harvard.edu/dvn/dv/jpal.
We are grateful for funding from the Will and Flora Hewlett Foundation and the UNODC. The Hewlett Foundation was not involved in the drafting of this project.
Can Institutions be Reformed from Within?
Evidence from a Randomized Experiment with the
Rajasthan Police
Abhijit Banerjee^, Raghabendra Chattopadhyay*, Esther Duflo^, Daniel Keniston†, Nina Singh‡
Abstract
Institutions in developing countries, particularly those inherited from the colonial period, are often thought to be subject to strong inertia. This study presents the results of a unique randomized trial testing whether these institutions can be reformed through incremental administrative change. The police department of the state of Rajasthan, India collaborated with researchers at US and Indian universities to design and implement four interventions to improve police performance and the public’s perception of the police in 162 police stations (covering over one-fifth of the State’s police stations and personnel): (1) placing community observers in police stations; (2) a freeze on transfers of police staff; (3) in‐service training to update skills; and (4) weekly duty rotation with a guaranteed day off per week. These reforms were evaluated using data collected through two rounds of surveys including police interviews, decoy visits to police stations, and a large-scale public opinion and crime victimization survey—the first of its kind in India. The results illustrate that two of the reform interventions, the freeze on transfers and the training, improved police effectiveness and public and crime victims’ satisfaction. The decoy visits also led to an improvement in police performance. The other reforms showed no robust effects. This may be due to constraints on local implementation: The three successful
interventions did not require the sustained cooperation of the communities or the local
authorities (the station heads) and they were robustly implemented throughout the project. In contrast, the two unsuccessful interventions, which required local implementation, were not systematically implemented.
2
1. Introduction
Institutions are widely recognized to be a prime determinant of a nation’s success or failure (Rodrik, Subramanian, and Trebbi 2004). A common view in political economy (see, for example, Acemoglu and Robinson 2011) is that institutions are also very difficult to reform: bad
institutions tend to self-perpetuate, since those in power also have a vested interest in maintaining the status quo. This is why developing countries that inherited extractive institutions from the colonial era tend to have bad institutions today and, as a result, weak economic performance.
The police could be regarded as the archetypal sclerotic institution: while there are examples of police reform in a few countries (for instance in the ex-Soviet states or in South Africa), in many developing countries (e.g. India, parts of Africa [Opolot 1992], Malaysia [Tan 2005]) the police largely retained the organization and rules established by the colonial power. In India, the setting for this paper’s study, the Police Act of 1861 is still in effect. Since 1977, a succession of police reform commissions have recommended wide-ranging changes, but implementation, so far, has been essentially inexistent. There is considerable skepticism on the desire or ability of the police to reform itself, to the point where there is a Supreme Court case seeking to compel the Indian states to comply with past reform commissions' findings (Prakash Singh vs. Union of India).
This article investigates whether gradual reform can be implemented in such a setting, and whether it has the potential to improve police performance and perception. The reform effort was initiated by A.S. Gill, then the Director General of the police in Rajasthan, India’s largest state (342,239 square kilometers), with a population of over 56 million inhabitants as of 2001. The objective of the project was to identify promising reforms among those proposed by the various police commissions, attempt to implement them in the State, and rigorously evaluate their impact on police behavior and population and victim satisfaction.
Remarkably, the decision was taken to evaluate the effectiveness through a series of randomized control trials, conducted in collaboration with J-PAL, a research center based at the
3
projects through rigorous evaluation, and led by a research team including a senior police officer (Nina Singh) and MIT researchers. In an 18 month project, four reform interventions were implemented in a randomized fashion across 162 police stations across 11 districts of the state, representing 21% of the police stations in the state: (1) weekly rotation of duty assignments including a guaranteed day off each week; (2) a freeze on transfers of police staff; (3) in-service training to update skills; and (4) placing community observers in police stations. These reforms were chosen because they had been recommended by police experts and because, if successful, they had the potential to be scaled up in Rajasthan and elsewhere. In particular they implied a minimal budget outlay or manpower increase, if any, and did not require changes in the fundamental processes used by the police (unlike, for example, the introduction of incentive pay). In other words, these are gradual reforms that the police could implement from within. To evaluate these reforms, data was collected through two rounds of surveys (before and after the intervention) including police interviews, decoy visits by surveyors to police stations, and a large-scale crime survey—the first of its kind in India.
The results suggest that two of the interventions, the freeze on transfers and the training, were effective in improving police effectiveness and public image. Both increased the reported satisfaction of crime victims with the police investigation, and the freeze on transfers also decreased the number of respondents who report fearing the police. Interestingly, the visits of decoy surveyors pretending to register crimes at police stations, which were initially conceived of primarily as a method of data collection, also had an effect of their own on police behavior-- suggesting that a simple increase in monitoring may have a positive effect on police
performance. The other reforms showed no robust effects.
The fact that the interventions mainly affected the perception of the police is exactly as it was meant to be. The police establishment is deeply concerned about the potential alienation of the public, which they see as a major constraint on their ability to be effective in “serious” cases such as terrorist attacks and other major crimes, where the willing cooperation of the public can be essential.
4
Why did some interventions seem to achieve their objectives while other did not? A clue can be found in the level of implementation of the reforms on the ground. The training was
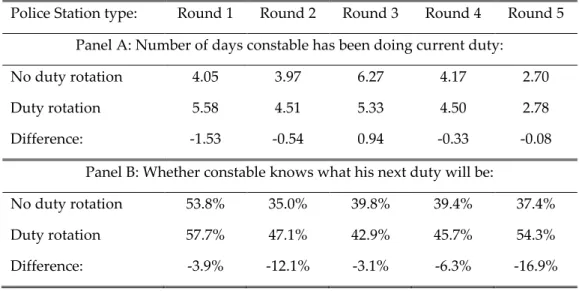
implemented quite systematically as planned and while transfers were far from frozen in the selected police stations, they reduced significantly for the entire duration of the experiment. The decoy visits also happened as scheduled. In contrast, the implementation of the day off and duty roster, while good at the beginning, rapidly collapsed: after about five months, there was no significant difference in the incidence of days off in treatment and control stations. There is also no clear sense that rotation was implemented in a systematic basis after the initial few month of the initiative. Similarly, during random visits to police stations, surveyors could very rarely saw a community observer at the appointed time.
Why, then, were some interventions implemented and others not? A common thread of the three interventions that were actually implemented is that they were “top-down,” and required little cooperation from the ground staff: transfers must be approved at police headquarters (although there is considerable pressure from outside for some transfers), and training orders were
dispatched from above. The decoy visits were performed by an independent company supervised by J-PAL. In contrast, the two unsuccessful interventions required effort and
cooperation from the station chiefs (and, in the case of the community observers, participation at the community level). Relying on the “command and control” approach that is the standard practice by the police, the project depended upon the compliance of subordinate officers to an order given by the hierarchy, and did not attempt to structure the reforms in a way that was in their direct interest (to take a clear example, the day off did not apply to the station chiefs!). In practice, it proved relatively easy for them to subvert the implementation in a way that let them go back to the status quo, despite the commitment to the reform at the highest level. This underscores the importance of details in the design of reform attempts: the ability of the lowest level of a system to resist change could be just as responsible for institutional inertia as the elite’s interest and ability to preserve the status quo.
Of course, such an interpretation cannot be justified on purely experimental grounds. There may be many other reasons why these interventions were better implemented, and yet more reasons
5
why, even if they had been, they may not have worked. Nevertheless, focusing on the details of the implementation, in combination with the impact evaluation results from a set of quite different reforms--all implemented at the same time in the same locations within the same institution--offers a relatively rare view into the constraints on institutional reform. In particular, our results highlight both the possibility of quite large improvements from relatively cheap interventions, but also the risk of their being blocked by the ground-level participants.
The paper begins in section 2 with an introduction to police reform and performance problems in contemporary India. In section 3, we describe the reform interventions, and outline the data collection strategies and instruments used to evaluate them. Section 4 reports the results of the baseline survey, including the first representative crime statistics from a state-wide household survey in India. Section 5 describes the outcomes of the reform interventions, and section 6 investigates the reasons why many of them may have failed to show an effect on either the public opinion or police behavior. Finally, we conclude in section 7 with implications for policy and further study of police and government reform.
2. Policing and Police Reform in India
Like many developing countries, independent India inherited a police force initially designed to protect the interests of the colonial power. The British colonial administration established an Indian police force in which senior officers were recruited through a competitive examination held in London that was initially open only to the British citizens. Local constables formed the main interface between the public and the police, but they were accountable only to the British colonial establishment they served and had little opportunities for advancement. Fraternization with the public was discouraged (Kolsky 2011).
The onset of democracy after independence did little to change the colonial organization of the police, while the social, economic, and political dynamics of India have transformed
dramatically. The Police Act of 1861 remains in effect, and with it a highly centralized police force in which the station-level police staff is accountable only to a cadre of elite officers, chosen through competitive examinations inspired by the pre-independence British exams. These senior
6
officers (members of the Indian Police Service, or IPS) report to the state-level director general of police (DGP), who in turn reports to the elected state chief minister. In practice, elected
representatives informally intervene at the lower levels of the police hierarchy as well, for example to enforce transfers of constables or officers they do not approve of, or to protect themselves or others from prosecution (Human Rights Watch 2009).
While even colonial British observers bemoaned the faults of the Indian police system (Police Commission 1903), the interaction of the imperial police institution with an increasingly prosperous, educated, and empowered population has led many, both within the police and outside it, to highlight a set of pressing problems (Verma 2005).
Perhaps the fundamental constraint on the police institutions as they stand today is that they provide little means for senior officers to incentivize their staff. Virtually all promotions are based on seniority or standardized tests, and performance bonuses or even medals and other tokens of recognition are extraordinarily rare. Since transfers of police staff between more or less desirable posting locations are one of the few incentives that officers can manipulate, the
frequency of transfers has risen to a level that may be much higher than would be the case if other incentives were available (one-third of all policemen got transferred in our control stations over a period of eighteen months). While this system is clearly suboptimal, its costs are
accentuated when the incentives offered to police staff are used to further partisan or corrupt motives. The National Police Commission (NPC) observed in 1979 that, “the threat of transfer is the most potent weapon in the hands of politicians to bend down the police to his will” (15.14). Other sources suggest that transfers are both a source of corruption (as police officers pay bribes to politicians and senior officers to retain a good posting), and a barrier to law enforcement (because officers may be reluctant to take action in politically sensitive cases) (Wade 1985; Transparency International 2005).
A second, related problem is that Indian police procedural regulations provide little guidance on management of human resources at the police station level. In theory, police staff remain on duty for twenty-four hours a day, seven days a week, and there is no formal system of duty rotation or allocation. All assignment of leave and duties is at the discretion of the police station chief,
7
whose incentives may not be aligned with the long-term welfare of the rest of the staff or society in general. Even in the best of circumstances such an ad-hoc system is susceptible to accusations of favoritism in assigning desirable duties, and many officers report feeling overworked and burnt out (Sidhu 2004).
The Indian system of crime records is another source of perverse incentives. Official data on crime rates, as reported in the media and used to evaluate the police themselves, are based solely on the number of cases registered in police stations. Police officers can thus manipulate the crime rate in their jurisdictions by simply refusing to register victims' complaints. Furthermore, the reporting rate may be lower in poorly performing stations precisely because people are afraid of the police and expect them to be unresponsive. The NPC acknowledges this: “The unreliability of crime statistics in India is well known….Whenever a genuine effort was made to register all crime…the figures showed such fantastic jumps as were impossible with any normal increase in one year” (62.10). Precisely because registration rates are not a reliable source for crime statistics, most countries, including the US, most European countries, and many developing countries, use crimes statistics based on crime victimization surveys (household surveys conducted by
independent agency) to measure crime. As of today, this is not the case in India.
A fourth issue is the lack of accountability and communication with the public. Several of the Indian police reform committees have recommended the creation of civilian oversight
institutions for the police, known as Police Complaint Authority at the district and State levels , to promote accountability. They have also emphasized the need to communicate to the public a “clear understanding of the limitations and constraints within which the police has to function” (NPC 61.46) ,” (CHRI 2005). Verma (2005) suggested the creation of “citizens’ boards” with extensive powers to investigate complaints against police personnel, and evaluate their performance at the district level. Such experiences have been tried in several developed
countries, as well as the ex-Soviet States (Capari and Marenin 2005) and South Africa (Bruce and Neild 2005).
Underlying may of the negative outcomes in police performance and public image is the lack of skills; both “professional” (investigation methods, etc.) and “soft” skills (mediation,
8
communication) have frequently been recognized as significant barriers to effective policing (The Hindu 2011). Constables are recruited mainly on physical characteristics (height, chest measurements etc), and only education through class 10 (less than high school) is required. After the initial training of 12 months for constables, two years for Sub-Inspectors and Station House Officers (head of police stations), refresher courses are scarce. While many have emphasized the need for scientific investigation skills (Verma 2004), the traditional colonial attitudes of the police are also inadequate to command public trust in a changed environment. The NPC stated that, “It is considered basic and fundamental…that every police officer develops an attitude of courtesy and consideration combined with sympathy and understanding towards any member of the public who comes to him seeking help” (41.09). Without any guidance about how this is to be achieved, and given police tradition, this injunction has remained in the realm of wishful thinking.
In response to these and other perceived weaknesses in the police administration, the Indian central government has launched several top-down police reform initiatives. The most
influential, the National Police Commission of 1977, highlighted many of the failings described above and recommended progressive reforms, but few of its recommendations have been put into practice. Subsequently there have been a series of commissions aimed at reforming various facets of policing, culminating in the establishment of the Soli Sorabjee Committee (2005). The committee produced the Model Police Act to guide the states in overhauling their police institutions and succeeded in motivating a few states to draft new police legislation, but none have fully implemented them. In 2006, the Supreme Court of India, in its judgment in Prakash
Singh vs Union of India, directed the state governments to constitute institutions and draft
mechanisms for improving the effectiveness and accountability of police. Here too, there has been little implementation: as of 2011, no state has fully complied with the directives and the institutional structure of the Indian state police forces remains largely as it has been for the past 50 years or more.
In response to lack of systematic reform and the perceived need for change on the ground, individual officers have taken initiatives at the local level. In Punjab, a project reviewed in Sidhu
9
(2004) instituted a weekly day off for police personnel to reduce their level of stress and improve productivity in police stations. Similarly, in 2002, the Rajasthan Police introduced a community policing program to build a partnership between police and the public to resolve petty disputes and foster mutual understanding. However, these programs are often dependent on the support and enthusiasm of a single individual or administration, and cease operation after their exit. The lack of broad support may be due to the absence of any objective, substantial data on success; there is little basis to compare the claims of the supporters and detractors of such initiatives.
3. The Rajasthan Police Experiment: Design and Objectives
The key features of the police of the State of Rajasthan are broadly characteristic of the police in the rest of India. In 2007 the total force consisted of 70,767 personnel, divided among 711 police stations and 38 districts . Consistent with the traditional hierarchical organizational structure of the Indian police, only 0.2% of Rajasthan police staff are members of the senior IPS cadre, while 76% are constables--the lowest rank. Crime rates were broadly comparable with other Indian states: Rajasthan ranked 4th out of 28 states in total crimes serious enough to be investigated without court order, but 25th in murder rates. At the time of this research, the Rajasthan Police had not invested in capital modernization to the extent of the police in the large cities of Mumbai, Delhi or the states of Karnataka and Andhra Pradesh (home of the IT clusters of Bangalore and Hyderabad). However, they are not generally considered (or portrayed in the media) to be being particularly compromised or ineffective compared to police forces in other states.
In 2007 the Rajasthan Police undertook a variety of reform initiatives, for example introducing some elements of community policing, investing in some police stations to bring them to ISO international norm, introducing duty rotation among traffic police in Jaipur, etc. These, however, had generated substantial debate among senior officers, and the police leadership found that they had little reliable data on public perceptions and victim satisfaction with which to evaluate whether their efforts were successful. Motivated by the lukewarm reception and ambiguous results of these earlier reforms, the police launched a new series of programs designed to address concerns about evaluation and scaling up, and under the leadership of the then director general
10
of police, enlisted a few senior staff members in the effort (including a co-author of this article). This new round of reforms was meant to address the key issues mentioned above, and was inspired by previous efforts and the recommendations of experts. However, it was explicitly designed to be different from the past along two dimensions: First, interventions would be simple and cost- effective enough to be implemented in any police station in Rajasthan and the rest of India if they were found to be effective. This, in particular, implied that they should not require fundamental changes in the policing legislation or impose extra financial burdens on the state: a gradual, feasible approach was explicitly sought. Second, they would be rigorously evaluated, providing quantitative data for future policy decisions. Based on these criteria, after a four-month feasibility study conducted by the research team (which included interviews at various level of the hierarchy, consultations with judges and police experts), and a small pilot conducted in eleven police stations over two months, the police launched four reform initiatives which satisfied those criteria:
1. Freezing of transfers: All administrative transfers were prohibited for personnel posted to police stations selected for this intervention for less than two years during the program period. Exceptions could be made for well-documented cases of police misconduct requiring a transfer.
2. Weekly day off and duty roster system: Police station-level duties, such as clerk constable, night patrolling, sentry duty, court liaison, serving summons, etc., were to be allocated to staff on a rotating basis according to a written schedule. The entire staff in selected police stations (except the station chief) received one day off every eight days. In smaller police stations, where the shortage of manpower might be more acute, the station chief had the option of extending the rotation period up to fifteen days. The goal was not necessarily to create more rotations from duty to duty (which seems to happen fairly frequently in police stations anyway), but to create a transparent and fair system of work allocation that would lead to less jockeying for positions, lower stress, more predictability, better informed officers and higher overall productivity.
3. Community observers: Introduced for the first time in Rajasthan, the community observers were local volunteers who would sit in the police station for approximately three hours daily during its peak operating hours. The observers’ sole task was to watch the activities within the
11
police station and become familiar with the duties, procedures and challenges faced by the police. The community observer program had two main goals: first, to give a group of citizens firsthand experience with the police in a positive setting and encourage them to share their experience with others; and second, to provide community oversight in the police station. It was hoped that the presence of the observer would encourage the police to treat complainants with more sympathy and patience: the hours at which the observer was in the station were publicly posted, and potential complainants could thus decide to visit the police stations during those times.
To avoid creating a large burden on any one person, and to address the concern that previous efforts at community participation in police had raised--that the community liaison groups were just selected by the police to be cronies--each selected police station compiled a list of up to 100 community observers. Each of them was to visit the police station only once or twice before suggesting a replacement.
4. In-Service training program: Randomly selected police personnel were given training in at least one of two modules:
Professional/Investigation skills: 292 investigating officers (inspectors, sub-inspectors and assistant sub-inspectors) were trained for 6 days at the Rajasthan Police Academy with inputs on improving investigation procedures, such as field techniques and documentation, with
emphasis on scientific techniques.
Soft skills: 1541 police personnel of all ranks were trained for three days on improving public relations with inputs on “soft skills” such as communication, mediation, stress management, motivation, team building, leadership, attitudinal, change etc.
The primary implementation of the reforms was performed through the police hierarchy, with general supervision done at the level of state police headquarters. The district superintendents of police supervised the overall implementation in their respective districts, and police station chiefs were responsible for carrying out the reforms in their stations. The duration was for a period of one and half years.
12
Evaluation Strategy
162 police stations across 11 districts of Rajasthan were included in the sample1, with districts chosen to be geographically representative of the state of Rajasthan. The sample represents a substantial fraction of the state: over 20% of the police stations in the state and a population of almost 8 million people. The experiment was thus on a scale larger than the entire country of Denmark. This scale was not only necessary to get adequate power, it also gives meaning to success (or failure) in implementation; this was not a “gold plated,” small-scale experiment, but a full-scale rehearsal of what the reforms would look like if they were to be broadly
implemented.
The police stations were randomly assigned (by the research team, using a computerized randomization) to different reform strategies, using stratification to ensure a balance on geographical area (district), criminality (number of cases registered in 2005), and urban/rural environment. These variables are included as controls in all regressions performed in this study. Within each police station, staff members were randomly selected for the training intervention with the total percentage of staff trained in each station randomized at 0%, 25%, 50% or 75% or 100% of station personnel. This allows us to detect whether the effects of training are different when few or almost all the officers are trained: is it sufficient to train a few police officers who will then train others? Or is a critical mass necessary to get any impact, because trained officers get “contaminated” by those who have retained their old methods? Or is the effect broadly linear?
1 The eleven districts chosen for the project were Ajmer, Alwar, Barmer, Chittorgarh, Dholpur, Hanumangarh, Jaipur City East, Kota City, Nagaur, Pratapgarh, and Udaipur. Districts were chosen randomly across Rajasthan, and all stations within a district were eligible for inclusion in the program with the exception of those already involved in the state's ISO 9000 certification program.
13
A significant amount of data was collected on the participating stations, on a relatively regular basis. To assess a possible Hawthorne effect—the possibility that the police stations participating in the program might change their responses or behavior simply because they are being
observed by outside evaluators--an additional group of police stations, the “pure control” was also randomly selected. These police stations were not informed of the project, had no staff trained, and were never visited by investigators until the final end-line survey, at which point they were surveyed like all other stations. The Hawthorne effect can be estimated by comparing the control and “pure control” (those who were only brought in at the very end of the project) groups.
Table 1describes how the police stations were allocated to each evaluation group, with the number of police stations in each group in column 1, and the program elements implemented in that group in columns 1-4. As shown in column 4, wherever the community observer or weekly day off/duty roster interventions were attempted, transfers were also frozen. This was done for two reasons: First, because long tenure of staff is considered necessary to get acquainted with the area and people of the police station jurisdiction and see if this has any effect on their
performance; and second, due to concerns about attrition during the study. This implies that the impact of duty roster and community observers (or the combination of the two in the all
interventions stations) will be seen on top of the impact of the freezing of transfers.
Data
A series of surveys and interviews were conducted to establish baseline levels of police
performance and public perception of the police at baseline and endline, as well as to estimate the effectiveness of the police implementation. These included traditional household surveys, surveys of police personnel, as well as conducting random, unannounced visits to all police stations to collect data on program implementation. These rich data sets are one of the outcomes of the project: they are available for public use at http://dvn.iq.harvard.edu/dvn/dv/jpal.
Public Surveys
The public image of the police is both one of the most important outcomes of the project and the most difficult to measure, since impressions are subjective and tenuous. These issues, combined
14
with the fact that extremely few citizens actually interact with the police, necessitated a household survey that would be both in depth—to capture the various aspects of public perception—and large enough to detect a small change in opinion. In total 5,895 households were interviewed: A baseline was conducted with 2,454 households in the spring of 2007, randomly chosen from the 2004 voters list. The households that could be located again were re-interviewed along with 3,441 newly chosen households in the autumn of 2008. Within each household, three modules were administered (at baseline and endline):
A general crime screener questionnaire administered to the head of the
household, inquiring whether any member of the household had been a victim of a crime in the previous year.
A crime victim survey, administered to each individual crime victim in the household or a surrogate if the victim remained unreachable after multiple survey attempts. This survey ascertained greater detail about the crime, interactions with the police, and the victim’s satisfaction with police actions.
An opinion survey, administered to a randomly chosen adult in the household. The individual was asked about his or her contact with the police, and perceptions of police performance and integrity.
The crime-related surveys were broadly based upon the UNICRI’s International Crime and Victimization Survey, customized to the Indian context in order to make their results comparable with the crime categories of the Indian Penal Code. Like any crime victimization survey, these questionnaires do not capture “victimless crimes” such as gambling or drug use. Also, no attempt was made to measure the incidence of domestic violence because of concerns about the accuracy of reporting and the possibility of decreased respondent cooperation.
Police Surveys and Case-Handling Grading
To measure the effects of the interventions on police performance, a survey was conducted of the police staff. One-half of the staff of all ranks (2,367 in total) in treatment and control police stations was randomly selected from administrative personnel lists to be interviewed by surveyors at both baseline and endline surveys. In conjunction, 982 case files were randomly
15
selected from the project police stations and sent to a group of retired senior police officers for grading in two rounds, half before the training and half post-training. The retired officers filled out a detailed report about each case in which they graded the performance of the officer on both his actions at the crime scene, whether scientific techniques were used, and the care with which the evidence was collected and documents in the case file were prepared.
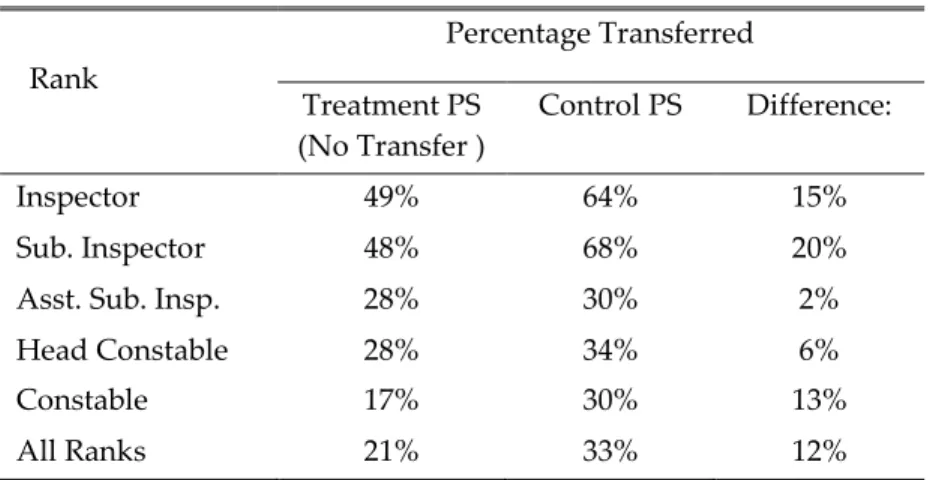
Unfortunately, the evaluation of the police survey and case review were compromised due to the high number of transfers among the police staff despite the freeze of transfer intervention. Due to these transfers, only 65 percent of individuals interviewed in the baseline could be
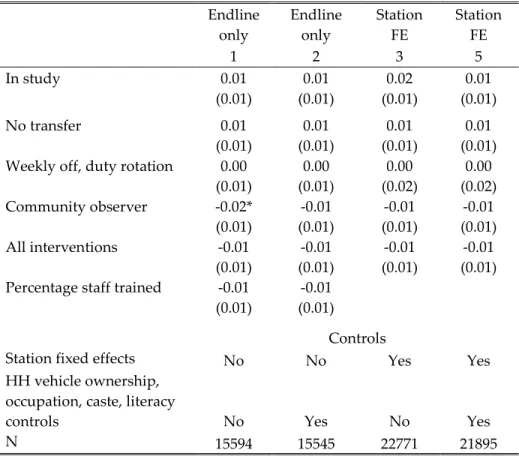
re-interviewed in the end line survey, and it is very difficult to know whether a particular officer should be attributed to a particular station. As expected, retention in the survey is affected by the no-transfer intervention, but as Appendix Table A1 shows, it varies significantly across the other interventions as well.2 This attrition raises the possibility that the sample of officers included in the final survey differs across treatments in important but unobservable characteristics.
Furthermore, despite considerable effort to guarantee confidentiality of the surveys, police officers tended to be worried about the fact that the data could be shared with their superiors, and the answers seem to be affected by social desirability bias.
In view of these potential biases, we will mainly use this data to provide illustrative summary statistics from the baseline survey. We will also present the case review data as a complementary source of information.
Visit of Decoy Victim Surveyors
2 While the relatively high attrition in the weekly off/duty rotation and all-interventions groups might be
attributed to the absence of staff on the day of the survey due to their being on weekly off, by the time of the endline we find no actual difference in days of leave between the police stations employing weekly off and those that were not.
16
To provide an alternative indicator of police performance, a “decoy” surveyor program was developed in which surveyors visited police stations in the treatment and control groups and attempted to register cases posing as victims of various types of crimes. The crimes chosen were not representative of the entire population of possible crimes: we chose scenarios where the crime was relatively petty3, where the tendency to under-register may be the greatest. These visits were unannounced and the surveyor did not disclose his identity except in situations where it seemed that the police would actually register the case (to avoid registering a false case, which is illegal), or if the situation otherwise required that the surveyor disclose his identity--for instance, if the police threatened to prosecute him for filing a false case. Immediately after the visit to the police station, the surveyor completed a short form recording his success or failure in registration, the attitudes and actions of the police, and other details, such as the total time taken and the names of the officers with whom he interacted.
Although the decoy program was designed to monitor the other interventions, it is also an intervention in itself, since it provides a check on police behavior with the crime victims, and their propensity to record cases or not. Knowing that their behavior is thus monitored can induce the policemen to behave better with crime victims in case one of them is actually a decoy. Indeed, after the first few rounds of decoy visits we began hearing reports from field staff that police officers may have been improving their behavior so as to perform better for potential decoy visits. To test this possibility we extended decoy intervention to 46 police stations outside the 10 districts assigned to the program. This allowed for data to be collected on an alternate set of pure control police stations where the officers were not aware of the existence of the reform project without contaminating the pure controls in the intervention districts.
3 Stolen mobile phone (29%), stolen suitcase (25%), stolen bicycle (15%), stolen railway ticket (10%),
17
4. Crime and Policing in Rajasthan: Baseline Status
The baseline data collected for the project provides further evidence on the context and
background for the interventions and the study. In particular, it confirms many of the problems that were mentioned in the context study, which motivated our choices of interventions.
Crime
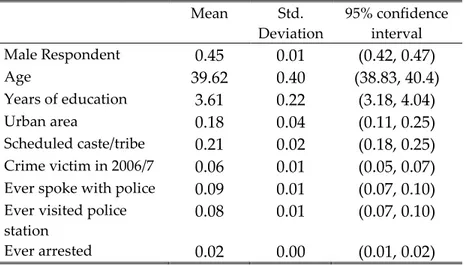
The detailed crime survey provides the first large-scale representative estimates of the crime rate in Rajasthan. We find that 1.7% of individuals were victims of a crime in the past year, and that 5.9% of households had at least one member who was a victim of a crime. This estimate excludes crimes of domestic violence, which were not surveyed because of accuracy concerns. Theft was by far the most common type of crime, with 37.9% of all reported crimes, followed by burglary at 16.6% and assault at 12%. Crime rates differed widely and significantly across districts, with Kota (a city near the border with the neighboring state of Uttar Pradesh) the highest at 3.5% crime victimization, and Nagaur (a very rural district) the lowest at 0.8%.
The comparison of crime surveys and official police records reveals a high correlation between the two (at the police station-level, about 0.5), but household crime surveys show substantially higher crime levels and reflect public perceptions of crime levels better than official statistics. Per-capita crime rates are substantially higher from survey data, especially for property crimes: survey theft rates are 9.24 times registered rates and robbery rates are 11.35 times higher than in police records. The differential decreases for violent crimes: Rape or molestation surveyed rates are 1.43 times rates reported to the police, and assault is only 11% higher in the survey (neither difference is statistically significant).
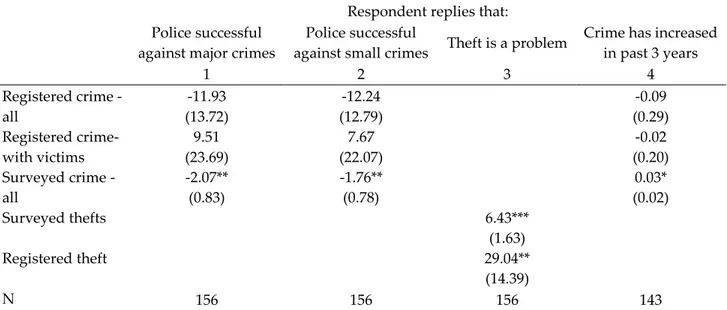
Which of these measures best reflects public opinion of crimes? To perform this analysis we use the public opinion survey, and exclude the opinions of crime victims themselves, since their perceptions may have been distorted by their direct encounter with crime. Table 3shows regressions of public opinion survey respondents' views police performance and crime rates on crime statistics at the station level from both police reports and household surveys. Columns 1 and 2, in which the dependent variable is an indicator equal to 1 if the respondent replies that the police are successful in controlling major or minor crimes, show that when all three crime rate
18
indicators are included in the regression, only the total crimes recorded from the household survey are significant. Both are significant in column 3, which looks at whether respondents report that thefts are a problem. Finally, column 4 regresses an indicator for whether
respondents feel that crime has increased in the past three years on the percentage change in crime between 2006 and 2007. Despite the measurement error due to the different recall periods, we find changes in total crimes reported on the household survey to be positively associated with perceived changes in crimes, albeit only at the p.=9% level. Changes in crimes registered with the police are completely insignificant. Thus, while crime reports from household surveys are substantially correlated with police records, to the degree that they differ the survey data gives a significantly better representation of crime as experienced by the population.
Reporting of Crime by Citizens and Registration of Crime by Police
The difference between the level of registered cases and the level of crime actually reported in the survey suggest that many crimes are not reported. Indeed, most crime victims never report their incidents to the police. Only 29% of the crime victims we surveyed stated that they had visited a police station to report the crime. Among those who attempted to report their crimes, 17% did not succeed in registering a case.
While the biggest reason for not reporting a crime was lack of importance perceived by the victim (28%), substantial numbers of crime victims did not go to the police because they thought that the police were incapable of helping (20%) or unwilling to help (17%). Important cases such as motorcycle theft and assault were registered relatively more frequently (75% and 61%, respectively) than theft (12%) and vandalism (17%).
It is important to note that the “lack of importance” may reflect the perception that the police would not treat the case seriously even if reported (and may refuse to register it): thus the figure of 17% unregistered crimes may be a severe underestimate if the entire population of incidents was considered: people may not attempt to register an incident that they know would not be reported.
19
This is clearly demonstrated by the results of the decoy survey, which do not suffer from any selection or recall problem, by construction. Overall, in the decoy police were willing to register First Information Report (FIR) only 54% of the time from the decoy surveyors. However, this rate was quite variable across types of crimes, with more serious and verifiable cases registered significantly more frequently. House break-ins were registered 92% of the time, and reports of stolen motorcycles led to 64% FIR registration. On the other hand, decoy surveyors claiming that they had lost railway tickets or had mobile phones stolen succeeded in registering a case only 43% and 40% of the time, respectively.
The low rate of registration in the decoys, plus the fact that many crime victims do not actually bother to report the crime, suggests that using crimes registered in police stations as a measure of crime rate is profoundly misleading.4 Indeed, the analysis of the data of household crime survey conducted during the course of the program reflects public perception of crime better than the official registration of crime at the police stations. This underscores the need for an independent crime survey, which could be conducted in conjunction with other nationally representative surveys (e.g. the Indian National Sample Surveys).
Victim Satisfaction
4 A very interesting of the discrepancy between reporting and actual crim is provided in Iyer et al. (forthcoming). They show that reported of crime against women increases when political po-sitions are reserved for women at the local level, both in this data and in nationally representa-tive data. However, they also find that in our data there is no actual increase in the incidence of crime.
20
The baseline data reveal a very lukewarm picture of public satisfaction with the police work during investigations: 39% of victims were either completely satisfied or satisfied, but 35% of victims reported being completely unsatisfied, and 27% unsatisfied. The reasons for victim dissatisfaction are clear: there is a strong perception among crime victims that police are not truly interested in helping them or resolving their case. 82% of the unsatisfied victims stated that they were unhappy because the police “didn’t do anything special” or “didn’t take interest” in their case. In contrast, only 15% complained of police corruption, and another 20% complained of discourtesy when attempting to report a crime. This is consistent with the observation of the surveyors during the decoy visit. In 65% of visits the surveyor’s complaint was immediately addressed by the police staff and less than 5% of the time was the waiting period greater than 15 minutes. Surveyors compared the behavior of police staff to the “normally polite” attitude they might expect from the staff in a private bank. They found that 69% of the time the police were polite, and 11% of the time they were “extremely polite.”
These results suggest that the effort and responsiveness of police is the deciding factor of public perception. This is confirmed in a regression of the correlates of victim satisfaction in Table 4. The probability that the victims expressed satisfaction with the police was 20% higher when the police took some action to investigate after the crime, and 12% higher when the police simply visited the scene of the crime or the victim's home. Actual success in investigation led to the greatest effects in satisfaction: 22% higher when the police made an arrest, and 53% higher when the police recovered property. Not surprisingly, a demand for bribes by the police reduced the level of satisfaction by 17%.
This regression controls for the type of crime and the characteristics of the victims, although we do not display those coefficients to save space. Victims of extortion and hurt or grievous hurt were more satisfied with police work, while victims of “eve-teasing” (Indian police language for harassment against women) and vandalism were less satisfied. Wealthier victims (vehicle owners) were less likely to be satisfied with police efforts than agricultural laborers, who would tend to occupy a lower economic class in society. The gender of the victim (16% of crime victims are women) seems to have no effect on the level of satisfaction.
21
General Public Perception of Police
Few respondents have experience with the police or ever interacted with them. The household survey summary statistics in Table 2 show that only 9% of those interviewed have ever had an interaction with the police in their lives, and only 3% of women have spoken with a police officer. Even in urban areas, only 20% of male respondents ever reported interacting with the police. In the absence of personal experience, 72% of those surveyed claimed that they had formed their opinions based on word of mouth from other citizens, with only 14% and 16% stating that they based their opinions on print and television news sources, respectively5. This pattern of information dispersal--opinions formed by hearsay and few real experiences--would suggest that an intervention like the community observer program, which gives a few citizens positive experiences with the police, does have potential to improve perceptions of the police.
Citizens’ opinions of police conduct were very mixed. Most, like crime victims, felt that the police were generally polite to them: 73% responded that the police were mostly or always helpful, and 64% replied that the police were always or mostly courteous. Yet these positive impressions were balanced by negative perceptions of other aspects of police behavior: 53% of the respondents stated that law-abiding citizens fear the police and 53% believed that the police are always or usually cruel to those in custody. Here again, the police legacy as a force that was prohibited to fraternize with the public and was supposed to maintain a distant and fearful image is still haunting the relationships between the public and the police. Direct interactions (through the community observer program), soft skill training, and more sustained relationships through longer postings are all interventions that appear to have the potential to reduce the fear of the police.
Police Performance and Morale
22
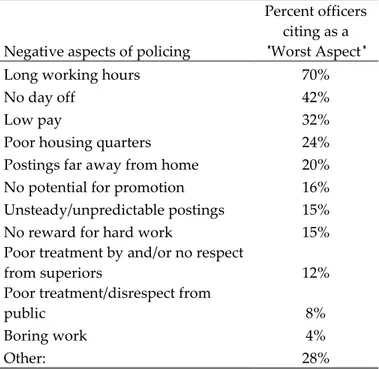
There was substantial variation in the issues cited by the police staff as the negative aspects of their job. Responses to this question are shown in Table 5, in order of the frequency with which a problem was cited as a worst aspect (respondents were allowed to list multiple issues). Many of these issues (e.g. problems with low pay, low-quality housing, or poor promotional avenues) were outside the scope of the police reform project. However, the two most common complaints, long working hours and no day off, were specifically addressed by the project, as were problems related to frequent transfers, which also ranks high among the complaints.
The reviews of case files by retired officers revealed substantial heterogeneity in the quality of investigations of different types of cases. The retired officers gave fair overall scores to the cases they reviewed, averaging 6.18 out of 10 for overall field investigation quality, and 5.91 out of 10 for quality of case documentation. However, these grades were very dispersed: standard errors were 1.95 for field investigation and 2.42 for documentation. More serious crimes induced higher performance from the police: murder cases were rated 1.07 points higher for quality of
investigation (significant at 1%) than other cases in the same police stations, as were rape (+.83 points) and robbery (+.75 points). In general, the case reviews show that the higher the rank of an officer, the better quality his or her field investigation and documentation of evidence in case file. Hence it seems the deficiencies in the police are not purely due to lack of knowledge--when the stakes are high they assign skilled, motivated officers to the case who can perform well-reviewed fieldwork--but rather that this same level of expertise is not applied to all cases. If this is due to the shortage of skilled officers, we might hope that additional training would improve outcome; if the lack of more fundamental organizational incentives are at fault, then the effect of
additional training should be small or nonexistent.
While the use of scientific aids and collection of evidence is crucial to criminal investigations in all countries, in India it is particularly important because of two factors: First, plea bargaining is not permissible under the law and most cases are decided on the basis of evidence and witness testimony. Second, during the long period of trial, witnesses often turn hostile and retract their statements, thereby making physical evidence all the more important. However, the use of scientific evidence is far from universal in criminal investigations in Rajasthan. Only 19% of
23
cases investigated during 2006-2007 and reviewed by our case surveys made any use of scientific investigation, and most of these were accident cases. Scientific investigation was used more in serious cases, particularly rape, and also in cases of forgery .
5. Were the reforms effective?
Against this background, we now turn to the impact of the interventions. Which of them were effective and which were not? We carry out two sorts of analyses: the first, designed to estimate both the reform interventions' effects, as well as the possible Hawthorne effect of being in the control group, uses only data from the endline survey, and includes the “pure control” station (as the omitted category in the regression). We use only data from the endline in this analysis, because by construction, data on the pure control were only collected at that time (to leave them as unaffected as possible). We estimate the effect of the programs on an outcome of
individual from police station using regressions of the form,
where is a vector of binary variables describing the treatment conditions, we include the percentage of the police station staff that were trained , and is a vector of control
variables. In particular, all regressions include district fixed effects (districts include multiple police stations but have a single chief of police), controls for urban/rural location, and the 2005 crime rate to account for the stratified sampling design.
Given the combinations of treatment, the treatment variables could have been parameterized in different ways: this of course does not affect the results, but does affect how the tables must be read and interpreted. The list below summarizes our parameterization choices, and will be useful reference for the analysis below.
24
In study: A dummy equal to one if the station was in any program, or in the control group
that was followed throughout the intervention.
No transfers: A dummy equal to 1 if transfers were frozen in the police stations. Note that
it applies to all stations that received any intervention, except the training program.
weekly off and duty rotation: A dummy equal to 1 if transfers were frozen and the station
got the weekly off and duty rotation intervention but no community observer
community observers: A dummy equal to 1 if the station got the no transfer program and
the community observer program but no weekly off and duty rotation.
All 3 interventions: A dummy equal to 1 if the station got no transfer, community
observers, and duty rotation/weekly off
Percentage trained: Percentage of officers that were trained.
Note that with this parameterization, the treatment police stations are compared to the regular control, while the dummy “in study” indicates the difference between the control group and the pure control group. Further, the “community observer,” “weekly off,” and “all three
interventions” dummies indicate the additional effect of receiving those additional interventions compared to receiving no transfers only. So, for example, to compare a control police station to a police station that received the no transfers and community observers intervention, we need to add the two coefficients. To compare the stations that have received no transfers, duty roster and weekly off, and community observer to those in the control group, we need to add the “no transfer” coefficient and the “all three interventions” coefficients.
Our second approach takes advantage of the police station panel to include fixed effects at the police station level. Here we estimate difference-in-difference type regressions of the form,
where is an indicator for whether the station has begun the reform interventions, and is an indicator for whether the personnel training has been completed at the station by the time observation was collected. The coefficients of interest (reported in the table) are those on the interactions with the treatment vector, . To conserve space we do not explicitly write
25
the full description of the interaction variable into the row labels of the tables when reporting results from regressions with station-level fixed effects. As before, is a vector of controls,
including an indicator for whether the data comes from the endline survey, and denote the police station-level fixed effects. The treatment variables are parametrized as before.
Public Perception of Police
Since the public opinion survey covered a broad range of qualitative indicators, the fourteen major questions on police performance are aggregated into four broad categories in order to simplify the interpretation and guard against false positive results:
A. Responsiveness of police to citizens B. Fear of police
C. Corruption
D. Adequacy of police resources6
6 The questions incorporated into the categories were as follows:
A. Responsiveness of police to citizens: “How do the police behave with normal citizens?” “Do the police help citizens when required?” “How quick is the police response to distress calls by citizens?”
B. Fear of police: “Do you think that citizens like you are afraid of the police?” “Are law‐abiding citizens afraid of the police?” and when asked how the population thinks of the police, replies that they “fear them.”
C. Corruption: “Would you say that the police in your area are generally honest or generally corrupt?” “Is it necessary to pay the police some money in order to get them do their job?” and “Do policemen themselves violate the law than the average citizen?”
D. Amount of police resources: “Do the police have enough personnel to do the work required of them?” “Do the police have enough money and resources to do the work required of them?” “Should the size of the police force be increased, decreased, or stay the same?” and “Do you think that the government should spend more money on the police, even if it means spending less on things like education and roads?”
26
The group outcomes are then analyzed following the approach outlined in Katz, Kling, and Liebman (2007). We first normalize the values of each outcome by the variance of the control group, and jointly estimate all regressions in the group. The group outcome is then the mean of the normalized individual outcome coefficients, with standard errors incorporating the
variances and covariances of the individual coefficients.
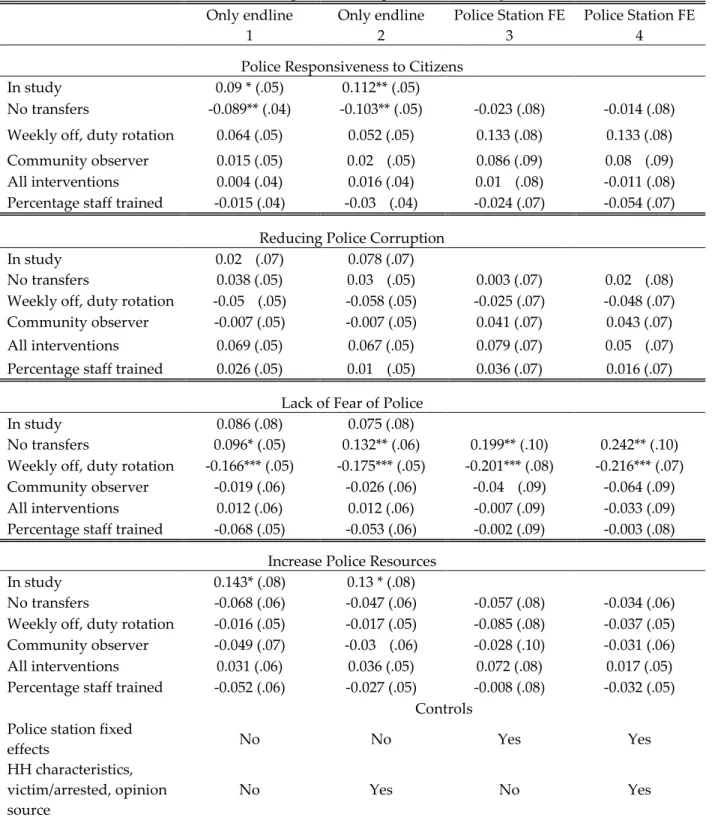
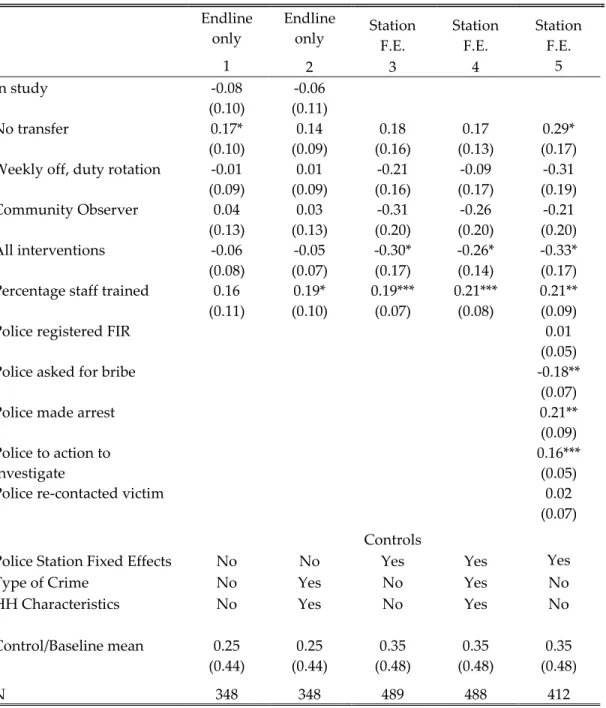
Table 6displays the effect of each reform on each category, with results in columns 1 and 2 limited to the endline data, and those in columns 3 and 4 including the baseline data with police station-level fixed effects. The results are expressed in standardized effect size, with standard errors in parentheses.
Of the 4 categories, the project shows a robustly significant effect across all specifications only in the “Fear of Police” category. The freezing of transfers had a substantial positive effect on decreasing the fear of the police. The reduction in the fear of police was similar in stations which had just the transfers frozen, or transfers frozen and community observers, or all three
interventions. However, the effect was undone in stations which had transfer frozen and weekly off together, but no community observers (recall that stations that had the weekly off programs also had the freezing of transfers: so the station that had both just these programs were similar to the control station).7
The effect of the freeze on transfers might work through a variety of mechanisms. The most likely, given the lack of familiarity with police that the baseline data demonstrate, is that less
7 Appendix Table A3 unpacks the effect on fear of police by examining the effects of all interventions on the individual questions that constitute the fear of police outcome separately. While the signs of all coefficients are the same across questions, the effect seems to be driven primarily by the single question that asks respondents whether they believe that "law-abiding citizens" in general fear the police.
27
frequent transfers allowed the public to become more familiar with the same police staff and hence came to trust them more and fear them less. It is also possible that once the police staff remained in a posting for a longer period of time, their behavior changed with respect to the inhabitants of that area and they became more approachable and less intimidating to the population. Many have written about the importance for the police of knowing their “beat.” The beat system is notionally in place in the Rajasthan police, but the very frequent transfers make it largely inoperative (NPC 50.23). This could also help explain why the duty rotation undid the positive effect of the no transfer policy: in some sense, an explicit policy of duty rotation makes it very difficult to properly enforce a beat system, as it results in duty officers having no attachment to a particular position or neighborhood.8
Victim Satisfaction with Police
The most direct effects of the reform intervention would be found on those citizens who have the most at stake in their interactions with the police: crime victims. Data on crime rates and reports (Table A2) show that there was no effect on the incidence of crime (which was not a target of the operation), suggesting that any effects on victim satisfaction was not a result of a change in the pattern of crimes that they were subjected to. Table 7 shows the results of the project on the probability that the respondent reports being “satisfied” or “completely satisfied” with the police handling of his or her case.
The training program shows a large, robust impact on the satisfaction of crime victims. The effect of going from 0% trained officers to 100% is to raise the probability that victims are satisfied with police investigation by between 16 and 21 percentage points, depending on the specification. Since on average only 39% of victims report being entirely or partially satisfied, these changes
8 It is much less clear why the day off would undo the positive effect of transfer. We show below, however, that the implementation of the day off policy quickly waned over time. The negative interaction is thus more likely to be due to the duty roster.
28
represent a roughly 50% increase in satisfaction. Consistent with the positive findings from the public opinion survey, the estimate of the effect of freezing transfers is also large and positive, although the relatively small sample size implies that it is only marginally significant. And once again, consistent with the results on the fear of police, the weekly day off and duty rotation undoes this positive effect (so that stations that have both frozen transfers and duty rotation are similar to the control group), although the effect is found again in stations that have all three interventions.
The impact of the freeze of transfers (and the decline in this impact with the duty rotation) may operate through the same channel as for the fear of police: because they know their beat and the people in the community better, officers that are transferred less often may be able to treat and serve them better. Once again, frequent rotations may undo this effect.
The effect of the training might operate through two different mechanisms: first, training may affect public perception by changing what the police do, for instance by improving their investigation skills, allowing for faster resolution of the case. Alternatively, the effect of the training may be due to the soft-skills training, which would manifest itself through the way in which the police treat victims and not their investigation actions. We examine these two hypotheses in Table 8and column 5 of Table 7.
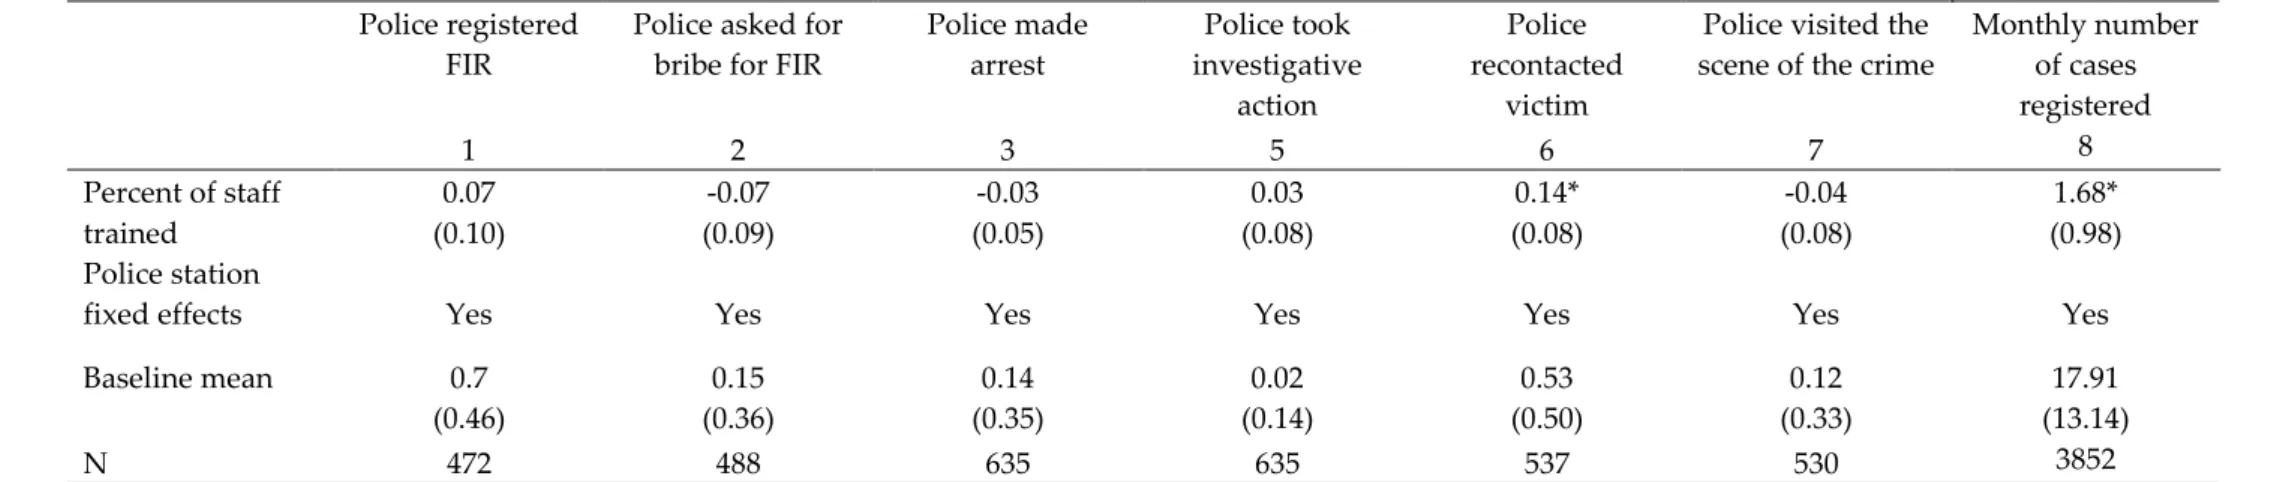
Table 8 presents the effects of the training on other police activities, such as registering cases, asking for bribes, making arrests, or recontacting the victim. We also add variables collected from the official police statistics about the number of cases registered by month. The results support the theory that most of the effects of the training operated through the behavior of the police with crime victims rather than their increased investigative success. Most coefficients are small and insignificant, and the outcomes showing the largest point values--whether the police registered an FIR and whether the police recontacted the victim--are those that might be most affected by the soft skills training. The number of cases registered in the administrative records (column 8) is also significant, and suggests a 9.4% increase in case registration for stations with 100% of staff trained. Those two variables signal the police’s willingness to deal with the case, Recall that lack of interest by the police was an explicit complaint of crime victims in the
29
baseline. Other dimensions of police attitudes towards victims changed in more intangible ways: explicitly including the most frequent of these outcomes in the satisfaction regression in column 5 of Table 7 does nothing to attenuate the coefficient on training (although those variables, not surprisingly, do affect satisfaction).
These regressions impose the restriction that the effect of the fraction of police officers who are trained is linear in the fraction trained, i.e. that when training 50% of officers, the effect is twice as large as when training 25%. In reality, the effect could have been non-linear: for example, it may be necessary to train everyone to see any effect, or it may be sufficient to train a few agents of change. Our design allows us to answer this question, since the fraction of officers trained varied randomly from station to station. Figure 1 displays the coefficients on percentage of personnel trained from a regression like that in column 3 of Table 7
,
with the fraction of staff trained broken down by each randomization category. We find quite strong evidence that the effect is indeed non-linear: the effect of training 25% or 50% of the station staff is close to zero and insignificant. Only when 75% of the staff are trained do we see a 16% increase in victim satisfaction, although this remains insignificant. The largest effect comes only when all police personnel in the station are trained: a highly significant 29% increase in victim satisfaction. These results suggest that police training, or at least police training intended to change attitudes and treatment of the public, must be given to almost all staff in order to take root.Analysis of Decoy Survey
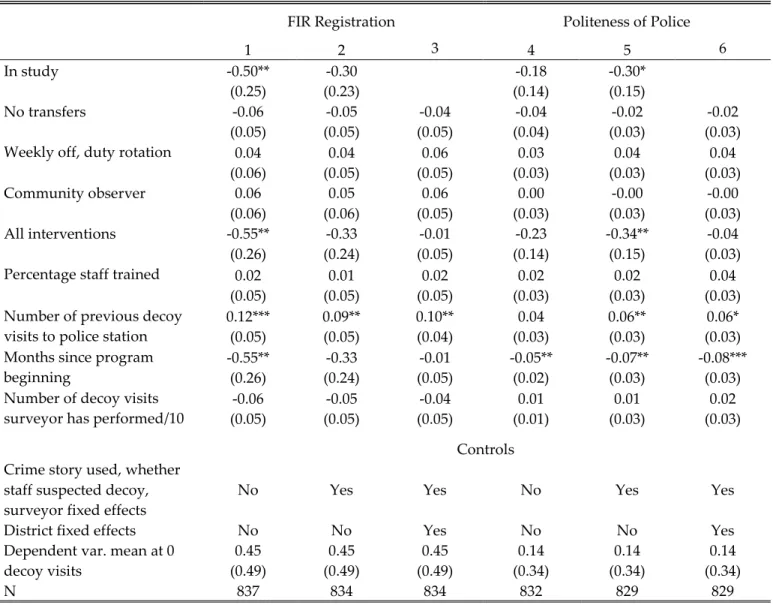
Table 9shows the effect of the various program interventions on the probability that the FIR brought by a decoy surveyor is registered. The first set of three columns show on the percentage of cases that were registered by the police, and the second of three columns show the impact on whether the police were rated as “extremely polite” with the decoy. In all specifications we include the number of months since the program began to capture secular changes in police
30
behavior over time, as well as the number of decoy visits that each surveyor had previously carried out in order to control for surveyors' increased familiarity and confidence with the police.
While the main program interventions show no significant effects on registration, the decoy program itself appears to have a substantial impact on FIR registration.9 Each visit increases the probability of FIR registration at the subsequent visit 6–11%. The effect is especially strong in column 3, which introduces district-level fixed effects. Here the analysis focuses on the districts selected for the program (since stations surveyed in the expansion of the decoy program to outside districts were each only visited once by a decoy, and thus have no within-district variation on this variable), and suggests that the effects of the decoy were particularly strong after several decoy visits. Figure 2 shows these effects graphically, plotting the coefficients on dummy variables indicating the number of preceding decoy visits from a regression otherwise the same as column 1 in Table 9. Similarly, in the columns examining the impact on politeness, no intervention shows any positive effect except for that of the decoy visits themselves, which appear to increase politeness within the districts of the intervention.
Thus, the decoy survey program had a substantial effect on both FIR registration and behavior of the police. This is despite the fact that the program was quite explicitly unlinked to any possible sanction: the police officers were warned that decoys could take place, but that the results would not be communicated to their superiors. Because the decoy surveyors always informed the police that they were being tested if the police actually prepared to register the FIR, the more decoys took place, the more the police officers knew that they were potentially under watch. Moreover, in principle, they were not able to identify the decoy as such: decoys were local people, dressed
9 Since the effect of training on victim satisfaction is non-linear, we have also estimated a speci-fication where the effects of training on FIR registration was nonlinear. There was no effect on that specification either (results available upon request).
31
normally, and reporting very classic types of crime. One can thus extrapolate that registration increased for everyone following the decoy intervention.
This result is consistent with other results in the literature showing the potential of the threat of “top-down” monitoring to improve rule compliance, even within generally corrupt
environments. For example, Olken (2007) shows that, in Indonesia, the fear of audit led to a reduction in corruption on local road projects. In contrast, he finds no impact of an intervention to improve community participation (and similarly we find no effects of the community
observer intervention). Duflo, Greenstone, Pande and Ryan (2011) find that changes in a third party pollution audit program that made the audit system more truthful and effective led to a reduction in pollution levels among firms in Gujarat, India.
6. The Limits of Partial Reforms: Challenges in Implementation
Although the program showed some significant effects after 18 months, two interventions had no positive impact. The combination of the duty rotation and the weekly off even seemed to undo the positive effect of the no-transfer intervention, despite the fact that one should have expected a positive impact of a more rested police force. Some of the possible reasons stem from difficulties encountered during the implementation of the project, and help us think about the conditions for successful institutional reform.
A major roadblock was implementation of the intervention at the local level. A general theme is that the programs that required little collaboration from the station chiefs were more likely to be properly implemented and to succeed. Despite the interest and commitment of senior police leadership of the state, the lack of interest from police station chiefs was frequently evident. The reasons may be manifold: few direct benefits to station chiefs from the intervention, lack of manpower and other resources, or competing priorities such as a violent state-wide ethnic agitation and a series of terror blasts in the state capital that occurred during this period. We present evidence below that as time passed the police stations did not sustain these