Publisher’s version / Version de l'éditeur:
Vous avez des questions? Nous pouvons vous aider. Pour communiquer directement avec un auteur, consultez la première page de la revue dans laquelle son article a été publié afin de trouver ses coordonnées. Si vous n’arrivez pas à les repérer, communiquez avec nous à PublicationsArchive-ArchivesPublications@nrc-cnrc.gc.ca.
Questions? Contact the NRC Publications Archive team at
PublicationsArchive-ArchivesPublications@nrc-cnrc.gc.ca. If you wish to email the authors directly, please see the first page of the publication for their contact information.
https://publications-cnrc.canada.ca/fra/droits
L’accès à ce site Web et l’utilisation de son contenu sont assujettis aux conditions présentées dans le site LISEZ CES CONDITIONS ATTENTIVEMENT AVANT D’UTILISER CE SITE WEB.
Paper (National Research Council of Canada. Institute for Research in
Construction), 1994
READ THESE TERMS AND CONDITIONS CAREFULLY BEFORE USING THIS WEBSITE. https://nrc-publications.canada.ca/eng/copyright
NRC Publications Archive Record / Notice des Archives des publications du CNRC :
https://nrc-publications.canada.ca/eng/view/object/?id=578dc78f-9ddd-4907-9fce-8f1b9aa8afe7
https://publications-cnrc.canada.ca/fra/voir/objet/?id=578dc78f-9ddd-4907-9fce-8f1b9aa8afe7
NRC Publications Archive
Archives des publications du CNRC
This publication could be one of several versions: author’s original, accepted manuscript or the publisher’s version. / La version de cette publication peut être l’une des suivantes : la version prépublication de l’auteur, la version acceptée du manuscrit ou la version de l’éditeur.
For the publisher’s version, please access the DOI link below./ Pour consulter la version de l’éditeur, utilisez le lien DOI ci-dessous.
https://doi.org/10.4224/40001446
Access and use of this website and the material on it are subject to the Terms and Conditions set forth at
Effect of automatic sprinkler protection on smoke control systems
Effe c t of a ut om a t ic sprink le r prot e c t ion on sm ok e c ont rol syst e m s
N R C C - 3 6 8 6 6
M a w h i n n e y , J . R . ; T a m u r a , G . T .
J a n u a r y 1 9 9 4
A version of this document is published in / Une version de ce document se trouve dans:
ASHRAE Winter Meeting, New Orleans, LA, USA, January-23-26, 1994, pp.
494-513, 94
http://www.nrc-cnrc.gc.ca/irc
The material in this document is covered by the provisions of the Copyright Act, by Canadian laws, policies, regulations and international agreements. Such provisions serve to identify the information source and, in specific instances, to prohibit reproduction of materials without written permission. For more information visit http://laws.justice.gc.ca/en/showtdm/cs/C-42
Les renseignements dans ce document sont protégés par la Loi sur le droit d'auteur, par les lois, les politiques et les règlements du Canada et des accords internationaux. Ces dispositions permettent d'identifier la source de l'information et, dans certains cas, d'interdire la copie de documents sans permission écrite. Pour obtenir de plus amples renseignements : http://lois.justice.gc.ca/fr/showtdm/cs/C-42
N0-94-12-3 !RP-6Tll
EFFECT OF AUTOMATIC SPRINKLER
PROTECTION ON SMOKE CONTROL SYSTEMS
J.R. Mawhinney, P.Eng.
Member ASHRAE
ABSTRACT
A series of experiments on the interactions of sprinklers with shielded fires and the corresponding effects on a zoned smoke control system was conducted. Testing involved two phases. In the first phase, large wood crib fires were conducted in a one-story test room equipped with sprinklers. The centers of the cribs were shielded from direct impinge-ment by water spray so that burning continued in spite of the sprinklers. The room was instrumented so that fire conditions, including heat release rate,· heat flux to walls; ventilation rate,· temperature profiles; oxygen, carbon dioxide, and carbon monoxide concentrations,· and buoyancy pressures, could be closely measured. Sprinkler discharge rates were also measured and converted to spray densities. The tests in the one-story room provided fundamental infonnation about the interaction of sprinklers and partially suppressed fires, and the results were used for the design and interpretation of a second phase of testing.
In the second phase of testing, shielded wood crib fire tests were conducted on the seventh floor of a 1 0-story experimental tower. The tower was set up to act as a zoned smoke control system, with mechanical exhaust of the fire floor and positive pressurization of the floors above and below the fire. The stairshaft was not pressurized, although it represented one of the zones to be protected against smoke entry. The tests demonstrated that a shielded, sprinklered fire will continue to burn at a reduced heat release rate until the fuel within the shielded area is con-sumed, producing smoke for the duration of the fire. Concentrations of carbon monoxide in the smoke may be dangerously high, depending on ventilation conditionsofthe fire. Radiant heat and temperatures were reduced to nonhazardous levels. Fire-induced buoyancy pressures were very low relative to the pressurization used to protect adjacent zones. Although the zoned smoke control system prevented smoke spread to adjacent pressurized floors, it did not prevent smoke spread into the stairshaft after the door to the fire floor was opened unless the stairsluzft had
been prepressurized by the opening of other doors. With the zoned smoke control system shut off, the buoyancy pressures were sufficient to cause smoke spread into adjacent zones.
G.T. Tamura, P.Eng.
Life Member ASHRAE
This paper discusses implications of the test results for the design of zoned smoke control systems and identifies areas for further research.
INTRODUCTION
The opinion is sometimes stated in the fire protection community that buildings protected by automatic sprinkler systems do not need smoke control because sprinklers limit fire growth, minimize fire size, and limit smoke production to negligible levels. Another significant opinion is that automatic sprinkler protection has a beneficial effect on a smoke control system, reducing airflow rates and pressure differentials needed to achieve effective smoke control. Countering these opinions are statements to the effect that sprinklers worsen smoke conditions in a building by increasing the amount of smoke produced and causing it to descend to floor level, where it reduces visibility. In the absence of experimental data, it is difficult to support or disprove any of these opinions.
Little work has been performed on the effect of auto-matic sprinkler protection on smoke control systems. Work that has been identified in the literature as pertinent to the questions of smoke control in sprinklered buildings falls into three general categories: numerical modeling of the interaction of sprinkler sprays and a fire plume or hot gas layer; the effect of roof venting on sprinklered buildings, including shopping malls; and full-scale testing of smoke control systems in sprinklered buildings.
In the first category, studies of the interaction of the automatic sprinkler spray and the fire or plume have been reported (Alpert 1984; Alpert and Delichatsios 1986; Chow 1988, 1989; Chow and Fong 1988, 1990; Gardiner 1988). These authors report on efforts to model the cooling effect of water sprays moving through a hot gas plume or layer. Gardiner (1988) reports on a mathematical model that examines the effects of many variables on the transfer of heat from the buoyant layer. The model output includes the thermal and physical histories of individual drops within each spray envelope, the effect of sprinklers on the buoyant layer as it passes through individual spray envelopes, and the consequence of sprinkler operation on the egress of Jack R. Mawhinney and George T. Tamura are senior research officers at the National Fire Laboratory, Institute for Research in Construction, National Research Council Canada, Ottawa, ON.
THIS PREPRINT IS FOR DISCUSSION PURPOSES ONLY, FOR INCLUSION IN ASHRAE TRANSACT10NS.!994, V. 100, Pt. 1. Not to be reprinted in whole or in
part WlthoLC ¥ttten perm1ss100 ol the Amencan Sociely ol Heating, Refrigerating and Air .Conditioning eョァQセL@ Inc., 1791 I ulie Circle, NE, Atlanta, GA 30329.
Optmons, find1ngs, concll.8100S, or イセュ・ョ、。エゥッョ。@ expr98Sed in this paper are those o1 the al.ihor(s) and do not necessarily reflect the vi9WS o1 ASHRAE. Written
smoke from the building. Studies such as these contribute to a quantitative understanding of the interaction between sprinklers and the buoyant layer. They are theoretical, however, and most have not yet been validated by full-scale testing.
In the absence of full-scale test data on the maximum fire size to be expected in a sprinklered office building, Morgan and Hansell (1985) conducted a review of British fire loss statistics. Their objective was to identify' a "design fire" size for use in designing smoke ventilation systems for atria in sprinklered and unsprinklered buildings. Their review indicated that the maximum heat release rates and areas of fire involvement in sprinklered buildings were much lower
th8n
in unsprinklered buildings. Fires in sprinklered buildings were estimated to have attained beat release rates between 285 and 2,850 Btu/s (300 and 3,000 kW) before being extinguished by the sprinklers, with the probability of occurrence of smaller fires much higher than for larger fires. This study supported the British design practice for smoke control systems of assuming a 5-MW design fire under sprinklered conditions, with an area of 10 m2. Morgan and Hansell's information is a useful starting point for examining the question regarding the likelihood of occurrence and size of shielded fires in sprinklered build-ings.Gustafsson (1989), Heskestad (1974), Hinkley (1989), and Battrick (1986) report on the long-standing controversy between sprinkler and ventilation experts about whether or not ventilation of bot gases from a sprinklered building through roc)f vents during a fire is beneficial to the control of the fire. Sprinkler experts argue that automatic smoke vents detract from proper performance of the spririkler system. Smoke ventilation specialists, in tUm, argue that reduced smoke logging of the building improves interior firefigbting and reduces smoke damage. Although some full-scale studies have been done (Gustafsson 1989), エィセケ@
are usually based on either a one-story warehouse building or a shopping
mall,
with roof vents, and are therefore not immediately useful for analyzing the impact of sprinklers on an operating zoned smoke control system in a high-rise building.Two notable exceptions to the shortage of full-scale experimental work involving sprinklers and smoke control measllres are studies conducted by the Seattle Fire Depart-ment in an office building (Seattle FD 1984) and by Klote at a hotel in Washington, DC (Klote 1990). The Seattle work looked at fire pressures generated by sprinklered and unsprinklered fires; carbon monoxide generated by sprink-lered, shielded fires; and the performance of three smoke control approaches: stairwell· pressurization, elevator shaft pressurization, and zoned smoke control. The Seattle study concluded that sprinklers were indeed effective in reducing fire pressures and thereby improved the likelihood that smoke control systems designed to current standards (for assumed nonsprinklered conditions) would prevent smoke spread. There was no suggestion that design standards could be reduced for sprinklered fire conditions. Problems of loss
of stair pressurization on opening of doors, with subsequent contamination of the stairshafts, were noted. The results provide a useful starting point for further validating studies. Klote (1990) studied nonsprinklered fires with smoke control and sprinklered fires without smoke control in a serieS of full-scale tests in a b9tel in Washington, DC, which was destined to be demolished. He noted that fire pressures were very low in the sprinklered fires and would not likely pose a challenge for a smoke control system designed to meet current standards (Klote and Milke 1992; NFPA 1988). Klote (1990) noted that more tests would be required, however, to determine how operation of the smoke control system in the sprinklered fires would have changed smoke spread beyond the fire floor. He also noted that, for sprinklered fires that are not rapidly extinguished, smoke production could be significant and smoke control could be useful.
The ability of sprinkler systems to control and extin-gUish unshielded fires is well established (Richardson 1983; Walton 1988; Madrzykowski and Vettori 1992). In response to Klote's concerns about shielded fires, however, it was decided to pay particular attention to fires that could not be extinguished immediately by· the sprinklers and that would result in sustained smoke production under cool conditions. On the basis ofKlote's ウオァァ・ウセゥッョウ@ for further research, the Technical Committee (TC 5.6) on Fire and Smoke Control of the American Society of Heating, Refrigerating and Air-Conditioning Engineers, Inc. (ASHRAE), agreed to provide funds for research to investigate the effects of sprinklers on the performance of a zoned smoke control system. The National Fire Laboratory of the Institute for Research in Construction at the National Research Council of Canada also セ、・、@ the project.
EXPERIMENT DESCRIPTION
A series of experiments involving shielded, sprinklered fires was conducted at the National Fire Laboratory's full-scale fire test facility located near Ottawa, Canada. The facility consists of a very large Bum Hall, in which a one-story fire test room was constructed, and a 10-one-story experimental tower (referred to as the Tower). Both the Tower and the one-story test room were used to carry out the testing for this project.
One-Story Test Room
A one-story fire test room (Figure 1) was constructed inside the Bum Hall, equipped with sprinklers and instru-mented wiQl pressure, temperature, and gas analysis equip-ment. A products-of-combustion collector attached to the test room allowed oxygen calorimetry to be used to measure the beat release rates of sprinklered fires. The room measured 20ft by 20ft by 12ft (6.1 m by 6.1 m by 3.6 m) with an 。セ」「・、@ corridor that was 20 ft long by 8 ft wide by 12 ft high (6.1 m by 2.4 m by 3.6 m) on one side. The corridor セッオャ、@ be pressurized independently of the test room
North
セMMMM Exhaust-,
opening \ 30' sーイゥョォャ・イウセ@ セ@1
'I hセMB@
\_20' ! 20' XBセ@
14.1' ·X'
' j_ ' Combustion air inlets at floor level(
'
PLANVIEW
' 8't
....
0 "'0)
.E
0'
u
12 I"
1.75' \ Products of combustion collector & calorimeterExhaust opening
1.5'..--
セ@I
/-9.6'---.,
ELEVATION (East Wall)
Figurtl
Plan and elevation of the ッョ・セウエッイケ@ test room.so that direct observations of the pressure differences required to prevent smoke movement from one zone to the other could be made. In addition, ventilation air-to the fire was provided through an air delivery system that could either inject air into the heart of the wood crib or into the room from the base of one wall. The room was instrument-ed with thermocouple trees, each with eight thermocouples distributed between floor and ceiling. Sheet metal shields were installed over each thermocouple bead to prevent direct imp'"mgement by water droplets. Pressure probes were located at four セャ・カ。エゥッョウ@ on one wall, each probe equipped with a specially designed perforated cap to prevent water from entering the tubing. A products-of-combustion collec-tor and exhaust duct was mounted over the wall opening to the room so that all room gases could be collected and sampled for concentrations ッヲセN@ C02, and CO; thus heat release rates could be measured by oxygen depletion calorimetry.
A
scale platform was installed so that mass loss rates of burning wood cribs could be measured. A separate gas analysis line located 3.25 ft (1.0 m) below the ceiling, at the level of the center of the wall opening, was used to measure 02, C02, and CO concentrations in the hot gas layer-in the fire room. Heatflux
meters were mounted5 ft (1.5 m) above the floor at the midpoint of three of the walls. These were shielded from direct water impingement by sheet metal bonnets that extended 6 in. (150 mm) from the wall.
Ten-Story Tower
The fully instrumented 10-story tower (Figure 2) used for the Tower experiments was designed
to-
represent conditions of a high-rise, multizone smoke control system.Instrumentation for measuring smoke movement in the Tower is well documented in Tamura and Klote (1988). The seventh floor of the Tower was "fire hardened" and equipped with sprinklers so that 600-lb (272-kg) shielded wood cribs .could be burned under sprinklered conditions. It was not possible in the Tower to collect all the products of combustion for oxygen calorimetry. Instead, the wood crib was mounted on a weighing platform so the crib mass loss rate could be measured and correlated with heat release rates measured in the tests in the one-story fire test room. The floors above and below the fire floor were pressurized using the building's air supply system, and the fire floor was exhausted via an independent exhaust shaft to create a "pressure sandwich," or zoned smoke control system, with the fire in the low-pressure zone. The setup of the zoned smoke control system met the intent of Klote and Milke (1992) and NFPA (1988).
Fuel Loading and Shielded Fires
The purpose of these experiments was to evaluate the effect of sprinklers on conditions pertinent to the design of smoke control systems when a fire is not immediately extinguished by the sprinklers, i.e., under shielded fire conditions. Wood cribs were constructed and covered with a solid top layer in order to create reproducible fuel packages that would bum for extended periods at relatively steady burning rates. With a sustainable and responsive fire, sprinkler performance conditions could be varied several times during a test and the effects measured.
. A secondary consideration in selecting fuel packages for experimentation was to represent a range of fuel conditionS typical of office occupancy. Office occupancies,
r
48'....
AirServ.
Elev.
12.8'
Elev.
F1oor
AreaI
{
1
. . . North_Warersupp
y 0Shaft
Shaft
Vestibule
"1::7
Supply
·e
0Shaft
u
.,...,セ@
Air
0'1 Nz
Exh.
Shaft
West Conidor
Notes:*
=
pendent sprinkler ViewingArea
Figure2
Plan of the 10-story tower, seventhfloor.including data-processing areas, are listed. as "light hazard" inNFPA Standard 13. That is, "quantities and/or combusti-bility of contents are low and fires with relatively low rates of beat release are expected" (NFPA 1991). No values are stated in NFPA Standard 13 to quantify what conStitutes a "relatively low" beat release rate (HRR), ·which is not surprising, given that it depends on the specific occupancy an:d compartment conditions. Various authors have treated wood cribs as representative of light hazard fuel packages (Walton 1988; Madrzykowski and Vettori 1992). A wood crib cannot completely simulate "real" burning conditions, however, in that the fuel is concentrated in a limited·area rather than· distributed over a large space. All of the fuel within the crib can bum at once, whereas fuel distributed qver a larger area will bum sequentially as fire spreads from one object to another .. For test purposes, it was practical to use wood cribs that produced an HRR represen-tative of a typical office workstation in which a certain mass of fuel is concentrated within a relatively small area. Madrzykowski and V ettori ( 1992) tested typical office workstation fuel packages consisting of a desk, table, padded chairs, boxes of paper partially shielded under the desk, etc., weighing a total of 639 lb (290.5 kg). Average heat release rates during unsuppressed burning of this fuel package were reported to be approximately 570 Btuls (600 kW), with several peaks as high as 1,235 Btu/s (1,300 kW) as various components of the package ignited sequentially. Madrzykowski and Vettori's workstation HRR results can be used as a benchmark for comparison with the wood crib fires used in these tests.
Wood cribs of two sizes were used in these experi-ments.· In the 10-story tower, cribs weighed approximately 600 lb (272 kg). The unsprinklered beat release rate from
these cribs was measured at 1,150 Btu/s (1,200 kW). They were 66 lb (30 kg) heavier than the workstations described in Madrzykowski and Vettori (1992); however, the exterior rows of wood in the cribs, which were wetted by sprinkler spray, did not bum. The actual weight of fuel consumed by fire was typically 350 lb (160 kg), or about 50% of the initial crib weight (Mawhinney et al. 1992). These wood cribs compare reasonably well to the light hazard fuel loadings representative of an office occupancy described in Madrzykowski and Vettori (1992).
In the tests in the one-story room, larger wood cribs were used, typically weighing 1,200 lb (545 kg). Again, not all of the fuel could bum because of wetting of the wood on the outer edges of the crib. Unsuppressed, and with the maximum ventilation that could be provided in the one-story room, a peak beat release rate of 2,850 Btu/s (3,000 kW) was measured for these cribs. Most of the tests weie conducted at less than full ventilation conditions, however, which limited the beat release rate of an unsuppressed fire to 1,900 Btu/s (2,000 kW). These cribs did not represent a light hazard fuel loading, but, as stated earlier, the セイゥュ。イケ@
objective of the testS in the one-story room was to evaluate the nature of the interaction between sprinklers and the fire. This co.uld be dqne by creating a fire that could be sus-tained at relatively steady-state conditions for a long time, while ventilation and sprinkler density were varied.
Wood. cribs were cOnstructed using 3.5-in. by 3.5-in. (90-m.m by 90-m.m) dry white pine sticks, spaced 3.5 in. (90 mm) apart and piled 10 rows (36 in. [0.91 m]) high. In the one-story room, sticks were 70 in. (1. 78 m) long; in the tower, 48 in. (1.22 m) long. The total mass of wood in the cribs in the one-story room was typically 1,200 lb (545 kg); those in the Tower were on·l!verage 700 lb (320 kg).
In ッイ、セイ@ to create a fire shielded from the sprinkler spray, twice as many sticks were used in the top row as other rows to form a solid barrier to prevent sprinkler water from penetrating. The top row was then capped with a sheet of 3/4-in. (19-mm) plywood so that water could not drip between sticks. In this .way, the 3.5 in. (90 mm) thick timbers prevented the fire from burning through the plywood from the underside, and the plywood prevented water spray from penetrating the wood crib. All of the wood under the shielding and inside the outermost sticks was available for burning because the crib would remain standing, supported by the outer shell created by the unburned sticks. Fires could be sustained at partially suppressed burning rates for 60 to 75 minutes or more, allowing the sprinkler spray densities to be varied at different times during the progress of a test.
Sprinkler Protection
In the one-story test room, two sprinklers were in-stalled 14.1 ft ( 4. 3 m) apart diagonally over the comers of the crib. With the sprinklers operating across the diagonal, all four sides of the crib were equally exposed to the spray. The coverage area was 200 ft2 (18.5 m2) for each sprinkler. At the listed minimum operating pressure of 7 psi (48 kPa) for the sprinkler, each would discharge 14.8 gpm (56 L/min), for which the theoretical spray density was 0.074 gpm!ft2 (3.0 L/min/m2). This was therefore the minimum density tested in the one-story room.
In the . the Tower tests, the sprinklers were located 11.15 ft (3.4 m) apart across the diagonal of the crib, with a coverage area of 125
ft
2 (11.6 m2) each. At the discharge rate of 14.8 gpm (56 L/min) dictated by the minimum operating pressure of 7 psi (48 kPa), the spray density was 0.12 gpm/ft2 (4.9 L/min/m.2). The operating pressure was further reduced in two tests to 6 and5
psi ( 41 and 34 kPa) to obtain densities of 0.-11 and 0.10 gpmfft2 (4.4 and 4.1 L/min·m2), respectively. Although it is possible that the spray-drop size distributions at these lower pressures were different than at 7 psi, their effects on fire conditions were considered to be of interest.For purposes of these tests, it was assumed that the sprinklers closest to the fuel would have the greatest effect in extinguishing the fire. As has been described, two sprinklers immediately over the crib were used. Oriented across the diagonal, the top and all four sides of the cribs were exposed equally to the spray, with little or no horizon-tal projection of spray into the inner parts of the crib. It is recognized, however, that in a real fire, if the fire gases are not cooled sufficiently by the first sprinklers, additional sprinklers outside the first zone of influence would activate. These would contribute to additional cooling so that temperatures on the fire floor could be expected to be much less than the activation temperature for the sprinklers. Furthermore, in at least some cases, sprinklers located beyond the spray radius from the fuel can contribute to suppression of the fire (Liu 1977).
In these tests with only two operating sprinklers, extin:. guishing effectiveness was less and gas tel)lperatures were higher than would be expected in a completely sprinklered compartment. By testing at such limits, the minimum effectiveness of the sprinklers on temperatures and heat release rates was being examined. The purpose of conduct-ing suppression tests at the lower limits of sprinkler performance was to reveal as clearly as possible the threshold of control/partial control/no control. In this way, the relative differences between various benefits of sprin-klers could be distinguished.
Using the one-story test room and the seventh floor of the Tower, experiments were conducted to investigate the effects of automatic sprinklers on the conditions of tempera-ture, pressure, and oxygen, carbon dioxide, and carbon monoxide levels in a building under fire conditions and to assess the effect that changes in these conditions might have on the performance of a zoned smoke control system. The effects were measured for standard and quick-response automatic sprinklers in an assumed office occupancy and for a 'range of conditions of. fire severity.
Detailed descriptions of the test facilities, the tests, and a discussion of the results are presented in Mawhinney et al. (1992). The present paper summarizes the findings from both sets of experiments with respect to burning rate, room temperatures, radiant heat, buoyancy pressures, gas concen-trations, and smoke spread. This paper also discusses the implications of the findings for the design of zoned smoke control systems in sprinklered buildings.
EXPERIMENT RESULTS
Effects of Sprinklers on the Heat Release Rate of Shielded Fires
The heat release rates (HRR) of the 'shielded, dry, white pine wood cribs used in tests in both the one-story room and the Tower depended primarily on three factors: the size of the crib, the ventilation rate, and the sprinkler spray density. Because of their large size, fire could be sustained in the cribs for extended periods, making it possible to compare the effects of changes in ventilation rate and spray density on beat release rate.
In the tests in the one-story room, it was possible to control ventilation so that the effects of changing sprinkler spray density could be distinguished from the effects of changing the ventilation. Oxygen calorimetry was used to measure the amount of oxygen consumed by the burning process, from which it was possible to calculate the rate of heat release (Janssens 1991). Calorimetry results were correlated with simultaneous measurements of mass loss rate of the burning crib, using a factor of 115 Btu/s per Ibm (16 kW per g/s) of wood burned obtained from Drysdale (1985). As there was reasonable agreement in the one-story .
tests between the computed heat release rate based on oxygen calorimetry and that determined using the measure-ments of mass loss, the same factor was used to deterniine the heat release rate of the wood cribs in the Tower tests.1 Tests were conducted with no sprinklers, with sprin-klers and shielding, and with sprinsprin-klers and no shielding. In the otie test without sprinklers, which was conducted in the one-story room, the fire in the 1,200-lb (545-kg) crib attained an HRR of more than 1,900 Btu/s (2,000 kW) under limited ventilation conditions of 1,000 cfm (0.42 m3/s). By increasing the ventilation rate to 1,500 cfm (0.63 m3/s), the HRR increased to 3,000 kW. No unsprinklered case was tested in the Tower, but it is estimated from burning rates observed during periods when the sprinkler spray was turned off during the course of the test that the 700-lb (318-kg) cribs would have had an HRR of 1,150 Btu/s (1,213 kW) under unsprinklered conditions.
Several tests were conducted using fast-response sprinklers (listed for office occupancies), which operated 30 to 50 seconds faster than standard sprinklers. Normally, faster response would be a significant advantage for fire suppression because the HRR of the fire is smaller earlier in the fire growth, hence the fire is easier to extinguish. The advantage was soon dissipated, however, for shielded fires. After an initial slowing of the burning rate, within several minutes the fire within the shielded area regrew to the same size it achieved with standard sprinklers.
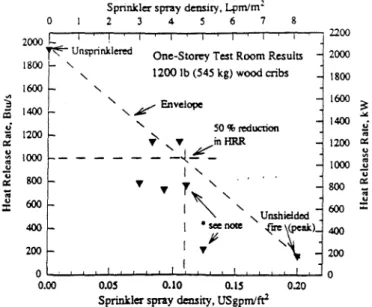
Ten tests were conducted with shielded cribs-five in the Tower and five in the one-story test room. Because of the sustained burning of the substantial wood cribs, it was possible to vary the water spray density and note the new equilibrium burning rate several times during the course of a test. Figures 3 and 4 show plots of heat release rate versus sprinkler spray density for the tests in the one-story room and the Tower, respectively. In Figure 3, six points are shown for the shielded fires in the one-story test room . at. a ventilation rate of 1,000 cfm (0.472
nf
/s) because more than one steady-state condition could be achieved during the burning of a single large crib. The relationship between spray density and HRR was not unique-it depend-ed on the time at which the spray density was changdepend-ed during セ・@ burning of the crib. Applied early in the fire groWth, before all the surfaces within the crib were charred and glowing, the spray could hold the fire to about 800 Btu/s (842 kW) for more than 15 minutes. The same density applied later in the course of the fire, withwell-1 An uncertainty analysis, applied to the measurements and equations used to calculate the heat release rate from oxygen consumption measurements, indicated that there is an uncertainty of 12% in the computed heat release rates. The presence of significant amounts of water in the products of combustion increased the uncertainty in the oxygen consumption calculations. The mass loss rate of the burning cribs was measured with an accuracy of
±
2%, although the combined effects of mass loss due to burning and evaporation and mass gain due to the constant spray of sprinkler water onto the crib complicated interpretation of the mass loss measurements. The overall uncertainty in the heat release rates was estimated to approach 15%."'
=
Iii .; ;;; Cl: セ@ "' u u Cl:...
u=
0Sprinkler spny density, Lpm!m2 2 3 4 s 6 7 8 2000 '
セ@ Unsprinldered One-Storey Test Room Results
ZZセ@
'
'
1200 lb (545 kg) wood cribs' '
'-/Envelope 1400'
50 % reduction 1200Y',
"f' /inHRR 1000- - - -
4.
-I ' 800...
...
.,,
'
. ''
600 I ' , Unshielded 400 I • see llOie {R \ ) 200 INLセ@
' I 0 0.00 0.05 0.10 0.15 0.20 Sprinkler spny density, USgpmlrtl2100 2000 1800 1600 1400 1200 1000 800 600 400 200 0
• Note: HRR at a given deiiSUy dcpeads oa mge of fm:: development prior to application of Willa' spray. See discussion in teXt.
セ@
...
.; ;;; Cl: セ@..
u u Cl:..
=
Figurt 3 Effect of sprinklers on heat release rate, results from one-story test room.
0 1200 1100
'
1000 900..
=
ai 800 .; 700 セ@ Cl: u 600"'
..
.,
500 u Cll:-
..
u 400=
300 200 100 0 0.00 Figurt4Sprinkler spny density Lpmlm2 2 3 4 5 6 7 8
1200
'
Tower Test Results'
650 lb (295 kg) wood cribs !100'
' '
1000'
900'
,/Envelope セ@...
'
800 i'
50 % reduction'
' I / inHRR 700 Cl:..
u- - - -
-·-
....
... セ@-
600..
..
uセ@
'
u'
500 Cl: I'
...
;;; 400 u'
'
=
'
300 "f'Unshielded 200 (peak) 100 0 o.os 0.10 O.IS 0.20Sprinkler spny density USgpmlrtl
Effect of sprinklers on heat release rate, results from 1 0-story tower.
established burning on all internal surfaces; only reduced the HRR to about 1,150 Btu/s (1,200 kW). The scatter in the points plotted in Figure 3 is therefore explained by the fact that the preceding history of the fire affected the HRR achieved by a given density. In order to illustrate the evident trend, the relationship between spray density and HRR is conservatively enveloped by the diagonal line shown in Figure 3. The envelope illustrates that as spray density increased, fire intensity diminished.
Figure 4 shows the same relationship as Figure 3 between spray density and heat release rate for the Tower tests. There is less scatter in Figure 4 than in Figure 3
because each data point represents an early stage in the fires, such that the preceding histories of the crib fires were more comparable than in the tests in the one-story room. Again, the dashed diagonal line linking the unsprinklered to the sprinklered-shielded points shows a strong relationship between the spray density and the HRR of a fire.
From the dashed line in Figure 3, it can be conserva-tively estimated that the HRR of the fires would be reduced to less than 50% of the nonsprinklered rate at an approxi-mate density of 0.11 gpmlft2 (4.5 Llmin·m2). That HRR (for the 1,200-lb crib) was about 975 Btu/s (1,025 kW). For the 700-lb (318-kg) wood cribs in the Tower tests (Figure 4), the same 50% reduction in HRR (to 570 Btu/s [600 kW]) occurred at a density of 0.13 gpmlft2 (5.3 Llmin·m2). It is noteworthy that the reduced, sustained heat release rates at comparable densities were in proportion to the mass of fuel within the shielded area.
Two tests, one in the one-story room and the other in the Tower, were conducted with the shielding removed so that the sprinkler spray could extinguish the fires. In both cases, the fires were extinguished in less than 12 minutes. The HRR values shown in Figures 3 and 4 for the un-shielded fires were peak values, measured just before sprinklers activated, which then reduced to zero as the fire was extinguished.
This leads to the question of what level of fire control is expected from a typical sprinkler system designed to meet NFPA Standard 13 (NFPA 1991). That standard distin-guishes between "fire control" and "fire suppression" and recognizes that the sprinkler system is deemed to have achieved .fire control if it limits the size of the fire, decreas-es the HRR, and controls ceiling temperaturdecreas-es. The limits on the size of the fire (area) are not stated but clearly will be some fraction of the "design area," which is the area protected by the maximum number of sprinklers permitted (by the NFPA Standard 13 design criteria) to open. The control over ceiling temperatures also relates to the design area: combtistion gases must be cooled within its boundary so as not to activate sprinklers outside the design area. The intended degree of control over the heat release rate can then be inferred: the HRR must be small enough that gas temperatures higher than the sprinkler temperature rating do not spread outside the design area.
These experiments demonstrated that sprinklers substan-tially reduced the heat release rates of the wood crib fires, even though they were operating at lower spray densities than would be normal for such fuel loads. They also demonstrated that the magnitude of the heat release rate depends on the amount of fuel present within the shielded area and that the fuel within that area will continue burning . until it is mostly consumed. Knowledge of the maximum area of shielding possible in a sprinklered building (exclud-ing a gross error in the system design) and the weight and type of fuel likely to be held within the shielded area could be used to estimate the maximum heat release in a sprink-lered, shielded fire.
It was mentioned earlier that the statistical review done
by Morgan and Hansell (1985) concluded that fires in a sprinklered office building were likely to be between 285 and 2,850 Btu/s (300 and 3,000 kW), with a higher proba-bility of occurrence of fires in the low end of the range. The results of this series of full-scale tests indicate that shielded fires with heat release rates as high as 975 Btu/s (1,025 kW) are possible, depending on the amount of fuel and the sprinkler density. The wood cribs in these tests, however, particularly in the one-story room, represented a substantial fuel mass arranged in an ideal burning forma-tion. Yet, only two sprinklers, operating at minimum densities appropriate for their listing, kept the HRR below
950 Btu/s (1,000 kW). These measurements suggest that shielded fires in sprinklered office buildings are likely to have heat release rates below 950 Btu/s (1,000 kW). The results also imply that for an occupancy in which shielded fires are a possibility, design densities higher than the minimum recommended values for unshielded conditions would be beneficial.
Effects of Sprinklers on Heat Aux to Surroundings
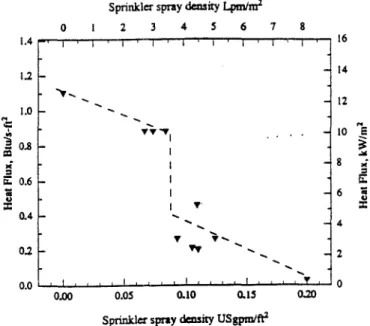
Figure
5
shows the intensity of radiant heat energy in the one-story test room, approximately 6.5 ft (2 m) from the wood crib, at mid-height of the room, measured at different spray densities. In addition to removing convective heat energy from the hot gases given off by the fire, sprinklers reduce fire severity by absorbing radiant heat energy in the fire compartment. In an unsprinklered fire, heat radiates from the visible flaines and from the hot gas layer that develops in the upper portion of the room. This radiant heat reflects from surrounding surfaces back to theSprinkler spray density I..pmlm2
0 2 3 4
s
6 7 8 1.4 ... l_,..-,...-,1--r---r--,-.,..-.,...,-,.,...--,l--r"-.,...,l-..,..-1,..., 16 1.2 1-セ@ .... 1.0 1-.... .:;:..
"E
o.s-=
,;=
li: 0.6-;j"
:X: 0.4 10.2 -0.0 0.00FigureS
-
14 12 ..,T"TI ' '-
10 "'e セ@ I...
I - 8 ,;=
li: - 6 ;j"
..,.
:X: - 4 ......,
.., ........
2 I ..., 0o.os
0.10 0.1!1 ().20Sprinkler spray density オウセ@
Heat flux at mid-height on the south wall of the one-story test room versus sprinkler spray density.
fire source and contributes to increasing セ・@ burning rate (Alpert and Ward 1983). If the beat flux is high enough, combustible materials will ignite, or vulnerable surfaces, such as windows, could be broken. Alpert and Ward (1983) report that a radiant flux of about 1. 8 Btu/s·
ft2
(20 kW 1m2) will cause most combustible materials to ignite from any small pilot flame within a few minutes. Certain plastics will ignite at lower flux levels. Furthermore, tempered glass is likely to break at a beat flux greater than 1.8 Btu/s·ft2 (20 kW/m2) (Kim and Lougheed 1990). It is advantageous, therefore, to reduce the intensity of radiant beat energy in the fire compartment.Figure
5
demonstrates that the radiant beat at the location of the heat flux meter was measured at about 1.1 Btu/ft2 (12.5 kW/m2) for the unsprinklered fire. Although not high enough in itself to have readily ignited most materials, it is the magnitude of the reduction in beat flux caused by the sprinklers that is of interest. Even in a controlled situation, sprinklers were effective in reducing radiant heat energy on the walls of the test room by more than 65% to less than 0.4 Btu/s·ft2 (4.8 kW/m2). The plot also reveals that, with some variability in test results, there was an abrupt improvement in the beat flux reduction at a threshold spray density. The major benefit in beat flux reduction occurred at spray densities greater than 0.09 gpmlft2 (3.7 L/min·m2).Effects of Sprinklers on Room Temperatures
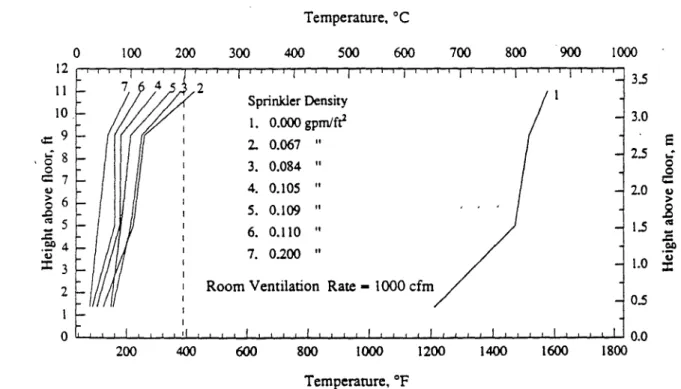
Figures 6 and 7 show a series of temperature profiles in the one-story test room at different rates of sprinkler
spray application and room ventilation. Each profile is plotted for a time during which burning conditions and temperatures in the room had stabilized after any changes in spray density or ventilation rate: Figure 6 shows the temperature profiles at different spray densities at a ventila-tion rate of 1,000 cfm (0.42
rtf
Is). Figure 7 shows similar temperature profiles for a ventilation rate of 1,500 cfm (0.63 m3/s). It is evident in Figure 7 that increasing the ventilation rate for the unsprinklered fire greatly increased the beat output and room temperature. With sprinklers operating, however, the increased ventilation caused only slight temperature increases.With the sprinklers shut off, temperatures in the upper part of the room reached approximately 1500°F (820°C) at a ventilation rate of 1,000 cfm (0.42 m3/s) and l700°F (926°C) for a ventilation rate of 1,500 cfm (0.63 m3/s). These high temperatures existed throughout most of the height of the room, and temperatures near the floor were still more than l200°F (650°C). Such temperatures repre-sent "flashover" conditions, which implies that every combustible in a compartment would have become involved in the fire. Fires that reach flashover have a high probabili-ty of spreading beyond the compartment of origin and therefore represent an augmented risk to the rest of the building, according to a statistical review of fires in office and residential high-rise buildings (Mailvaganam et al. 1992; Takeda and Yung 1991). It follows that there will also be a high probability that smoke will spread beyond the compartment of origin if flashover conditions are reached.
What is striking about the temperature profiles in Figures 6 and 7 is the extent to which temperatures were
Temperature, °C
Figure6
0 I 00 200 300 400 500 600 700 800 900 I 000 12 セセセセセセセセセセセセセセセセセセセセセセセMイイtセNMイイセ@ II 10. .::: 9 NセX@ 0 c 7 セ@.8
6 "' 5.=
Nセ@ 4 セ@ :I: 3 2 I Sprinkler Density I. 0.000 ァーイョャヲセ@ 2. 0,067 II 3, 0,084 II 4, 0.105 II 5, 0.109 II 6. 0.110 " 7, 0.200 IIRoom Ventilation Rate - 1000 cfm
3.5 3.0
s
2.5 ..: 2.0 1.5 0 0c:
セ@ >.8
..s.=
01) 'ii 1.0 :I: 0.5 0 U-..I.-'-J...I..-L-I.-L...I-:J--I...,I...J,-'-.I-.L-'-.I-'--'-J...4..-"-'-'-....I.-L....J-....1.-L....J--'--'-'--'--'-'--'--''-'-"'-'-'-... 0.0 200 400 600 800 1000 1200 1400 1600 1800 Temperature, °FTemperaJure profiles aJ north thennocouple tree in the one-story test room for different spray applicaJion raJes,
Temperature. °C 0 100 200 300 400 500 600 700 800 900 1000 12 I • 3.5 11
c-
Sprinkler Density QPセ@r
1. 0.000 gprnlft1 3.0 ..:: 9 2. 0.084"
E..:
8 2.5..:
c 3. 0.105"
0 0 0 1:;: 7 4. 0.109"
r:: セ@ 2.0 セ@ > 6 > 0 0 .cRoom Ventilation Rate - 1500 cfrn .c
C':l
5
1.5 C':l-
-
セ@ Oo 4 Ql) セ@ 1.0 セ@ ::t 3 ::t 2 0.5 0 0.0 200 400 600 800 1000 1200 1400 1600 1800 Temperarure. opFigurt 7
Temperature profiles at north thermocouple tree in the one-story test room for different spray application rates, for ventilation rate of I ,500ifm
(0. 63iif
Is).reduced in the room at even very low sprinkler spray rates. It is also important to note that increasing the ventilation rate to the test room had little effect on the fire tempera-tures, regardless of the spray density. Only the unsprink-lered fire responded to the increased air inflow. For the sprinklered fires, the peak room temperatures were consis-tently reduced to less thai1 390°F (200°C) near the ceiling and to less than 21rF (100°C) near the floor. For the profiles shown, the average temperature between floor and ceiling could be represented by the temperature at a height of 9 ft (2. 74 m), or 230°F (110°C).
The average temperature on the fire floor directly determines the buoyant forces that result (Klote and Milke 1992). It is not a straightforward matter to determine what temperature represents the "average" state on the fire floor, however. Temperatures in the one-story test room, shown in the figures, were relatively uniform both horizontally and vertically, because (1) the one-story test room was small and (2) the turbulence of the fire and spray interaction prevented any distinct hot gas layer from developing. In contrast, in the Tower, temperatures varied widely between one part of the fire floor and another because of the internal partitioning created by the corridors and the unidirectional air movement to the exhaust opening. Temperatures were highest im.rilediately over the wood crib. Temperatures at the ceiling along the west corridor were typically l00°F (56°C) cooler than the peak temperature and even cooler in the north corridor.
With a relatively small fire source in large floor areas typical of office buildings, there is likely to be significant air entrainment and dilution of the fire gases as they spread
throughout the floor area. Therefore, much variability in temperature through9ut the floor area can be expected. The implications of this will be discussed further in the section on fire pressures.
Tests in both the one-story room and the Tower involved only two sprinklers over the wood cribs. These two sprinklers were, in some cases, unable to reduce the gas temperature at the ceiling to below the activation temperature of the sprinklers. In a fully sprinklered floor area, gases not sufficiently cooled by the first operating sprinklers would set off additional sprinklers, which would further cool the gases. Temperatures measured in these experiments were therefore higher than would be encoun-tered in a fully sprinklered area in a real building fire.
Based on these observations of sprinklered, shielded fires, it is possible to conclude that sprinklers are effective at reducing temperatures, even at low spray densities. Under expected conditions of fuel load, spray density, and ventilation rate for an office occupancy, with a shielded fire, ceiling temperatures within the zone of influence of the closest sprinklers to the fire are likely to be less than 392 °F (200°C). Temperatures beyond the design area for the sprinkler system will be less than the activation temperature of the sprinklers.
Effects of Sprinklers on Buoyancy Pressures
Buoyancy
Pressures Pressure differences (tJ'}be-tween the fire floor and adjacent parts of a building are primarily due to the difference in density between hot and cool air, which creates a buoyancy effect. During the early
stages of a fire, some pressure difference is created by the expansion of the air on the fire floor as it is heated. For sustained, shielded fires, such as those used in these experiments, however, the net temperature difference between the fire floor and the other zones was the primary source of fire-induced pressure. The effect of the sprinkler spray was to greatly reduce the temperature on the fire floor, with a corresponding reduction in the buoyancy pressure differences between the fire floor and adjacent spaces.
Pressures were measured at_ four elevations in both the one-story test room and the seventh floor of the Tower, ranging from close to the floor to close to the ceiling. All pressure measurements were referenced to the adjacent nonfire space, such as the stairsbaft in the Tower tests or the Bum Hall for the tests in the one-story room. The reference pressure is shown as a vertical line at
M'
=
0 in Figures 8 and 10 and as a horizontal line in Figure 9-. When the fire compartment was not purposely depressurized by being mechanically exhausted, the initial pressure in the fire compartment was equal to the pressure in the adjacent nonfire spaces, so that theM'
was zero. As the fire began to grow, bot gases accumulated near the ceiling, creating a temperature difference between the floor and ceiling. The bot, buoyant ceiling layer generated a positiveM'
near the ceiling, while at the same time, the pressure near the floor became increasingly negative relative to the adjacentspace
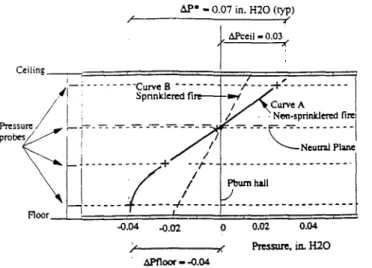
as the fire drew air toward itself. Curve A in Figure 8 shows a typical pressure profile for a nonsprinklered fire under this condition, with a positive and a negative pressure component above and below the neutral plane, respectively. Curve B in the same figure shows the pressure profile for the (typical) case of a sprinklered fire: both.the positive and negative values ofM'
were at least 50% less than the pressures measured in a nonsprinklered fire due to cooling of the gases on the fire floor.The effects of sprinklers on the pressure conditions in the one-story test room, with no mechanical exhaust in operation, are shown in Figure 9. It is clear that as spray density increased, the maximum positive M and negative
M'
diminished significantly. At a spray density of about 0.11 gpm!ft2 (4.5 lャセIL@ the peak pressure differences were reduced by at least 50% from the nonsprinldered case. Higher spray densities resulted in even greater reductions in buoyancy pressure. Note that it hasbeen
standard practice in smoke control system design to allow a 50% reduction in the design pressure difference for a sprinklered building (Klote and Fothergill 1983; NFPA 1988). This practice appears to be appropriate for the conservative case of assumed minimal sprinkler density. For reasons described earlier, in most real fire scenarios, the initial sprinkler discharge will exceed the minimum, and the average temperature on the fire floor will be less than the activation temperature of the sprinklers. It should be expected, there-fore, that buoyancy pressures will be much less than 50% of the unsprinklered values.Comparison of Measured and Predicted Pressures An equation is provided in Klote and Milke (1992) to estimate the magnitude of the buoyancy pressure generated by a fire: where
M'
=
Ks
=
To
=
セ@
=
H
=
(1)pressure differential across a barrier, m. H20 (Pa);
coefficient,,? .64 (3460);
ambient or reference air temperature, 0
R (K); absolute temperature of the fire,
oR
(K); and height above ( +) or below (-) the neutral plane, ft (m).M'
is the pressure difference across a boundary, with temperatureT
0 on the nonfire side and temperature セ@ on the fire side. H is the distance above or below the neutral plane, andKs
is a coefficient that incorporates gas density and unit conversions. Equation 1 calculates the maximum pressure difference (M') at distance H above or below the neutral plane, based on the difference in temperatures on the fire floor(1'}
and on the nonfire side of a barrier (T0).To perform the calculation, it is necessary to estimate the elevation of the neutral plane (hence H) and to assume a "fire temperature" representative of the average condition in the fire compartment. Uncertainties about the height of the neutral plane and in the calculation of the fire tempera-ture, both vertically and horizontally in the fire compart-ment, however, lead to difficulties in predicting fire-induced buoyancy pressure differences. Klote (1990) found that predicted pressure differences across a barrier using the average measured temperature at the barrier were in good agreement with measured pressure differences.
For the case of no mechanical exhaust of the fire floor, this positive Mceiling shown in Figure 8 was measured directly by the instrumentation. When the fire compartment is mechanically exhausted, however, and adjacent spaces are purposely pressurized in order to create a zoned smoke control condition, the elevation of the neutral plane on the fire floor becomes uncertain.
In
that case, the pressure profile for the fire floor is drawn into the negative region, relative to the stairshaft, which is equivalent to raising the neutral plane above the ceiling of the fire floor, as shown in Figure 10. For the purposes of analyzing the experimen-tal measurements of the effects of sprinklers on buoyancy pressures under conditions of mechanical exhaust of the fire floor, it was useful to work with the net pressure difference across the wall of the stairshaft between the floor and the ceiling of the fire floor, or M'*, as illustrated in Figure 10, instead of M calculated from Equation 1. From Figure 10 it can be seen that M'* will equal M' when the value of Hin Equation 1 equals the floor-to-ceiling height of the fire floor. Because the instrumentation measured the
M'
at the floor and ceiling levels relative to the adjacent nonfiret..P* -0.07 in. H20 (typ)
-0.04 -0.02 0
Pressure, in. H20 APfloor - -0.04
Figure 8 Typical pressure profiles in the one-story test room for a sprinklered and a nonsprinklered fire.
Sprinkler spray density, Lpmtm2 0 I 2 3 4 S 6 7 g
mTセ@ I I
o.o3
BBBGセ@
Pt=uresoef
ceil ins0_02
f
SO%re:c; - -;
--,0
I - - - J - .. _ - ..:::.1 -.:;. - _,.Envelope 001 ., " I -. -. / Pセ@ . .. ... :c I I ... . 5 o.oo I I . . · _;.. '-""' tセセセ@ I _, _, pu 1 c lc _, I / I C セ@ _, I Q:\.11 "'- '\:.__ Pre:s:sures near floor
-c-eQ:: I ] - - - - I -0.04 セNNNM⦅N⦅NNNセNMNQNNNMャMNNセNN⦅N⦅NNjNNNNNNNNN⦅N@ ... NNNセM ... __,__._..._.._.__._-'-ol
i
セ@ -0.01 -0.02 -0.03 10 8 6 4 2 ;; セ@ 0 c...
...: -2 c. セ@ -4 -6 -8 -10 0.00 0.04 0.08 0.12 0.16 0.20 Sprinkler spray dimity, USgpm'ftlFigure9 Comparison of total buoyancy pressure differ-ences between floor and ceiling, measured in the one-story test room for different sprinkler
spray densities.
---MセMMMMMMMM
- - - -MMMセ・オオ。ャ@
Plane -HI I 8th Floori
·H2
"ii=
-0.10 -0.06 6thl
Floor 1 PstaD-s_)
-0.02l
0.02 > M'.floorMechanical exhaust of the ft.re floor
createS negative
pressure.
which raises the elevation of the Neuual Plane.&>ceiling
=
K X F(Temp) X -HI .1.Pfloor= KxF{Temp) x -H2&>•
=
.1.Pfloor - M>ceilingセ@
=
Kxf(Temp) x [HI-H2]セ@
=
Kx F(Temp) x H0.06 0.10 Pressure. in. H20
Figure 10 Direct measurement of .iP* under conditions of mechanical exhaust of the fire floor.
spaces, t::.P* was obtained by subtracting the ceiling-level
セイ・ウウオイ・@ セュ@ the fl_oor-level
pressure. as
shown in Equa-tion 2. Usmg EquaEqua-tion 2, tJ' could be obtained from the direct presSure measurements without involving any as-sumptions about the height of the neutral plane on the fire floor.For a complete discussion of the use of t::.P*, see Mawhi-nney et al. (1992).
In the experiments in the Tower, the t::J'* values obtained using Equation 1 at various temperature conditions were compared with the actual values of t::.P* obtained using Equation 2. Temperatures on the fire floor were not uniform, either vertically between floor and ceiling or
horizontally throughout the fire compartment. t::.P• calculat-ed using the average temperature on the fire side of the wall of the stairshaft in Equation 1 gave good agreement with the measured t::.P* at that location. Actual values of t::.P*
measured between the fire floor and the stairshaft ranged from 0.008 to 0.016 in. H20 (2 to 4 Pa).
To conclude this discussion on buoyancy pressures, the tests indicated that fire-induced buoyancy pressures de-creased as spray density inde-creased and that a reduction of
50% of the design pressure difference for zoned smoke
control in sprinklered buildings is adequate but conserva-tive.
Also,
measured pressure differences compared well with predicted values when the average temperature across the stairshaft wall was used. Note that predicting the aver-age temperature at a specific location in the fire compart-ment, with wide variation in the temperatures between one part of the compartment and another, could be quite complex.Rapid Expansion of Steam There was some interest in whether the introduction of a water spray into the hot gases in the early stages of the fire would create a sudden pressure increase due to the rapid evaporation of water. One of the fires in the one-story room was allowed to become fully developed and the room very hot before the sprinklers were turned on.
In
thatcase,
a rapid expansion of steam occurred, forcing smoke and steam out of the test room at high velocity. Under normal conditions of sprinkler operation, however, sprinklers are activated by the first flow of hot gases rising from the fire. Ambient conditions at that stage are not hot enough to cause instantaneous evaporation of a large volume of water.In
the tests in the one-story room, the plots of t::.P versus time typically showed that the rapid drop in temperature· of the combus-tion products, on activacombus-tion of the first sprinklers, resulted in an immediate pressure reduction that more than compen-sated for the change in pressure caused by the rapid evaporation of a relatively small amount of sprinkler spray. PressureRequired to
Prevent Smoke Spread Across a Boundary Figure 11 shows the results of a series of tests · conducted in the one-story test room and attached corridor (see Figure 1) to determine how much pressure was required to prevent smoke from entering the corridor at different temperatures in the fire room. The spray density was adjusted to a certain level, and conditions in thefiie
room were allowed to stabilize. A fan supplying air to the corridor was adjusted to create a positive pressure between the corridor and the fire room. The flow rate of the fan was then gradually reduced, and the pressure differences (at ceiling level) between the two rooms at different flow rates were recorded. When the value of t::.P between the two
spaces
reached zero, smoke could be observed leaking intothe corridor.
These tests indicated that, when the fire-induced buoyancy pressure at the ceiling of the fire test room was equal to or less than the prefire pressurization of the corridor (t::.P design), smoke would not flow into the protect-ed space. These measurements confirm that the movement
Temperarure. •c
0 100 200 300 400 soo 600 0.06 ,--.--,...---,,--,---,---,..-.---.---r---,-..,.-.--;----,
Test points 1. 2. J. 4 indicate pressure
o.os _
difference produced by conldor prc:ssunz.a.aon to prevent smolce eatry,Pセ@ one-storey test room resu!U
- 14 - 12
..
.$ o.04 - 10 セ@ .; u c g セ@ 0.03 . . ' . 4 セ@ 8 セ@ セ@ 0 0 nセウュッャ」・@ entry セ@ Pressure differencet
.
a
0.02 t- caused by ヲゥイ・セ@セ@
セ@
セ@
0.01 t- 2 o Smoke entry Q - 6 セ@ セ@ 4 .:!: - 2t/
o.oo l⦅⦅N⦅⦅セM PᆬッMᄋMMャNMMGMMMMlNNMGMMMjNNNMMGMMセMMMBMMMj@ o 200 400 600 800 1000 1200 t・セBp@Figure 11 Pressure difference req_Eired to prevent smoke entry into corridor ヲイッュセ@ thefire room, as a function of.fire room temperature.
of smoke through leakage openings can be opposed by an equal pressure on the nonfire side of the barrier. Given that the maximum pressure difference between the floor and ceiling (t:J'*) created by a sprinklered fire was about 0.05 in. H20 (12.5 Pa) in the one-story
test
room and 0.016 in. H20 ( 4 Pa) in the Tower, the accepted practice, which is to design for t:J'1
of 0.05 in. H20 (12.5 Pa), appears to be reasonable, i.e., adequate, but not excessive.Effects of Sprinklers on Gas Concentrations
Studies conducted by Klote (1990), Walton (1988), and Walton and Budnick (1988) to measure the ability of sprinklers to suppress wood crib fires and fires in office furnishings demonstrated that concentrations of carbon dioxide (COz) and carbon monoxide (CO) gases in the products of combustion from a sprinklered fire were low. C02 may have reached 2% or 3% (ambient is 0.4%), while CO concentrations were between 0. 05% and 0. 3 % (50 and 300 ppm) (ambient air contains no CO). The concentrations of these gases first increased as the fire grew, then de-creased after the sprinklers operated and the fire began to be extinguished. The cited literature suggests that the amount of CO and C02 produced in an unsprinklered fire is much higher than in a suppressed fire because the fire is larger, burns longer, and consumes more of the available oxygen.
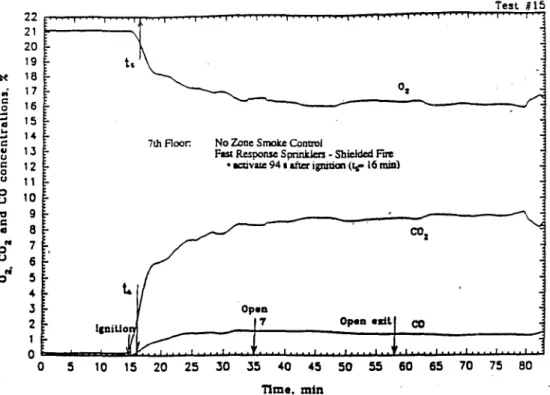
In
contrast, as illustrated by Figures 12a and 13a, shielded crib fires on the seventh floor (the fire floor) of the Tower produced C02 concentrations as high as 8% and 9% and CO concentrations between 1.0% and 1.5% (10,000 to 15,000 ppm). These gas concentrations were measured at a distance of 1.7 m above the floor, approximately 10 ft (3.05 m) from the wood crib, at the entrance to the westM ,.; c .2 <OJ Cl
..
<OJ c..
u c 0 u 0 u.,
c Cl..
0 u..
0 22 21 20 19 18 17 16 15 14 13 12 11 10 9 8 7 6 5 4 3 2 1 0 0o,
7th Aoor: No Zone SmoU Comml
Fasl Response S prinklc:a -Shielded Fsre • aaivw: 94 utter ignition (Ito-16 mill)
Opea eldl co
Test H15
5 10 15 20 25 30 35 40 45
so
55 60 65 70 75 80nme. mtn
Figure 12a 02, C02, and CO concentraiions on the seventh floor of the 10-story tower for a shielded fire with no zoned smoke control in effect.
22 Te.t 12 ' 21 20 19 N 18 ,; 17 c 16 ..2
...
Cl..
15 14...
c Cl u c 0 13 127th floac ZDae Smoke Coaaol AP • O.o51n. H20
Sa.mrd Spriaklal-Sbldded lire
a 0 u
.,
c•
..
8
..
0 11 10 9 8 7 6 5 4 3 2• am. 122alft:ripiliara (I• 7 mill)
Opa
I co
5 10 15 20 25 30 35 40 45
:so
55 80 85 70 7!5 80 85 90n.me, min
Figure 12b 02, C02, and CO concentrations on the seventh floor of the 10-story tower for a shielded fire with zoned smoke control in effect.
corridor. Although the seventh-floor crib fires did not represent the same open burning scenario as the crib fires conducted by Walton (1988), ventilation air for the fire was available from the relatively large floor volume (compared to the fire size) via the leakage openings between floors and across the exterior walls. Although the seventh-floor area was only about 1,400 ft2 (132m2) (including the core area),
the total leakage area for each floor in the 10-story experi-mental tower was 、・ウゥセ・、@ to simulate the expected leakage area from a 10,000-ft (910-m2) floor area. The crib fires on the seventh floor were therefore comparable to an office furniture fire in a 367-ft2 (34.1-m2) private office, with two doors open to an open floor area of several thousand square feet (square meters). Under these conditions, CO