HAL Id: cea-02615653
https://hal-cea.archives-ouvertes.fr/cea-02615653
Submitted on 23 May 2020
HAL is a multi-disciplinary open access
archive for the deposit and dissemination of sci-entific research documents, whether they are pub-lished or not. The documents may come from teaching and research institutions in France or abroad, or from public or private research centers.
L’archive ouverte pluridisciplinaire HAL, est destinée au dépôt et à la diffusion de documents scientifiques de niveau recherche, publiés ou non, émanant des établissements d’enseignement et de recherche français ou étrangers, des laboratoires publics ou privés.
reservoir siltation in the agricultural belt of European
Russia
Vladimir Belyaev, Valentin Golosov, Maxim Markelov, Nadezda Ivanova,
Eugenia Shamshurina, O. Evrard
To cite this version:
Vladimir Belyaev, Valentin Golosov, Maxim Markelov, Nadezda Ivanova, Eugenia Shamshurina, et al.. Effects of land use and climate changes on small reservoir siltation in the agricultural belt of European Russia. Considering Hydrological Change in Reservoir Planning and Management, Proceedings of H09, IAHS-IAPSO-IASPEI Assembly, Gothenburg, Sweden, IAHS Publ. 362, 2013. �cea-02615653�
Copyright 2013 IAHS Press
Effects of land use and climate changes on small reservoir
siltation in the agricultural belt of European Russia
VLADIMIR R. BELYAEV
1, VALENTIN N. GOLOSOV
1,2,
MAXIM V. MARKELOV
1, NADEZDA N. IVANOVA
1,
EUGENIA N. SHAMSHURINA
1& OLIVIER EVRARD
31 Laboratory of Soil Erosion and Fluvial Processes, Faculty of Geography, Lomonosov Moscow State University, Leninskie Gory, GSP-1, Moscow 119991, Russia
vladimir.r.belyaev@gmail.com
2 Institute of Ecology and Geography, Kazan (Volga region) Federal University, 18, Kremlevskaya Street, Kazan 420008, Russia
3 Laboratoire des Sciences du Climat et de l’Environnement (LSCE/IPSL), Unité Mixte de Recherche 8212 (CEA/CNRS/UVSQ), Centre de Recherche du CNRS, Avenue de la Terrasse, 91 198 Gif-sur-Yvette Cedex, France
Abstract Small reservoirs of agriculture-dominated areas experience severely increased sediment input
caused by soil erosion on cultivated slopes, also accompanied at some locations by gully erosion. This causes rapid decrease of the reservoir water storage and shortened periods of functioning. In this paper we discuss several examples of the 137Cs-based short-term siltation chronology of small reservoirs located in different landscape zones within the agricultural belt of European Russia. From two to four time marks could have been established in 137Cs depth distribution curves constructed from detailed depth-incremental sampling of reservoir infill sediment, allowing reconstruction of sediment microstratigraphy and deposition rates. In combination with other independent information sources this provides insight on the relative importance of recent land use changes and climatic variability in controlling sediment delivery within small agriculture-dominated fluvial systems. In combination with sediment redistribution studies, it has become possible to construct closed sediment budgets for catchments of several reservoirs and make a quantitative assessment of sediment delivery variability. Such information is important for appropriate design and management of small agricultural reservoirs in Russia.
Key words small reservoirs; siltation; agricultural land; soil erosion; sediment delivery; 137Cs depth distribution;
microstratigraphy; deposition rates; climate changes; European Russia
INTRODUCTION
Small reservoirs located in dry valleys or on small streams and rivers are typical and important components of human-altered landscapes of the European Russia agricultural belt (Golosov & Ivanova, 1993; Golosov & Panin, 2006; Belyaev et al., 2012). Initially, their widespread introduction in the 19th century was mainly aimed at interception of peak runoff for local water supply and (on perennial streams) providing continuous hydropower supply for water mills. At present such small reservoirs are used in diverse ways from local water supply for crops and livestock to local fishery and recreation. In many cases, especially in small dry valleys dominated by cycles of bottom gullies incision and infill, they also serve as buffers which intercept sediment delivery from headwaters and prevent regressive migration of active bottom gullies (Baxter, 1977; Golosov & Ivanova, 1993; Smith et al., 2001; Belyaev et al., 2004, 2005; Radoane & Radoane, 2005; Golosov et al., 2008, 2012). On the other hand, the majority of such small reservoirs in Russia are equipped with simple earthen dams without any protection against erosion, and equipped with very simple emergency floodwater bypasses (Fig. 1(A)). Such unprotected earthen dams are potentially vulnerable to breaches caused by erosion in cases of dam overflow or extreme discharges flowing through the bypasses. Such situation can in fact trigger new cycles of bottom gully erosion activity starting from the dam breach (Fig. 1(B); Belyaev et al., 2004).
As important and efficient interceptors of sediment from headwaters, small reservoirs in agricul-tural areas have long been considered as sources of valuable information on catchment scale erosion and sediment delivery based on the volume and microstratigraphy of the reservoir infill sediment (Eakin & Brown, 1939; Brune, 1953; Renwick, 1996; Verstraeten & Poesen, 2001; Radoane & Radoane, 2005; Nichols, 2006). Reservoirs are also important as sinks of sediment-associated pollutants (Zimbalevskaya et al., 1976; Loska & Wiechuła, 2003; Wildi et al., 2004; Nowlin et al., 2005; Golosov et al., 2012) and organic carbon (Mulholland & Elwood, 1982; Smith et al., 2001;
Cole et al., 2007). In addition, information on reservoir sedimentation dynamics is necessary for calibration, validation and testing of reservoir sedimentation models required for reliable prediction of temporal variability of the capacity and trap efficiency of new reservoirs at the design stages (Dendy, 1974; Gill, 1979; Pate-Cornell & Tagras, 1986; Verstraeten & Poesen, 2000 etc.).
Fig. 1 (A) Typical small reservoir in agricultural area of the European Russia equipped with earthen
dam (on the right) and simple unprotected emergency floodwater bypass with some evidence of linear erosion (in the foreground); (B) Example of extreme intensification of bottom gully erosion triggered by dam breach as a result of erosion of unprotected emergency floodwater bypass. Gully is about 10 m deep and up to 25–30 m wide (see human figure for the scale).
In most cases it is relatively easy to distinguish the reservoir infill sediment from the underlying material representing the pre-reservoir valley bottom, as the top of the latter is often marked by a buried soil or at least humified horizon (Golosov & Ivanova, 1993; Belyaev et al., 2004, 2005, 2012; Golosov et al., 2008, 2012). For many reservoirs, survey data of the pre-reservoir valley bottom and repeated topographic or bathymetric surveys carried out periodically with the aim of accounting for both natural sedimentation and possible artificial sediment removal are available to determine sediment volumes and associated sediment yields for various time intervals (Eakin & Brown, 1939; Renwick, 1996; Nichols, 2006). However, in cases where such repeated surveys have not been carried out, more detailed microstratigraphic separation within the reservoir infill sediment is required for evaluation of sediment yield and delivery dynamics. Different approaches have been used for this purpose, the most recent and promising techniques involving detailed analyses of depth distributions of radioactive isotopes such as 137Cs (Walling,
1990; Foster, 1995; Govers et al., 1996; Belyaev et al., 2004; Golosov et al., 2012) and 210Pb
(Appleby & Oldfield, 1978; Walling, 1990; Belyaev et al., 2004; Sikorski & Bluszcz, 2008) in reservoir sediment cores. In this summary of several case studies, we aim to show the advantages of using the 137Cs-based reservoir sediment microstratigraphy in combination with other
independent information sources on catchment-scale sediment redistribution for reconstruction of sediment budgets, determining sediment delivery dynamics and the contribution of controlling factors such as land use and climate changes over the last 30–60 years.
Case study sites
Selection of the case study sites considered in this study was based on representativeness of local topography, catchment morphometry (area, valley network structure), soil cover, land use and crop rotations. Each of the four sites characterizes different natural landscape zone (Table 1). It was also important that at least some information on land-use history, and, particularly, timing of the dam and reservoir construction should be available. The case study catchments are located in areas of the most productive soils and, therefore, most intensive agricultural land use (Fig. 2, Table 1). Studies of reservoir siltation described here were parts of several larger projects aimed at sediment
budget reconstruction for the arable land-dominated small catchments in different landscape zones of European Russia. Therefore research activities within each of the four catchments studied were not limited to investigations of the reservoir sedimentation, but involved detailed and complex studies of the catchment-scale sediment redistribution processes over the last 30–60 years. These included quantification of soil erosion rates on cultivated hillslopes, sediment delivery ratios from hillslopes to valley network, linear erosion, detection of the main intermittent sediment sinks, sediment redistribution through the valley network by regressive growth of bottom gullies and by perennial streams, small river floodplain storages. These complex investigations in each case mainly aimed to reconstruct the catchment sediment budgets for various time intervals defined on the basis of available information on land-use changes by means of application of several independent techniques (Belyaev et al., 2004, 2005, 2012; Golosov et al., 2008, 2012). General characteristics of the case study catchments are given in Table 1.
Fig. 2 Case study site locations.
Table 1 General characteristics of the case study reservoirs, dams and their catchments.
Sites (numbers on Fig. 2)
Landscape
zone Dam type Reservoir conditions Reservoir area km2 / % Catchment area km2 Cultivated area km2 / % Upper Lokna (1) Forest – forest-steppe transition with concrete protection operating 0.067 / 0.2 35.3 20.3 / 57.5 Chern (2) Forest-steppe with
concrete protection operating 0.39 / 0.3 140.4 66.3 / 47.2 (1)Lebedin and Gracheva Lochina (3)
Steppe earthen dry and
infilled 0.048 / 0.3 0.005 / 0.3 15.1 2.0 12.3 / 81.4 1.6 / 80.0 Upper
Kazgulak (4) Dry steppe earthen dry and infilled 0.004 / 0.1 3.7 3.1 / 83.8 (1)Two reservoirs and two catchments considered, the smaller catchment Gracheva Lochina occupying one of the headwaters of the larger catchment Lebedin (Fig. 5).
METHODS
Sampling of bottom sediment from reservoirs with existing water bodies at the case study sites 1 and 2 (Fig. 2, no. 4) was carried out during winter or spring periods from the stable ice surface in
order to avoid technical problems associated with coring from a floating vessel such as a raft or catamaran. The ice (30–50 cm thick during our fieldworks) was first drilled by the regular ice bore used by fishermen. Afterwards the half-cylindric hand corer with a 1-m long sample compartment was lowered into the borehole in the ice and forced into the bottom sediment as deep as possible by the weight of the field personnel. The half-cylindric sample compartment was closed by the rotation of the top handle by 180° in order to prevent loss of the core and ensure maintenance of the more-or-less regular geometry. Upon lifting the core back to the ice surface, the sample compartment was opened and left for a short period in order to let the potentially liquefied upper sediment layers freeze under open air conditions while the core was measured, described and photographed. The frozen core was then carefully cut into depth increments, in most cases at 3 cm intervals.
Sampling from the already infilled and dry reservoirs at case study sites 3 and 4 (Fig. 2, nos 5–6) was carried out from soil pits dug sufficiently deep to get through the entire thickness of the reservoir infill sediment and reach the underlying material represented in most cases by the buried valley bottom soil horizon, easily distinguishable from the laminated sediment layers by its darker colour and typical soil structure. After a careful description of the sediment section in the pit, depth-incremental sampling was carried out from a fixed surface area, and depth intervals selected depending on the total sampling depth.
Each sample in the field was packed, labelled, transported to the laboratory and pre-treated and analysed individually. Subsequent laboratory processing of the 137Cs samples involved wet
weighing, oven-drying at 105°C, dry weighing, grinding, sieving to <2 mm and homogenization of sub-samples for gamma-analysis. The 137Cs activity was measured at 661.66 keV, using a
high-resolution, low-background, hyperpure germanium coaxial gamma-ray detectors with a maximum relative error of the isotope activity determination of ±5–10%. Sample preparation, treatment and
137Cs activity measurements were carried out at the Laboratory of Soil Erosion and Fluvial
Processes, Faculty of Geography, Lomonosov Moscow State University.
Sampling points arrangement, procedures, sample treatment, laboratory procedures, interpretation and methods for quantitative assessment of soil erosion and sediment delivery from cultivated catchment slopes for the case study sites have been reported in detail elsewhere (Belyaev et al., 2005, 2012; Golosov et al., 2008, 2012).
RESULTS AND DISCUSSION The Tula Region case study
The Upper Lokna case study catchment (site 1 on Fig. 2 and in Table 1) is situated in the Tula Region in the most elevated northern part of the Srednerusskaya Upland. The natural landscape represents the transition between the forest and forest-steppe landscape zones. The soil cover is therefore represented by a complex alternation of grey forest and chernozem soils. The latter are dominant, particularly within the case study catchment. Documentary evidence indicates that intensive cultivation of the area began in the 17th century, with the area of arable land exceeding 60% around 1690 (~360 years ago). The maximum percentage of arable land (about 70%) was reached during the 1970s. The period of economic disorder following the collapse of the former Soviet Union was associated with abandonment of substantial areas of cultivated land, especially from 1991 to 2005. During the last few years, part of the previously abandoned land has been returned to cultivation. However, up to 10–15% of the area previously cultivated still remains abandoned.
The study area experienced both global and Chernobyl-derived 137Cs fallout. However,
contamination by the latter is so high (up to ~600 kBq m-2 i.e. >99% of the total fallout) that the
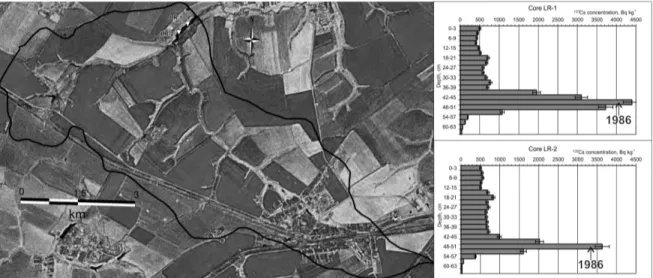
pre-Chernobyl fallout inventory can be reliably assumed to be negligible for the purpose of this study. The reservoir at the Upper Lokna catchment outlet (Table 1, Fig. 3) was built in the late 1970s. Therefore there were no direct pre-Chernobyl fallout marks in its bottom sediment, only some very limited input with early infill sediment. This is proved by the 137Cs depth distribution curves from
total sediment thickness observed during samples extraction (65.0 and 65.5 cm, respectively) is accompanied by practically identical 137Cs depth distribution shapes and, most importantly, depth
of the Chernobyl fallout peak marking the year 1986, in the sediment sequence (45–48 cm and 48–51 cm depth increments, respectively).
Very gradual decrease of 137Cs concentrations in the sediment layers overlying the 1986 peak
proves that the main source of sediment is soil erosion from cultivated slopes. Additional support for this conclusion is given by comparison of the isotope concentrations in sediments and in the eroded slopes plough layer samples, as well as by uniform distribution of fine lamination thickness observed by visual inspection during sampling in both cores. It can therefore be concluded that sedimentation rates and sources over the entire period of the reservoir operation have not changed significantly, even though the cultivated land area varied according to the recent land use changes outlined above. As the exact date of the reservoir construction is not known, it is more reliable to estimate sedimentation rates since the 1986 time mark: 18.6 ± 0.6 mm year-1 and 19.2 ±
0.6 mm year-1, respectively. Extrapolating these values for the total sediment thickness we can
obtain probable dating of the reservoir start of operation as between 1976 and 1978, which coincides with available information.
Fig. 3 The Upper Lokna catchment, reservoir and 137Cs depth distributions for the two cores studied.
Assuming the uniform spatial distribution of sedimentation rate it can be estimated that the total sediment volume stored in the reservoir bottom is about 43 550 m3 and the post-1986 storage
volume, 32 160 ± 2010 m3. From the average bulk density of the compacted fine bottom sediment
as 1.6 g cm-3, according to the laboratory measurements, it can be estimated that total post-1986
mass of the Upper Lokna reservoir bottom sediment is 51 456 ± 3216 t. It represents annual sediment input of 2058 ± 64 t year-1 equal to an area-specific sediment yield as low as ≈0.06 t ha-1
year-1 (for the entire contributing catchment area disregarding the land use and its changes).
Taking into account the published information on the River Lokna sediment budget (Belyaev et al., 2012), it represents 15.8% of the total sediment mobilization from the Upper Lokna catchment cultivated slopes (average annual gross erosion rate 6.4 t ha-1 year-1). In combination with other
within-catchment sediment sinks (within-slope buffer zones redeposition and dry valley bottom aggradation) it yields a total value of 86.3% of catchment sediment storage and 13.7% of sediment output. It can, however, be suggested that sediment output from the catchment must in fact be lower because sediment redeposition in buffer zones, such as grassed valley sides and forest shelter belts was not taken into account. In addition, design and construction of the reservoir dam and, especially, concrete well-type spillway (operated only when particularly high water level is reached) suggests that the reservoir trap efficiency should not be lower than 90% as only finest
fractions of the suspended sediment after passage of peak discharges can reach and pass through the spillway. Such a consideration would yield a value of approx. 1.6% of maximum possible catchment sediment output during the period of reservoir operation. Hence, 12.1% of the total sediment budget can most likely be attributed to errors in evaluation of the within-catchment sediment sinks and require further investigations.
THE KURSK REGION CASE STUDIES The River Chern case study
The River Chern basin (site 2 in Fig. 2 and in Table 1) is located in the northern part of the Kursk Region at its boundary with the Orel Region, within the forest-steppe natural landscape zone. Chenozem soils dominate the basin area and grey forest soils are of subordinate importance, except for the valley bottoms occupied by alluvial soddy calcareous soils. Intensive cultivation began around the 1780s, with maximum percentage of cultivated land (about 70%) reached in the second half of the 20th century. Since 1991, the area of cultivation land began to decrease, with the maximum extent of temporarily abandoned land about 25–30%. The reverse process started since 2008, although about 15–20% of previously cultivated land still remains abandoned up to now. The basin is characterized by moderate level of Chernobyl-derived 137Cs contamination.
Additional atmospheric pollution by heavy metals could have potentially originated from operations of the Mikhailovskiy opencast iron ore mine (OIOM) and processing plant (PP) started at the end of the 1950s.
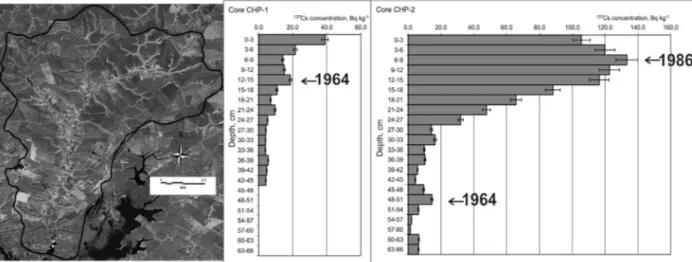
Fig. 4 The River Chern basin, reservoir and 137Cs depth distributions for the two cores studied.
The concrete-protected dam and reservoir in the River Chern valley was constructed in the first half of the 1970s and its operation started in 1975. Its capacity has been mainly utilized for the Mikhailovskiy OIOM and PP water supply, secondary usage involving local agricultural and domestic supplies. The two cores sampled from the reservoir bottom in January 2011 produced strikingly different patterns of the 137Cs depth distributions (Fig. 4). The lower core CHP-2 shows
the typical depth distribution curve with evident peaks attributed to the maximum global fallout in 1964 and the Chernobyl fallout in 1986. Very similar depth distributions have been observed in several sediment sections sampled earlier along the River Chern floodplain upstream from the reservoir. The 137Cs depth distribution in core CHP-1 is evidently cut at the top and can be
compared with the lower 2/3 of the CHP-2 (from approx. 21–24 cm depth increment), though the actual shape and depth intervals between peaks are different. It can be suggested that partial sediment removal operations were carried out in the upper part of the reservoir. That speculation has been supported by personal communication with the local water resources officials.
Importantly, there is no visible boundary marking a period of stability or erosion between the earlier river channel/floodplain sediment and the overlying reservoir infill sediment in either cores. It can therefore be suggested that alluvial sediment deposition was directly superimposed by the reservoir bottom sedimentation without prolonged interruptions.
It is obvious from the available data that the reservoir deposition rates varied substantially both in time and within the reservoir area since the beginning of its operation. It is however difficult to determine exact values for the first period of the reservoir operation between 1975 and 1986, because no unambiguous evidence of the alluvial–reservoir sedimentation transition has been found by visual inspection of cores or from 137Cs depth distribution. Pre-reservoir alluvial
deposition rates before 1964 can be approximately estimated as 30.0 ± 3 mm year-1 for the CHP-1
and 15.0 ± 3 mm year-1 for the CHP-2 (Fig. 4). More intensive deposition for the CHP-1 point is
also supported by the coarser grain size and thicker laminations observed visually in that core during sampling. Between 1964 and 1986 sedimentation rates can only be estimated for the CHP-2 core as 19.1 ± 3 mm year-1. By assuming more or less uniform sedimentation rates for the
1964–1986 period from visually unchanged thickness of laminations in cores, it can be suggested that in the CHP-2 core first reservoir infill sediment layer deposited in 1975 is located at approx. 27–30 cm depth. It can however be suggested that sedimentation rate in the CHP-1 core for that period was at least of the same order of magnitude, which eventually forced the need to remove some sediment. The last removal operation took place after 1986, as evident from the respective peak absence (Fig. 4). After 1986 sedimentation rate in the CHP-2 core fell dramatically to 3.6 ± 3 mm year-1. This temporal pattern coincides with that observed for several sediment sections of the
River Chern floodplain (Golosov et al., 2012) and can be explained by a combination of decreased cultivated land area in the 1990s–2000s and lower spring snowmelt flood peaks during the last several decades. The sediment budget estimations for the River Chern basin have not yet been completed. However, it can be preliminarily estimated that total sediment storage of the reservoir is 117 000 ± 39 000 m3 or 187 200 ± 62 400 t, indicating annual sediment input about 5200 ±
1872 t year-1 equal to area-specific sediment yield as low as ≈0.37 t ha-1 year-1 (for the entire
contributing catchment area disregarding the land use and its changes). Taking the obtained average annual gross erosion rate estimation for cultivated slopes of the studied catchment as 5.3 t ha-1 year-1 it can be approximately estimated that the gross amount of material mobilized from
arable slopes over the 36 years of the reservoir existence is about 16.1 × 10⁶ t. Hence, the reservoir
sedimentation volume estimated represents <1.2% of the total catchment sediment mobilization, highlighting the importance of within-slope buffer zone, dry tributary valleys and the main river floodplain storages yet to be calculated.
The Lebedin and Gracheva Lochina catchments case study
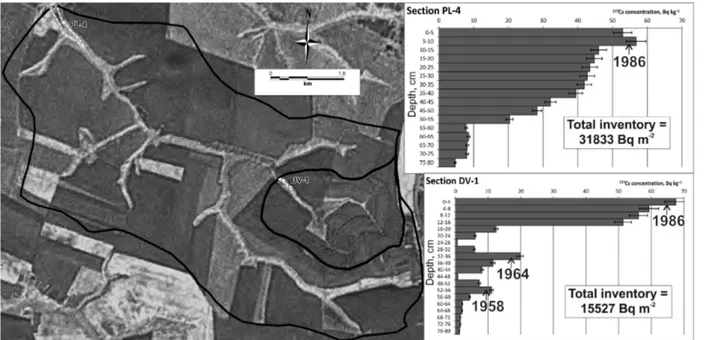
The Lebedin and Gracheva Lochina catchments (site 3 in Fig. 2 and in Table 1) are located in the central part of the Kursk Region, approx. 20 km southwest from the regional capital, Kursk City. The territory lies within steppe natural landscape zone dominated by various subtypes of the chenozem soils. Intensive cultivation of the area began around 1850. Maximum arable area was reached in late 19th century after the land tenure reform when even steep valley sides and some valley bottoms became cultivated. During the 20th century the most unsuitable land (steepest eroded slopes, valley bottoms) was diverted into pasture land. In 1956 the larger reservoir with earthen dam was constructed at the Lebedin catchment outlet (Fig. 5), which remained in operation until the late 1980s. Since 1986, the experimental system of soil conservations measures has been applied for 70% of the Gracheva Lochina catchment area in one of the Lebedin catchment headwaters, including contour tree belts with runoff-retention ditches, contour terraces and grassed waterways (Fig. 5). At the same time a small reservoir with an earthen dam was constructed at the catchment outlet for sediment interception. The study area experienced both global and Chernobyl-associated 137Cs contamination, the latter exceeding the former by about an order of magnitude.
Two sediment sections have been investigated and sampled, one within each of the formerly existing reservoir areas. From the 137Cs depth distribution curves obtained it is obvious that
sediment trap efficiency and deposition history of the two reservoirs considered is extremely different. For the DV-1 section in the smaller reservoir at the Gracheva Lochina catchment outlet aggradation can actually be reconstructed for the natural valley bottom surface prior to the dam construction, and its rates can be estimated for the three time intervals. However, after the dam construction in 1986 sedimentation was very limited. That can be explained by introduction of the experimental soil-conservation measures in the catchment at the same period of time, resulting in dramatic decrease of sediment delivery into valley network (Golosov et al., 2008). Rapid disappearance of the reservoir is therefore in this case associated with the lack of water caused mainly by lower spring snowmelt period runoff observed in the last decades directly by regular measurements in two main tributaries of the experimental catchment.
Analysis of 137Cs vertical distribution for the Lebedin reservoir sediment section suggests that
before 1986 the intensity of sediment transport by snowmelt-period concentrated runoff was much higher than that during the post-Chernobyl period. Deposition layer for the 1956–1986 period has a thickness approx. 70 cm (23.3 ± 5 mm year-1), while for the post-Chernobyl period, approx.
7.5 cm (0.3 ± 5 mm year-1). However, it is necessary to take into consideration that during a period
of the reservoir infill by sediment, the gradient of valley bottom decreased considerably, promoting more active sediment redeposition at the upper part of the reservoir. These observations also confirm the results of monitoring data on spring snowmelt runoff obtained for the Gracheva Lochina experimental catchment. Total amount of sediment stored in the Lebedin reservoir can be evaluated as approx. 46 800 t. That represents just about 8.3% of the gross sediment mobilization from the catchment cultivated slopes (approx. 563 500 t), as estimated from average annual soil loss rate (8.6 t ha-1 year-1) since 1956 with account for land use and crop rotation changes. In
combination with calculated valley bottom storages (approx. 243 000 t) total calculated storage (289 800 t) represents just about 51% of gross erosion. It is therefore important to pay attention to quantitative evaluation of within-slope, field boundary, tree belts and grass valley sides storages, as sediment output from the catchment should not exceed 10% (only during highest floods when the emergency flow bypass is operating). It can be suggested from the available data (Golosov et al., 2008) that all these storages together contribute about 38% of the gross erosion. The residual 11% of the sediment budget unexplained by the available data can most likely be attributed to some overestimation of soil loss rates by the techniques used.
Fig. 5 The Lebedin and Gracheva Lochina catchments, dry reservoirs and 137Cs depth distributions for the two cores studied.
The Stavropol Region case study
The Upper Kazgulak catchment (site 4 in Fig. 2 and in Table 1) is situated in the northeastern part of the Stavropol Region in the southern part of European Russia. It belongs to the dry steppe natural landscape zone dominated by the chestnut soils. The catchment has been intensively cultivated for about 150 years. In the 1950s a number of smaller collective farms were amalgamated into one large unit. At the same time, changes in the boundaries of the arable fields, creation of forest shelter belts and construction of earthen dams in the main valley bottom occurred. In the 1990s, a small parcel on the left-hand valley side near the catchment outlet was diverted into permanent pasture. Today, about 83% of the total catchment area is cultivated. According to our studies of the 137Cs inventories at undisturbed sites and depth distributions at
different locations (Belyaev et al., 2005), contamination in the area is only associated with global fallout, the Chernobyl input has not been detected.
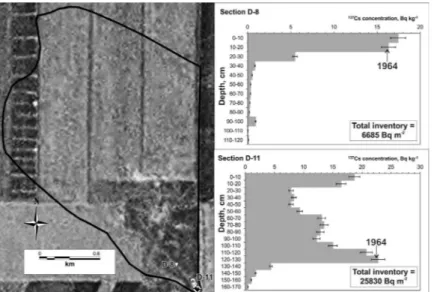
Fig. 6 The Upper Kazgulak catchment, dry reservoir and 137Cs depth distributions for the two cores studied.
The 137Cs depth distribution in the D-11 sediment section taken in 2002 from the dried
reservoir at the catchment outlet shows that sediment deposition has been very active and has not decreased significantly since the start of its operation. Sediment deposition rate can be approximately estimated as 45 ± 10 mm year-1 for the 1954–1964 period and 33 ± 10 mm year-1
for the 1964–2002 period. The upper peak in 137Cs depth distribution in the D-11 section can be
explained by development of the approx. 0.5 m deep active bottom gully reworking the previously stable valley bottom. The D-8 sediment section taken from upper eroded wall of that gully knickpoint indicates similar isotopic concentrations in the upper eroded part of the sediment profile (30 cm). In terms of the catchment sediment budget it can be approximately estimated that the reservoir stores only about 6800 m3 or approx. 12 240 t of sediment (taking into account the
mean compacted sediment bulk density 1.8 g cm-3 as determined in the laboratory). It represents
about 11.7% of the total sediment export from arable slopes of the catchment (approx. 104 510 t – net erosion value equal to gross erosion less within-slope sediment sink) estimated for the same period of time using the 137Cs mass-balance conversion model (Belyaev et al., 2005). The rest of
the material was redeposited in slope hollows and valley bottoms upstream (estimated value of approx. 82 280 t). The material unaccounted for in the entire catchment sediment budget is 9990 t, representing the 9.6% error. It can most likely be attributed to underestimation of within-slope sediment sink and sediment storage in buffer zones (tree belts, grassed valley sides) which remained unaccounted for.
SUMMARY AND DISCUSSION
The main factors directly influencing rates of small reservoir sedimentation are: (i) water discharge and sediment yield of stream (or streams) flowing into the reservoir, patterns of their seasonal, annual and longer-term variability; (ii) runoff and sediment-contributing areas on hillslopes directly connected to reservoir (if present); (iii) grain size composition of sediments delivered into reservoir by streams and direct hillslope runoff; (iv) density and compaction of the deposited material dependent on chemical composition of mineral and organic components; (v) reservoir size and planform; (vi) intensity of wave erosion and associated processes impact on reservoir banks (for larger reservoirs); and (vii) dam, spillway (if present) and emergency floodwater bypass design, construction and operation. Combinations of (i), (ii), (iii), (v) and (vii) determine the reservoir trap efficiency (Dendy, 1974; Verstraeten & Poesen, 2000). Of the factors listed, (i) and (ii) are clearly controlled by climatic conditions and catchment land use pattern, and (iii) and (iv) partly depend on those indirectly via the set of dominant geomorphic processes interacting with soil cover and surface geology (e.g. dominance of sheet and rill erosion determines sediment grain size, mineralogy and organic components composition similar to the topsoil material while gully
Table 2 Characteristics of the case study reservoirs sedimentation rates and volumes and available
catchment-scale information on sediment mobilization and intermittent sediment sinks for the reservoir operation periods. Sites (numbers on Fig. 2) Catchment area (km2) Cultivated area (km2) / (%) Mean erosion rate for cultivated area (t ha-1 year-1) / total mobilized material for the dam existence period (t) Within-catchment sediment sinks (t) / (%) Reservoir area (km2) / (%) Estimated reservoir sedimentation (t) / (%) Upper
Lokna (1) 35.3 20.3 / 57.5 6.4 / 324800 Cultivated slopes – 27600 / 8.5 Valley bottoms – 201400 / 62.0 0.067 / 0.2 51456 / 15.8 Chern (2) 140.4 66.3 /
47.2 5.3 / 16.1×10⁶ Currently being investigated 0.39 / 0.3 187200 / <1.2 Lebedin and Gracheva Lochina (3) 15.1 2.0 12.3 / 81.4 1.6 / 80.0 8.6 / 563 500 10.6 / 50 989 Cultivated slopes, forest belts and grassed valley sides – 214130 / 38.0 Valley bottoms – 243000 / 43.1 Cultivated slopes, forest belts and grassed valley sides – 33778 / 82.8 Valley bottoms – 8766 / 17.2 0.048 / 0.3 0.005 / 0.3 46800 / 8.3 0 / 0 Upper
Kazgulak (4) 3.7 3.1 / 83.8 24.1 / 110 065 Cultivated slope hollows – 5555 / 5.0 Valley bottoms – 82280 / 74.8
0.004 /
erosion or landslides deliver sediment associated with the underlying parent material). In the case of European Russia it is also important to note that soil erosion on arable hillslopes is dominated by heavy summer rainstorms, while further sediment redistribution along small dry valleys and streams is largely associated with spring snowmelt floods (relative contribution of those into annual sediment yield increases with catchment area and Hortonian stream order). Hence there is usually a certain lag between hillslope sediment production and sediment delivery to the catchment outlet (Golosov & Panin, 2006; Belyaev et al., 2012). That determines the importance of intermittent sediment sinks such as hollow fans, dry valley bottoms and small river floodplains, which also obviously increases with catchment area.
Comparison of situations at the four case study sites considered clearly shows that, similar to the situation observed even for more geomorphically unstable mountainous catchments (Harden, 1993), the importance of catchment-scale land use changes for the reservoir sediment delivery and sedimentation largely depends upon the catchment area, sediment transfer distance, presence and efficiency of intermittent sediment sinks. Thus, the River Chern reservoir characterized by the largest drainage area and higher variety of intermittent sediment sinks receives the relatively lowest percentage of the catchment-scale sediment mobilization. However, natural factors are also important as reservoirs in the Kursk Region (forest-steppe and steppe zones) seem to be most sensitive to sediment delivery changes associated with decreased spring snowmelt runoff (Golosov et al., 2008, 2012).
Similarly to the conclusion reached for a much larger reservoir sedimentation dataset for the continental US by Renwick (1996), it can be argued for the case study sites considered that this process is controlled by a complex combination of natural factors and human influence. Relative contribution of those varies at different scales. It is especially dependent on size of reservoir and its drainage basin. In general, increase of those is associated with growing importance of global climatic factors, as sediment yield signals triggered by local-scale land use changes are lagged or even partially buffered by intermittent sediment sinks along the relatively longer sediment transfer pathways.
CONCLUSIONS
Application of 137Cs depth distribution proved to be the useful and versatile tool for quantitative
assessment of reservoir sedimentation rates and microstratigraphic analysis of reservoir bottom sediment cores. In combination with complex catchment-scale studies involving application of several independent techniques it allows reliable construction of sediment budgets and evaluation of its possible temporal variability. The studies presented highlight the particular importance of paying more attention to determination of contribution of intermittent sediment sinks including within-slope redeposition, buffer zones, dry valley bottoms and small river floodplains. The temporal dynamics of such zones also need to be evaluated. Acquired information shows that reservoir sedimentation can be affected by both human-induced land use changes and global climatic fluctuations, but actual responses vary significantly depending to local conditions and characteristics of reservoirs, especially contributing catchment area, reservoir size and dam design.
Acknowledgements This work was partly funded by the RFBR (project 13-05-00162), the
President of the Russian Federation support program for young researchers (project no. MK-1221.2012.5) and for leading scientific schools (project NS-79.2012.5). Authors are grateful for a number of the Lomonosov Moscow State University Faculty of Geography students and staff who participated in fieldworks for the studies reported here.
REFERENCES
Appleby, P. & Oldfield, F. (1978) The calculation of Lead-210 dates assuming a constant rate of supply of unsupported 210Pb to the sediment. Catena 5(1), 1–8.
Baxter, R. M. (1977) Environmental effects of dams and impoundments. Ann. Rev. Ecol. and Syst. 8, 255–283.
Belyaev, V. R., Wallbrink, P. J., Golosov, V. N., Murray, A. S. & Sidorchuk, A. Yu. (2004) Reconstructing the development of a gully in the Upper Kalaus basin, Stavropol Region (Southern Russia). Earth Surf. Process. Landforms 29, 323–341.
Belyaev, V. R., Golosov, V. N., Ivanova, N. N., Markelov M. V. & Tishkina E. V. (2005) Human-accelerated soil redistribution within an intensively cultivated dry valley catchment in southern European Russia. Sediment Budgets I (Proceedings of Symposium S1 held during the Seventh IAHS Scientific Assembly at Foz do Iguacu, Brazil, April 2005), 11–20. IAHS Publ. 291. IAHS Press, Wallingford, UK.
Belyaev, V. R., Shamshurina, E. N., Markelov, M. V., Golosov, V. N., Ivanova, N. N., Bondarev, V. P., Paramonova, T. A., Evrard, O., Lio Soon Shun, N., Ottle, C., Lefevre, I., & Bonte, P. (2012) Quantification of river basin sediment budget based on reconstruction of the post-Chernobyl particle-bound 137Cs redistribution. Erosion and Sediment Yields in the
Changing Environment (Proceedings of a symposium held in Chengdu, China, October 2012), 394–403. IAHS Publ. 356.
IAHS Press, Wallingford, UK.
Brune, G. M. (1953) Trap efficiency of reservoirs. Transactions American Geophysical Union 34, 407–418.
Cole, J. J., Prairie, Y. T., Caraco, N. F., McDowell, W. H., Tranvik, L. J., Striegl, R. G. Duarte, C. M., Kortelainen, P., Downing, J. A., Middelburg, J. J. & Melack, J. (2007) Plumbing the Global Carbon Cycle: Integrating inland waters into the terrestrial carbon budget. Ecosystems 10, 171–184.
Dendy, F. E. (1974) Sediment trap efficiency of small reservoirs. Transactions of the ASAE 17, 898–908. Eakin, H. M. & Brown, C. B. (1939) Silting of reservoirs. USDA Technical Bulletin 524, 174.
Foster, I. D. L. (1995) Lake and reservoir bottom sediments as a source of soil erosion and sediment transport data in the UK. In: Sediment and Water Quality in River Catchments (ed. by I. D. L. Foster, A. M. Gurnell & B. W. Webb), 265–283. Wiley, Chichester, UK.
Gill, M. A. (1979) Sedimentation and useful life of reservoirs. J. Hydrol. 44, 89–95.
Golosov, V. N., Aseeva, E. N., Belyaev, V. R., Markelov, M. V. & Alyabieva, A. K. (2012) Redistribution of sediment and sediment-associated contaminants in the River Chern basin during the last 50 years. In: Erosion and Sediment Yields in
the Changing Environment (Proceedings of a symposium held in Chengdu, China, October 2012), 12–19. IAHS Publ.
356. IAHS Press, Wallingford, UK.
Golosov, V. N., Belyaev, V. R., Kuznetsova, J. S., Markelov, M. V. & Shamsurina, E. N. (2008) Response of a small arable catchment sediment budget to introduction of soil conservation measures. In: Sediment Dynamics in Changing
Environments (Proceedings of a symposium held in Christchurch, New Zealand, December 2008), 106–113. IAHS Publ.
325. IAHS Press, Wallingford, UK.
Golosov, V. N. & Ivanova, N. N. (1993) Some reasons of river net disappearance in conditions of intensive agriculture. Water
Resources 20(6), 684–689.
Golosov, V. N. & Panin, A. V. (2006) Century-scale stream network dynamics in the Russian Plain in response to climate and land use change. Catena 66, 74–92.
Govers, G., Quine, T. A., Desmet, P. J. J. & Walling, D. E. (1996) The relative contribution of soil tillage and overland flow erosion to soil redistribution on agricultural land. Earth Surf. Process. Landforms 21, 929–946.
Harden, C. P. (1993) Land use, soil erosion, and reservoir sedimentation in an Andean drainage basin in Equador. Mountain
Research and Development 13(2), 177–184.
Loska, K. & Wiechuła, D. (2003) Application of principal component analysis for the estimation of source of heavy metal contamination in surface sediments from the Rybnik Reservoir. Chemosphere 51, 723–733.
Mulholland, P. J. & Elwood, J. W. (1982) The role of lake and reservoir sediments as sinks in the perturbed global carbon cycle. Tellus 34, 490–499.
Nichols, M. H. (2006) Measured sediment yield rates from semiarid rangeland watersheds. Rangeland Ecology and
Management 59(1), 55–62.
Nowlin, W. H., Evarts, J. L. & Vanni, M. J. (2005) Release rates and potential fates of nitrogen and phosphorus from sediments in a eutrophic reservoir. Freshwater Biology 50, 301–322.
Pate-Cornell, M. E. & Tagras, G. (1986) Risk costs for new dams: economic analysis and effects of monitoring. Water Resour.
Res. 22, 5–14.
Radoane, M. & Radoane, N. (2005) Dams, sediment sources and reservoir silting in Romania. Geomorphology 71, 112–125. Renwick, W. H. (1996) Continent-scale reservoir sedimentation patterns in the United States. Erosion and Sediment Yield:
Global and Regional Perspectives (Proceedings of the Exeter Symposium, July 1996), 513–522. IAHS Publ. 236. IAHS
Press, Wallingford, UK.
Sikorski, J. & Bluszcz, A. (2008) Application of α and γ spectrometry in the 210Pb method to model sedimentation in artificial retention reservoir. Geochronometria 31, 65–75.
Smith, S. W., Renwick, W. H., Buddemeier, R. W. & Crossland, C. J. (2001) Budgets for soil erosion and deposition for sediments and sedimentary organic carbon across the conterminous United States. Global Biogeochemical Cycles 15(3), 697–707.
Verstraeten, G. & Poesen, J. (2000) Estimating trap efficiency of small reservoirs and ponds: methods and implications for the assessment of sediment yield. Progress in Physical Geography 24, 219–251.
Verstraeten, G. & Poesen, J. (2001) Factors controlling sediment yield from small intensively cultivated catchments in a temperate humid climate. Geomorphology 40, 123–144.
Walling, D. E. (1983) The sediment delivery problem. J. Hydrol. 65, 209–237.
Walling, D. E. (1990) Linking the field to the river: sediment delivery from agricultural land. In: Soil Erosion on Agricultural
Land (ed. by J. Boardman, I. D. L. Foster & J. A. Dearing,), Wiley, Chichester, UK, 129–152.
Wildi, W., Dominik, J., Loizeau, J. L., Thomas, R. L., Favarger, P. Y., Haller, L., Perroud, A. & Peytremann, C. (2004) River, reservoir and lake sediment contamination by heavy metals downstream from urban areas of Switzerland. Lakes &
Reservoirs: Research and Management 9, 75–87.
Zimbalevskaya, L. N., Zhuravleva, L. A., Khoroshikh, L. A., Pugach, V. I., Kostikova, L. E., Dekhtyar, M. N. & Yakubovsky, A. B. (1976) Eutrophication of the Kremenchug Reservoir shallows. Limnologica 10(2), 321–324.