HAL Id: hal-02270737
https://hal.archives-ouvertes.fr/hal-02270737
Preprint submitted on 27 Aug 2019
HAL is a multi-disciplinary open access archive for the deposit and dissemination of sci-entific research documents, whether they are pub-lished or not. The documents may come from teaching and research institutions in France or abroad, or from public or private research centers.
L’archive ouverte pluridisciplinaire HAL, est destinée au dépôt et à la diffusion de documents scientifiques de niveau recherche, publiés ou non, émanant des établissements d’enseignement et de recherche français ou étrangers, des laboratoires publics ou privés.
Limestone-Siliceous and Siliceous concretes thermal
damaging at high temperature
H Mastori, P Piluso, J.-F Haquet, R. Denoyel, Mickaël Antoni
To cite this version:
H Mastori, P Piluso, J.-F Haquet, R. Denoyel, Mickaël Antoni. Limestone-Siliceous and Siliceous concretes thermal damaging at high temperature. 2019. �hal-02270737�
Limestone-Siliceous and Siliceous concretes thermal
damaging at high temperature
H. Mastoria, P. Pilusoa, J.-F. Haquetb, R. Denoyelc, M. Antonic
a CEA, DEN, DTN/SMTA/LEAG, Cadarache, 13108 St Paul Lez Durance, France b CEA, DEN, DTN/SMTA/LMAG, Cadarache, 13108 St Paul Lez Durance, France c Aix-Marseille Univ, CNRS, MADIREL, Marseille, France
Limestone-siliceous and siliceous concretes are used in reactor pits of French nuclear power plants. In case of severe nuclear reactor accident, failure of the reactor vessel would lead to interaction between molten corium (hot melt of nuclear fuel) and concrete. This paper focuses on the thermal degradation of both limestone-siliceous and siliceous concretes till 1000°C. Thermo-Gravimetric Analysis (TGA) and Mercury Intrusion Porosimetry (MIP) are used to measure mass loss and porosity modification. As concretes are heterogeneous materials, sampling and representativeness have been addressed. TGA experiments show larger mass loss for limestone-siliceous concretes due to the decarbonation of calcium carbonate gravels when T>800°C. MIP experiments demonstrate a 100% increase of porosity for limestone-siliceous (resp. siliceous) concretes when T> 500°C (resp. T> 800°C). The consequences of these results are discussed in the frame of experimental tests on prototypical corium systems aimed at describing the key-phenomena involved in molten corium concrete interaction.
Keywords : Concrete; Porosity; Thermal stress; Molten metal; Corium
1. Introduction
Concretes are the most widely used building materials. They have excellent performances at room temperature but exhibit critical behavior when subjected to high temperatures [1], [2]. Concretes consist of mortar (cement paste and sand) and gravels and are therefore highly heterogeneous systems. Their modeling at the microstructure level is still for many aspects empirical and making predictions of their properties when subjected to extreme thermal stresses raise challenging open questions. This problem is particularly acute when focusing on nuclear accidents ranked at a level higher than 5 on the INES scale [2]. In such situations, a partial (or total) meltdown of the nuclear fuel is reached and a complex mixture, called corium, is formed consisting mainly of structural materials of the reactor. It may come in contact with the concrete of the reactor pit and potentially disseminate in the environment [4]. A detailed knowledge of the driving phenomena involved in the Molten Corium-Concrete Interaction (MCCI) is fundamental for the reliability of models and simulations [5],[6]. Most of reactor pits of the pressurized water reactors of the French nuclear power plants consist of either Limestone-Siliceous (L) or Siliceous (S) concretes. Both L and S concretes were used to simulate the MCCI conditions in the VULCANO facility of the PLINIUS CEA-Cadarache platform that is dedicated to the study of severe nuclear accidents. The tests were carried out at high temperatures (up to 2400°C) using prototypical corium (by means of depleted uranium dioxide) and a semi-cylindrical concrete test section. Post-test analysis revealed unexpected ablation profiles of concretes and metal/oxide phase separation phenomena [6]. For S concretes, anisotropic ablation profiles were evidenced with enhanced radial ablation, while L concretes exhibited isotropic ablation. Such differences in
concrete damaging is key for nuclear security. One of the goals of this work is to provide new insights into the understanding of this phenomenon by focusing only on the thermal degradation of concretes. No molten nuclear material will therefore come into play hereafter. A comparative description of the changes in the physical and chemical properties of L and S concretes, after exposure to different temperatures, is investigated. A characterization, for temperatures up to 1000°C, of the porosity, mass loss as well as the specific surface area is presented.
The description of the microstructure and properties of the components of concretes and their interaction is essential to understand their damaging kinetics with increasing temperature. Each component plays a well-defined role: hydraulic binder for cement paste, resistance to compression and volume enhancement for gravels. These latter occupy 60 to 75% of the volume and are therefore key for the tensile modulus and the overall stability of concretes. At room temperature, these properties are determined by physical rather than chemical characteristics [7]. But when investigating heated concretes, physico-chemical transformations have to be accounted for as they strongly modify their microstructure [8]. Successive degradation mechanisms are activated. At moderate temperatures (T<100°C) evaporation of water, dehydration processes of hydrates constituting the cement matrix and decomposition of ettringite take place [9],[10]. The first signs of decomposition of the CSH gel are observed at T≈180°C and persist up to 400°C [11]. Between 400°C and 600°C, decomposition of portlandite (Ca(OH)2) prevails [8], [12], [13] while for 600°C<T<1000°C, calcite decomposes into lime (CaO) with a significant release of carbon dioxide [12], [14]. Finally, for T>1000°C, the remaining concrete components melt down [8]. All these mechanisms can be modified by additives. For example, the improvement of concrete high temperature resistance and limitation of its susceptibility to damage can be achieved thanks to the use of the addition of siliceous fly ash [15], [16], [17].
The study of the morphological transformations of CSH gel during heating emphasizes the fundamental role of the water content of concretes before heating. The bonds between the gel layers are controlled by Van der Waals forces which are weak when compared to chemical ones. CSH gel has a surface area of 250 to 300 m²/g that turns 1000 times larger than that of cement (0,3 m²/g). Thus, when temperature increases, evacuation of water modifies its mechanical properties. Dehydration is the dominant mechanism occurring in the cement paste when heated up and results in a reduction of the CSH gel volume. But, as water vapor fills the porous network and tends to escape from concrete, the pressure increases [18]. This phenomenon, called internal autoclaving, activates hydrothermal reactions that modify the microstructure of hydrates [8], [19]. The decrease of the volume of anhydrous compounds and the expansion of the cement paste due to autoclaving generate an increase of porosity [2],[8]. Free space between CSH layers can indeed vary from 5 up to 25Å. But this is too low to have a significant role on mechanical resistance. Nevertheless, water residing in these small voids can be maintained by weak hydrogen bonds (C-S-H gel) [20] and its removal can contribute to shrinkage, drying and creeping of concrete [8]. Macropores (i.e. pores of diameter greater than 50 nm) are essential for mechanical strength and permeability, while mesopores (i.e. pores with diameters between 2 nm and 50 nm) play an important role in the drying and shrinking processes. A small amount of air is usually trapped in the cement paste during the mixing phase and forms millimetric air bubbles. Trapped air bubbles and the space occupied by entrained air in the cement paste are much larger than the capillary voids and are likely to adversely affect the resistance [21].
After this introduction, material and methods are presented in section 2. Concretes being heterogeneous at different scales, sampling technique is discussed. Thermo-Gravimetric Analysis
and Mercury Intrusion Porosimetry results of L and S concretes are exposed in section 3. Mass losses after heating for five days are further analyzed. Conclusions and perspectives for future work are finally presented.
2. Materials and Methods Materials
Table 1 presents the composition of L and S concretes under study and Table 2 the cements (respectively CEM I for L and CEM II for S) supplied by CALCIA© cement plant (Beaucaire - France). The sand and gravels content is given in Table 3. The analyzed samples were cast on June 6th 2006 and November 23rd 2007 respectively and extracted from parallelepiped concrete blocks of approximately 7cm×20cm×30cm and about 7 kilograms each. As they’re more than 12 years old, they’re assumed to be representative of nuclear pits. Common buildings have indeed a life expectancy of about 50 years and up to 100 years for civil engineering structures. Component S concrete (%weight) L concrete (%weight) Ca(OH)2 12.89 13.00 CaCO3 16.20 55.95 SiO2 65.89 25.16 Free H2O 2.87 6.7 Al2O3 2.15 2.31
Table 1: Composition of analyzed concretes
Table 2: CEM I and CEM II composition
L concrete Component (granulometry) Sand (0-3) Sand (0-4) Sand (3-6) Gravels (4-16) Gravels (6-14) %weigh 5.55 19.50 5.55 31.20 16.20 S concrete Component (granulometry) Sand (0-2) Sand (0-6) Gravels (5-8) Gravels (8-11) Gravels (11-16) %weigh 12.20 18.40 16.60 20.40 10.40
Table 3: Sand and gravels characteristics
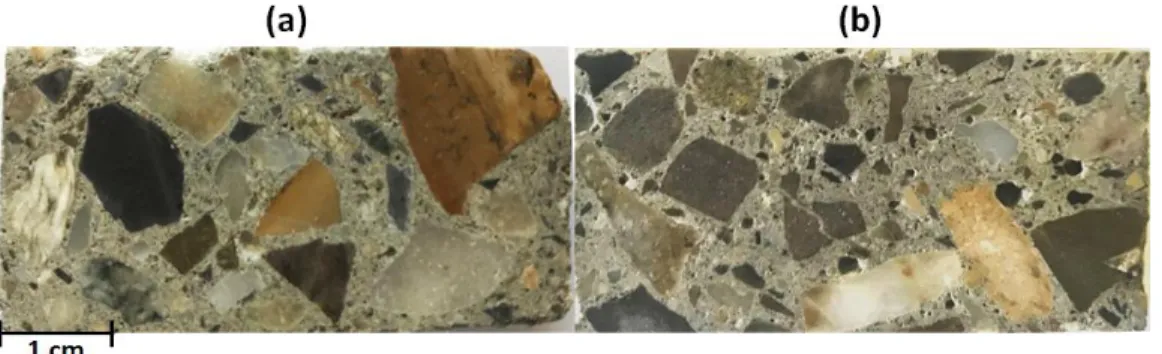
Error! Reference source not found. shows two representative photographs of sections
of L and S concretes. Siliceous gravels show up in black. Other gravels are calcium carbonate. This figure illustrates the granulometry of the samples that turn similar and the larger fraction of calcium carbonate in L concretes. In the mix design the following materials were used for L concrete : 15,3%w of Portland cement CEM I 52.5N, gravel with 4-16 mm, gravel with 6–14 mm, sand with 0–3 mm, sand with 0-4 mm and sand with 3-6 mm and 6,7%w of water. For S concrete the following materials were used: 15,3%w Portland cement CEM II/A-S 52,5N, sand with 0–2 mm, sand with 0-6 mm and gravel with 5-8 mm, gravel with 8-11, gravel 11-16 mm and 6,7%w of water. Prior to mixing, mass of each compound was measured with a balance (reliability ± 1
Component CEM I (%weight) CEM II (%weight) CaO 64.6 61.13 SiO2 20.3 22.75 Al2O3 4.8 6.05 Fe2O3 3.7 2.22 SO3 2.5 2.65 MgO 1.3 2.24 K2O / 0.73
g). 6 kg of each specimen were prepared. All tested compositions had 0.44 of water to cement ratio. Cements were used as supplied by CALCIA© without further treatment.
In the first stage of mixing plan, the sands and cement were added and mixed with one-third of the mixing water in a bucket in order to get a homogeneous paste. Manually mixing is performed using a shovel. Then, the gravels were added gradually and the remained water was poured to the mixture. The mixing is stopped when a homogeneous mix is obtained. The mix is finally poured in prismatic molds. From each type of concrete, 3 prismatic specimens were cast (50x5x5 cm3). Prior to the experimental campaign, to reduce the risk of spalling, the samples were cured at laboratory environment for 28 days.
Figure 1: Photo of a section of L (a) and S (b) concretes. Scale is given bottom left of (a).
Depending on the analyzes to be carried out, the samples were prepared in different ways. For Thermo-Gravimetric Analysis, samples consist of small fragments of about 100 mg. This low weight exclude large gravels. Sampling is therefore key here. For Mercury Intrusion Porosimetry, samples consist of either Crushed Samples (CS) or samples in the form of Monoliths (MS). CS consists of coarse and dispersed chunks obtained by hammering and MS are cylinders of about 3 cm high and 1.5 cm in diameter (see Figure 2). The weight of MS varies between 25 and 35 g and they are obtained by coring concrete blocks at slow speed without using lubrication liquid. A jet of cold compressed air has been used to prevent chemical alteration due to temperature rise.
Figure 2: Left: Crushed sample (CS). Right: Monolith sample (MS). The left image also displays the macro-cell used for MIP measurements.
Thermo-Gravimetric Analysis (TGA)
TGA is an adapted technique for studying the mass variation of samples submitted to temperature stress. Samples are placed in a platinum crucible and mass variations are measured with a balance monitored in real time as function of temperature. In current TGA experiments, atmosphere must be inert to prevent samples from reacting with environment. In this paper argon is used. TGA experiments were performed using a Q-500 thermo-balance from TA Instrument© which makes possible to reach a maximum temperature Tmax=850°C with a sensitivity of 0.1 μg. Temperature ranges from room temperature up to 850°C at a rate of 5°C/minute with an accuracy of ±1°C. In order to be as representative as possible, 15 samples of L and S concretes were analyzed. This is sufficient to provide reliable trends. Some TGA measurements were carried out for aggregates and cement paste separately to distinguish the contribution of the different components of the samples.
Furnace Heating and direct weighting of samples (FH)
In FH experiments samples were exposed for five days at a fixed temperature. This relatively long period aims to ensure a deep calcination and thus to avoid any inhomogeneities due to non-uniform temperature gradients within the samples. Two Thermolyne © Furnaces 38000 and 68000 and alumina crucibles were used for this purpose. Four experimental campaigns, identified by the temperature at which the concrete samples were exposed, were carried out. In the first, they have not undergone any heat treatment. For the other three, they were calcined at 500°C, 820°C and 1000°C and analyzed 2 to 3 hours after their extraction from the furnace. This time range was long enough for their temperature to return to the ambient one and sufficiently short to avoid rehydration process to occur. Samples were weighed before and immediately after extraction of the furnaces with an accuracy of ±1 mg. For heat treatments at high temperatures (T>500°C) their mechanical strength decreases considerably. This fragility results from cracks that are mainly due to the pressure of water vapor and CO2 [22] and requires careful handling to avoid samples disaggregation.
Mercury Intrusion Porosimetry (MIP)
The samples used for FH were further analyzed by MIP. MIP is based on the concept of forced penetration of a non-wetting, non-reactive liquid into a porous material. It gives information on the size distribution of accessible pores in the range of diameters from 3 nm to 300 μm . The Washburn equation describes the relationship between pore diameter, applied pressure and contact angle. The porosimeter used in this work is a Quantachrome POREMASTER-60©. It includes a low-pressure and a high-pressure measuring station. High pressure measurements were carried out from ambient temperature up to maximal value Pmax=4140 bar. A 5 cm3 macrocell has been used to allow experiments with large samples (see Figure 2). Mercury intrusion is preceded by degassing of the samples at a pressure smaller than 10-5 bar. Samples weight about 30 g (see section materials) but the weight of the analyzed samples that have undergone calcination is smaller (about fifteen grams) suggesting larger porosity. It is therefore necessary to pay attention to the volume of the stem of the macrocell. For large porosities, if volume is too small, maximum pressure cannot be reached making smallest pores (few tens of nanometers) not accessible. CS have typically large interparticle porosity. This
is why smaller cells and smaller masses (5 g) were used for such samples. Finally, all MIP plots consist in averages for at least 5 samples for each temperature.
Three characteristic volumes are measured when operating MIP. The apparent volume Vapp that corresponds to the volume of the sample regardless to its porosity, the absolute volume Vabs = Vapp – Vp where Vp is the porous volume that is defined when maximal pressure Pmax is reached. Vp writes :
Vp=MHg
ρHg Eq. 1
with MHg the mass of mercury intruded in the sample at Pmax and ρHg the density of mercury. Vp is therefore the volume of mercury intruded in the sample at Pmax. It is referred to as the porous volume and is expressed in cm3/g. With this definition, Vabs turns out to be the volume occupied by the solid phase (skeleton) of the concrete. Both Vabs and Vapp are further used to define the absolute and apparent density :
ρabs=Msample
Vabs , ρapp=
Msample
Vapp Eq. 2
where Msample is the sample’s weight. The apparent density, ρapp is accounting for sample porosity whereas ρabs, also called skeletal density of the solid matrix, describes the dense phase (ρapp < ρabs).
For a given temperature, the outputs of TGA, FH and MIP presented hereafter result from averages over 15 samples for TGA and a minimum of 3 samples for MIP and FH. As experiments are independent, error bars in the plots are obtained using a student test with a confidence interval set to 80%.
3. Results and discussion
Thermo-Gravimetric Analysis
The properties of the concretes are first studied considering gravels and mortar separately. The interest of this approach is to highlight the differences in thermal stability between mortar and gravels. Samples are crushed and gravels separated from mortar by sieving. Figure 3 plots the sample averaged thermo-gravimetry (TG) and DTG (Differential Thermo-Gravimetry) curves for S concretes.
Figure 3: Thermal degradation of S concrete. Orange curves correspond to sample consisting in gravels only, while green curves to mortar. Solid lines (resp. dashed lines) show TG (resp. DTG) curves.
For mortar samples, mass decreases progressively in the full temperature range. For T<200°C, a mass loss of about 4% is observed due to water release. Free water evaporates first, followed by adsorbed water. Water chemically combined with hydrates is evacuated last. When looking mortar DTG curve in detail, the peak at T≈70°C is the signature of the evaporation of free water. For higher temperatures and up to 200°C mass loss associated to calcium sulphoaluminate hydrates (i.e. ettringite) decomposition comes in addition to water release [23], [24]. This explains most probably the presence of the secondary peak at T≈140°C. For T>200°C, temperature rise causes complete drying. At T≈450°C, the pronounced peak in the DTG curve is associated to CSH gel decomposition that yields an additional mass loss of about 2%. For 450°C<T<550°C portlandite undergoes decomposition with again a mass loss of 2% [9], [10], [25]. Portlandite content falls rapidly and, as it decomposes into quicklime and water, leads to an additional water release. The dehydration of CSH gel is already activated at T≈180°C but this mechanism becomes prevailing only above 750°C, where decomposition into calcium silicates β-C2S, β-CS and water occurs. All these phenomena are accompanied by volume changes induced by thermal expansion. During heating, cement paste indeed undergoes an expansion of 0.2% when temperature is increased from ambient to 150°C [26]. This expansion results from the pressure increase generated by the evacuation of free water. It is followed by a shrinkage when T>500°C due to the reduction of the interlayer space between CSH sheets [27].
When considering gravels only, Figure 3 shows that they remain almost inert when T<600°C. DTG curve shows a weak peak at T=400°C, due to CSH decomposition. It actually results from the thin residual mortar layer covering the gravels. For T>600°C, calcium carbonate gravels are submitted to intense decarbonation that is at the origin of a sharp mass loss. Calcium carbonate is decomposed into quicklime and carbon dioxide. Unlike mortar, gravels only expand under the effect temperature. An additional source of volume expansion comes from the quartz phase transition from quartz-α phase to quartz-β that occurs for T≈570°C. It generates a volume dilation ranging between 1 and 1,4% [28]. It is important to note here that quicklime may rehydrate during sample cooling and form Portlandite after recombination with water molecules
of the ambient air. This can create an expansion of more than 40% [29]. This expansion comes in addition to the gaseous stresses and therefore favors outward gas flows.
Figure 4: Thermal degradation of L and S concretes. Blue (resp. red) curves correspond to L (resp. S) concrete. Solid lines (resp. dashed lines) correspond to the TG (DTG) curves.
Figure 4 shows the average TG and DTG curves for both L and S concretes. When T<600°C, curves are similar and display a mass loss smaller than 8%. Only mortar contributes since gravels are not modified for T<600°C (see Figure 3). Physicochemical changes occur at the same temperatures and therefore do not depend on the type of concrete. When T>600°C, decarbonation occurs and yields a mass loss larger for L concrete due to larger calcium carbonate content. From a quantitative point of view, three temperature domains can be roughly identified here:
• In the first domain denoted D1, temperature ranges from 30°C to 120°C. In this domain, the release of water prevails and mass loss is smaller than 2% for both concretes [30].
• The second domain, D2, shows up for 400°C<T<600°C. Mass loss for S (resp. L) reaches 4% (resp. 5%) at T=500°C. Dehydration of portlandite comes into play and CSH gel decomposes [31]. According to the literature, the dehydration of CSH gel occurs over a wide range of temperature [32]. Some authors have denoted that it occurs for temperatures less than 400°C where mass loss combines the release of capillary water (for T≈180°C), interlayer water (for T≈350°C) and finally adsorbed water (for T≈400°C) [11].
• The third domain, D3, corresponds to T>700°C. Decarbonation takes place. Mass loss becomes important and reaches at T=900°C, 29% (resp. 12%) for L (resp. S) concrete.
The definition of D1 to D3 relies on the maxima reached in the -DTG curves. Other definitions could be used here such as, the temperatures domains bounded by successive inflexion points of the TG curves. But, as concretes are heterogeneous materials, this would not affect the main outcomes of this work as the mechanisms taking place in two adjacent domains actually coexist as suggested by the continuous trend of the TG curves of Figure 4.
Furnace Heating and direct weighting of samples
Besides imposing small mass samples, one additional limitation of TGA experiments comes from the fact that they do not allow fast heating of the samples. Fast heating is important in the frame of this work since it occurs in the VULCANO-MCCI experiments. One way to get insights into such a scenario is to introduce directly the concrete samples into a preheated furnace. This is what is done next. Figure 5 shows the typical mass loss, noted W(S) and W(L) of S and L concretes, obtained from FH experiments at five different temperatures. The analyzed samples are either MS or CS. Figure 5 clearly indicates common trends.
• In D1, W(L) and W(S) remains smaller than 0.5% (about 1% for TG). FH and TG measurements therefore almost coincide.
• In D2, FH and TG measurements still show moderate mass losses when T≤500°C. They result essentially from the physico-chemical changes in the mortar. These latter being the same for S and L concretes, no significant differences should again be observed here. At T=500°C, W(S)=0.9±0,02% while W(L)=1.3%±0,3. They are therefore much smaller than the values obtained from TG (4% and 5% respectively). For T=570°C, a jump is expected in the data due to the phase transition from quartz-α to quartz-β. It produces an expansion of quartz gravels from 1.0 to 1.4%. This volume expansion is accompanied by their fracturing and by the occurrence of cracks at the Interfacial Transition Zone (ITZ) [33]. Gases have then the possibility migrate thought a network of cracks and therefore yield the drastic increase of mass loss observed in D2.
• In D3, T>700°C, two important differences show up. First it appears that W(L) is more than twice larger than W(S) (W(L)/W(S)~2.5). Second when comparing Figure 4 and Figure 5, for example at T=820°C, W(S)=4±0,01% (resp. W(L)=10%±0.5%) for FH while W(S)=12% (resp. W(L)=28%) for TG. Hence, it turns out that, for a same temperature, mass loss is much larger for FH than for TGA.
Figure 5: Average mass loss W as a function of temperature resulting from FH experiments. Red: S concrete. Blue: L concrete
FH and TGA measurements are observed for the same concretes, the same temperatures, but not in the same conditions regarding to atmosphere control and heating rate. As no inert gas flow is used in FH, samples are submitted to the water vapor pressure of the target temperature. This contributes both to the presence of capillary water and to the inhibition of dehydration. Moreover, unlike samples analyzed by TGA that undergo smooth temperature ramps, in FH, samples are subjected to a thermal shock. Such a process can induce water retention phenomena. The moisture in the vicinity of the sample surface is indeed in an unsaturated state while the moisture deeper in the sample is in a supersaturated state. The variation in temperature with depth causes therefore larger water vapor pressure that migrates inside the sample due to pressure gradients. But this also creates moisture clog [34], [35]. At a high heating rate, samples are indeed far from thermodynamic equilibrium: bounded water can rapidly turn in capillary water. This generates the formation of a saturation barrier that prevents water from migrating through the porous network of the concrete. Similarly to water, calcium carbonate decomposition has been shown to affect heat transfer kinetics [36]. It is a highly endothermic reaction and the resulting cooling plays an important role in the overall mass flows [37]. Partial pressure of carbon dioxide actually modifies the decomposition temperature due to Le Chatelier law that is shifted to higher temperatures [36], [38]. As the decomposition reaction of calcite is reversible and is dependent on the partial pressure of carbon dioxide, a retardation in the reaction rate can occur [39]. Finally, the sample size may also affect the decomposition since the larger the sample size, the longer the diffusion paths and hence the greater is the build-up of partial pressure of carbon dioxide [37].
Overall, while it is FH that would have been expected to affect the most aggressively the concretes due to thermal shocks, it appears here that it is actually TGA that creates the largest mass losses and therefore the strongest damages. This is surprising and suggests that concrete damaging in MCCI is most likely, in its initial stage, driven by the physics of fracturing due to increasing inner pressure and not by chemical alteration.
Mercury Intrusion Porosimetry
First point to verify here is to ensure that MS and CS give comparable results. Figure 6 displays the pore size distribution, denoted in the following by fL(d,T) for L concretes (fS(d,T) for S concretes), as a function of pore diameter, d, for L concretes exposed to temperatures T=20°C (a) and T=820°C (b). An absolute maximum in fL(d,T) close to d=170 nm appears at 20°C. For 820°C, maxima are slightly shifted but remain within the range 300 - 500 nm. Amplitudes have moreover similar for d < 2 µm. It is therefore reasonable to consider here that, for a given temperature, the morphology of the samples (MS or CS) does not strongly affect MIP results in this size range. Similar outcomes are obtained for S concretes. Averaging the data regardless to sample morphology make therefore sense here. This similarity of MIP curves gives also hints about porous structure. In CS accessible porosity is indeed expected to be larger because of the opening of closed pores in the preparation procedure and larger contact surface with mercury. For example when T=20°C, Figure 6(a) shows that CS gives larger values of fL(d,T) than MS when d < 20 nm and d > 2 μm. This suggest that closed mesoporosity of MS is partially open in CS.
Figure 6: L concrete pore size distribution for CS (dashed line) and MS (full line) after exposition for 5 days to temperature 20°C (a) and 820 °C (b).
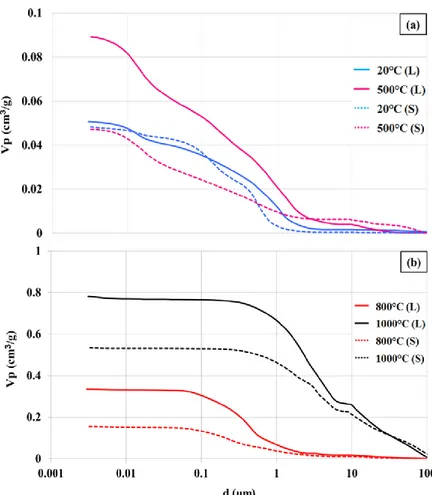
Figure 7: Sample averaged cumulative intruded mercury volume as function of pore diameter for S (dashed lines) and L (full lines) concretes for various exposition temperatures: In (a) T≤500°C in (b) T≥800°C.
Figure 7 shows sample averaged cumulative intrusion curves for S and L concretes for T<500°C (a) and T > 800°C (b). For clarity, curves for S concretes are plotted with dashed lines while the ones for L correspond to full lines. In Figure 7(a) two regimes show up. The first one can be identified for pore diameter d > 3 μm for which volume of intruded mercury remains small. It corresponds to the filling of the largest pores carried out at low pressure (0 to 1 bar). In the second regime (d < 3 μm), this volume monotonously increases and pores sizes down to few nanometers are explored. S and L concrete curves do not display clear saturation at high pressure indicating that the porous volume is not yet fully probed in the operating conditions and that pores with d<3 nm are probably present. For such experiments, pressure spans from 1 to 4000 bars and several milliliters of mercury per experiment are needed.
Figure 7(a) illustrates that at T=20°C, S and L concretes have similar porosity since intrusion curves show the same trend. For T=500°C however, clear discrepancies show up. The porous volume of S appears now almost twice smaller than the one of L (Vp(S) ≈0.9 cm3/g and Vp(L)≈0.5 cm3/g). This temperature falls in temperature domain D2 (see Figure 4) where CSH decomposes and dehydration of portlandite comes into play [31]. Figure 4 and Figure 5 indicate only limited mass differences in D2 (about 1%). The porosity change cannot therefore be attributed to differentiation in mass loss mechanisms. Structural changes in the material are instead to be considered here like porosity opening and increase of pores interconnection (for
example by the modification of bottleneck shaped pores). For T=500°C, the thermal expansion of the siliceous gravels, generated by the quartz phase change, contributes to the increase of their apparent volume, which can lead to the crushing of the porous network. This phenomenon may explain the fact that the pore volume of S concretes for this temperature is smaller than that for T=20°C when d<1µm.
For T > 800°C, temperatures are in D3. Intrusion curves are plotted in Figure 7(b). They saturate and therefore indicate that larger and open pores prevail. For T=820°C (resp. T=1000°C), L has porous volume Vp(L)≈0.35 cm3/g while for S, Vp(S)≈0.15 cm3/g (resp. Vp(L)≈0.8 cm3/g and Vp(S)≈0.55 cm3/g). For T=1000°C, millimetric sized pores are present. Mechanical and chemical alteration of the concrete is then sufficient for a relevant amount of mercury to already be intruded at low pressure. For such large temperatures, all the mechanisms discussed in the TGA section, like free and capillary water evaporation, portlandite and CSH dehydration and calcium carbonate decomposition come into play. This latter explains the larger porous volume for L concretes due to larger content in calcium carbonate.
Mercury intrusion curves of Figure 7 could be supplemented by the extrusion curves obtained after pressure decrease back to the atmospheric one. When performing such an intrusion/extrusion cycle, hysteresis appears. A small volume of mercury remains indeed trapped in the samples. This is the signature of constrictions in the topology of the porous network. Good reproducibility however is evidenced when proceeding with more intrusion/extrusion cycles indicating that the microstructure of the concretes resist to MIP measurements.
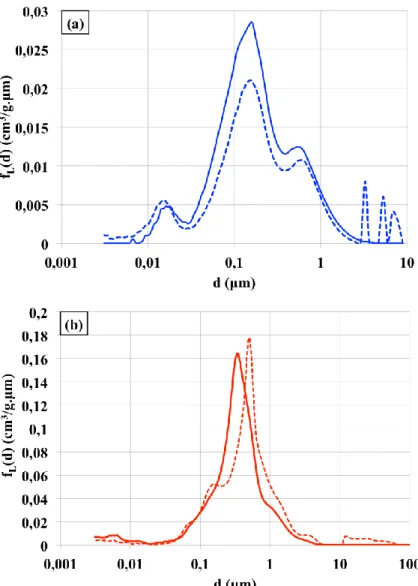
Figure 8 shows the pore diameter distribution obtained from the derivative of the intrusion curves displayed in Figure 7. This figure is interesting since it provides information about the evolution in the typical entrance size of the pores when changing temperature (it accounts for constriction modification). It will be mentioned as pore size in the following. Similarly to Figure 7, dashed lines correspond to S concretes while full lines show the trends for L concretes. Curves are complex but some specific properties can be discussed here in particular in the mesopore range. When considering the range d>8µm, Figure 8(a) demonstrates for example that large scales pores are formed when T=500°C. This is expected as pores open with increasing temperature and becomes strongly pronounced at even larger temperatures with, for example, at T=1000°C and d=10 µm, values of f(d) larger than 0.1 cm3/g.μm. Clear peaks are also present for both L and S concretes when d≈0.012 µm. This last value is denoted as d1 in the following. At T=20°C, the fraction of mesopores for L concretes is fL(d1,T)=9.10-3 cm3/g.μm and for S concretes fS(d1,T)≈4.10-3 cm3/g.μm (see Figure 8(b)). As curves are averages over several samples (see section 2), one can consider here mesopores in L concretes have a diameter typically twice larger than in S concretes. A similar trend also prevails for T=500°C as fL(d1,T)=1.9 10-2 cm3/g.μm and fS(d1,T)≈1.1 10-2 cm3/g.μm. For T=820°C and 1000°C, the maximum at d1 vanishes and a new one shows up at d2≈4 nm (see Figure 8(c)) with fL(d2,T)≈fS(d2,T)≈3.10-3 cm3/g.μm for T=820°C and fL(d2,T)≈1.6 10-2 cm3/g.μm (resp. fS(d2,T)≈9 10-3 cm3/g.μm for T=1000°C.
The above observations demonstrate how L and S concretes are damaged when exposed to increasing temperatures. Mesoporosity turn twice larger in L concretes and clear signature of microporosity is evidenced although not accessible with MIP. They do moreover evidence that in D2 and D3 different levels of mesoporosity comes into play. The fact that the typical mesopore size remains close to a constant value when increasing T from 20°C to 500°C is surprising since opening of the pores is expected. This should lead to a shift of the typical pore size to larger
values. But it is actually their fraction that increases indicating not only a good robustness towards thermal stress but also the presence of micropores that are destroyed and turned into mesopores of typical size d1. This behavior is prevailing for temperatures in D2 and is the consequence of the water release generated by CSH gel dehydration [40] and of the opening of fractures in the vicinity of the ITZ due to differentiated expansion of cement paste and gravels [41]. Another interesting observation here is the occurrence of new peaks when T is in D3. They are also created by micropore breakage but now produce smaller mesopores (d=4 nm instead of 12 nm). This is particularly clear for T=1000°C (Figure 8(c)).
Figure 8: (a) Pore size distribution obtained from the intrusion curves displayed of Figure 6(a) (legends and colors are the same). (b) zoom of (a) in the range d < 0.1 μm. (c) pore size distribution in the same range than (b) for T=820°C and T=1000°C.
Figure 9 presents the variation of 𝜌𝑎𝑏𝑠 (a) and of 𝜌𝑎𝑝𝑝 (b) (see Eq. 2) of S and L concretes as a function of T. When T=20°C, S and L concrete absolute densities have comparable values with 𝜌𝑎𝑏𝑠(𝑆)~𝜌𝑎𝑏𝑠(𝐿) = 2.6 ± 0.2𝑔/𝑐𝑚3 [42]. At 1000°C 𝜌𝑎𝑏𝑠(𝑆)~𝜌𝑎𝑏𝑠(𝐿)~2.5 ± 0.2 𝑔/𝑐𝑚3. Density therefore does not depend significantly on temperature. For 900°C < T < 1000°C the possibility of a liquid phase has been demonstrated and shown to generate vitreous phases [43]. This phenomenon is expected to create a densification of the material by sintering and can therefore to increase density. The regular trend of ρabs shown in Figure 9(a) indicates that such
phenomenon, if it occurs, is not measurable in the present experiments. Figure 9(b) displays the variation of the apparent density ρapp as a function of T. It behaves in a non-monotonous way. At T=20°C, ρapp(S) ≈ ρapp(L) = 2.30.17 g.cm-3. As temperature increases, the physicochemical changes taking place in the concretes are expected to produce a decrease in ρapp [27], [44]. Figure 9(b) shows instead an increase, especially for L concretes, for which ρapp (L)=3.00.1 g.cm-3 at T=500°C. It is attributed to the compaction of the CSH sheets following their dehydration for T in D2 [25]. For 500°C<T<650°C, the thermal expansion of siliceous aggregates, generated by the quartz phase change, contributes to the increase of apparent volume. This may be the reason why ρapp(S) is smaller that ρapp(L) in D2. When T is in D3, the expansion of siliceous gravels and degassing that accompanies the decomposition of calcite in limestone gravels explain the sharp fall of ρapp [27].
Figure 9: Temperature dependency of 𝜌𝑎𝑏𝑠 (a) and 𝜌𝑎𝑝𝑝 (b) for L (blue) and S (red) concretes. Temperature
domains, D1, D2 and D3 are represented (see Figure 4).
Thermal exchanges in concretes are determined by their thermal conductivity that depend upon their apparent density. Figure 9(a) showed that absolute densities are similar and Figure 7
that Vp(L)>Vp(S) when T>500°C. Gaz content is therefore larger in L concretes. Thermal conductivity of degraded L concretes is hence expected to be smaller than that of degraded S concretes. But in porous media, when investigating transfer mechanisms, specific surface area is also a fundamental input since it corresponds to the available surface for mass exchanges to occur. It monitors the kinetics of the exchanges and, in addition to porous volume, determines the properties of the flows inside the material. Large values of specific area contribute to enhance exchanges. The above MIP experiments have the great interest to give access to this parameter [45].
Figure 10(a) displays the behavior of the specific area as a function of T. Similarly to porous volumes Vp(L) and Vp(S), important differences between L and S concretes are again evidenced. The specific area A(L) of L concretes turns larger than the one, A(S), of S concretes in the entire temperature range. This is naturally the consequence of larger porous volumes resulting from the higher mass fraction of limestone in L concrete. The measurement points in Figure 10(a) were interpolated by fitting parabolas and suggest that A(S) (resp. A(L)) reaches a maximum at T~540°C (resp. T~690°C) with Amax(S)≈6.3 m2/g and Amax(L)≈10.0 m2/g. The temperature at which these maxima occur is uncertain due to the large error bars in the measurements at 700°C. The ratio A(L)/A(S) plotted in Figure 10(b) turns larger than 1.5 and increases up to 2.3 for T=1000°C. For a same temperature, L concretes offer therefore larger surfaces for exchanges than S ones. This last result, in addition to the fact that Vp(L)>Vp(S) (Figure 7) and ρapp(S) ≈ ρapp(L) (Figure 9(a)) suggest that mass flows and heat exchanges should be more favorable in L than is S concretes.
Figure 10: (a) Specific area as a function of temperature for L (blue) and S (red) concretes. Lines results from a quadratic fit. (b) Specific surface area ratio A(L)/A(S). Dashed line is the ratio of the fitting curves displayed in (a).
VULCANO-ICB experiments
The above results can now help to propose some hints for the understanding of corium-concrete interaction in the VULCANO-MCCI experiments. In these experiments, corium-concrete ablation profile is isotropic for L concretes and anisotropic for S ones. Enhanced radial ablation is also observed for S concretes suggesting locally higher heat flows. A scenario that can be invoked here relies on the ability of L concretes to support more efficient degassing and therefore to generate stronger turbulence in the molten corium. As mixing is more developed, homogeneity of the corium bath is improved. This enhances heat transfers within the corium and, consequently, at the corium/concrete interfaces that finally get damaged the same way and with the same kinetics. Conversely to L concretes, in S concretes hot points may develop and yield locally stronger damages. The plausibility of this scenario is reinforced by FH experiments that demonstrated a weight loss due to degassing more than twice larger for L concretes when T is in D3 (see Figure 5).
The loss of mechanical strength resulting from degassing is also key here. As heat transfer within L concretes is isotropic, concrete disaggregation is also isotropic. This contributes to
maintain degassing rate homogenous along the corium/concrete interface as corium cools down to ambient temperature. This most likely cannot occur in S concretes where corium cooling rate may become locally larger when running along the corium/concrete interface and therefore prevent degassing and concrete ablation to proceed with the same kinetics everywhere.
4. Conclusion
Two concretes, siliceous and limestone-siliceous, used in the construction of the pit of the French nuclear reactors have been characterized by thermo-gravimetric analysis and mercury intrusion porosimetry after exposition to temperatures ranging from room temperature up to 1000°C. Concretes being heterogeneous composite materials, the influence of temperature is first studied for crushed and monolith samples with TGA. Main results are the following:
• Thermo-gravimetric analysis allowed the identification of three temperature domains in which specific degradation mechanisms are activated.
• Evaporation of free water has led to define a first domain, dehydration, fracturing and decomposition of concrete hydrates including CSH and portlandite occur in a second domain.
• Finally, decarbonation of the calcium carbonate occur in a third domain. At moderate temperatures, mass losses range between 1 and 3% and turn similar for both siliceous and limestone-siliceous concretes. For large temperatures decarbonation affects mainly limestone-siliceous concretes because of their higher limestone content.
Besides TGA, samples were introduced in preheated furnaces and exposed to strong thermal gradients. This procedure creates moisture clog and is shown to generate a drastic reduction of mass loss when compared to thermo-gravimetric analysis. Measurements show that:
• The modifications in the microstructure of the concretes is further characterized by mercury intrusion porosimetry.
• Increase of porous volume with temperature is evidenced for macropores for both concretes. At T=1000°C, the porous volume of limestone-siliceous concretes is shown to be more than 40% larger than the one of siliceous concretes.
• In the mesopore range an increase of the number of pores is observed at moderate temperature and attributed to the destruction of micropores. Specific areas have been further estimated. At T=1000°C, limestone-siliceous concretes have specific areas that turn more than twice larger when compared to siliceous ones.
Finally, a scenario based on larger degassing rates in limestone-siliceous concretes is finally proposed to explain the differences in the ablation profiles evidenced in the VULCANO-MCCI experiments.
References
[1] P.C. Aitcin, Cements of yesterday and today: Concrete of tomorrow, Cem. and Conc. Res., 30(9) (2000) 1349-1359.
[2] J. Piasta, Heat deformations of cement paste phases and the microstructure of cement paste, Mater. and Struct., 17(6) (1984) 415-420.
[3] IRSN, L’échelle INES: Incidents et accidents,
https://www.irsn.fr/FR/connaissances/Installations_nucleaires/La_surete_Nucleaire/echelle-ines/Pages/2-Incidents-accidents.aspx#.W-1TO5NKjoA, 2009, (accessed 15 November 2018).
[4] D. Jacquemain, Les accidents de fusion du cœur des réacteurs nucléaire de puissance, EDP Sci., Sci. et Tech., 2013.
[5] C. Journeau, P. Piluso, J.-F. Haquet, E. Boccaccio, V. Saldo, J.-M. Bonnet, S. Malaval, L. Carenini, L. Brissonneau, Two-dimensional interaction of oxidic corium with concrete: The VULCANO-VB series, Annals of Nucl. Energ., 36(10) (2009) 1597-1613.
[6] Journeau C., P. Piluso, P. Correggio, L. Ferry, G. Fritz, J.-F. Haquet, J. Monerris, J.-M. Ruggieri, M. Sanchez-Busset, C. J. Parga, Contributions of the VULCANO experimental programme to the Understanding of MCCI phenomena, Nucl. Eng. and Technol., 44(3) (2012) 261-272.
[7] P.K. Mehta, P.J.M. Monteiro, Concrete: Microstructure, properties and materials, third ed., McGraw Hill, N.Y., USA, 2006.
[8] I. Hager, Behaviour of cement concrete at high temperature, Bull. of the Polish Academy of Sci., Tech. Sci., 61(1) (2013) 145-154.
[9] C. Alonso, L. Fernandez, Dehydration and rehydration processes of cement paste exposed to high temperature environments, J. of Mater. Sci., 39(9) (2004) 3015-3024.
[10] M. Castellote, C. Alonso, C. Andrade, X. Turrillas, J. Campo, Composition and microstructural changes of cement pastes upon heating, as studied by neutron diffraction, Cem. and Concr. Res., 34(9) (2004) 1633-1644.
[11] C.J. Fordham, I.J. Smalley, A simple thermogravimetric study of hydrated cement, Cem. and Concr. Res., 15(1) (1985) 141-144.
[12] L. Alarcon-Ruiz, G. Platret, E. Massieu, A. Ehrlacher, The use of thermal analysis in assessing the effect of temperature on a cement paste, Cem. and Concr. Res., 35(3) (2005) 609-613.
[13] Y. Pei, S.-C. Li, F. Agostini, F. Skoczylas, Effects of severe heating and rehydration on poro-mechanical properties of a mortar, Cem. and Concr. Res., 115 (2019) 460-471.
[14] A.H. Akca, N. Ozyurt, Effects of re-curing on microstructure of concrete after high temperature exposure, Constr. and Build. Mater., 168 (2018) 431-441.
[15] G.L. Golewski, An assessment of microcracks in the Interfacial Transition Zone of durable concrete composites with fly ash additives, Compos. Struct., 200 (2018) 515-520.
[16] G.L. Golewski, The influence of microcrack width on the mechanical parameters in concrete with the addition of fly ash: Consideration of technological and economical benefits, Constr. and Build. Mater., 197 (2019) 849-861.
[17] G.L. Golewski, Estimation of the optimum content of fly ash in concrete composite based on the analysis of fracture toughness tests using various measuring systems, Constr. and Build. Mater., 213 (2019) 142-155.
[18] D. Laing, C. Bahl, T. Bauer, D. Lehmann, W.-D. Steinmann, Thermal energy storage for direct steam generation, Sol. Energ., 85(4) (2011) 62-633.
[19] J. Piasta, Z. Sawicz, L. Rudzinski, Changes in the structure of hardened cement paste due to high temperature, Mater. and Struct., 17(4) (1984) 291-296.
[20] V. Baroghel-Bouny, Caractérisation des pâtes de ciment et des bétons. Méthodes, analyse, interprétations, Laboratoire Central des Ponts et Chaussées (LCPC), 1994.
[21] M.A.A. Salem, R. K. Pandey, Effect of air entrainment on compressive strength, density and ingredients of concrete, Inter. J. of Adv. in Mech. and Civ. Eng., 4(6) (2017) 7-9. [22] B. Georgali, P.E. Tsakiridis, Microstructure of fire-damaged concrete. A case study, Cem.
and Concr. Res., 27(2) (2005) 255-259.
[23] B. Fernandes, A. Masiero Gil, F. Bolina, B. Fonseca Tutikian, Microstructure of concrete subjected to elevated temperatures: physico-chemical changes and analysis techniques, IBRACON Struct. and Mater. J., 10(4) (2017) 838-863.
[24] M.D.M. Innocentini, F.A. Cardoso, M. M. Akyioshi, V.C. Pandolfelli, Drying stages during the heating of High-Alumina, Ultra-Low-Cement Refractory Castables, J. of the Am. Ceram. Soc., 86(7) (2004) 1146-1148.
[25] U. Schneider, U. Diederichs, C. Ehm, Effect of temperature on steel and concrete for PCRV’S, Nucl. Eng. and Des., 67(2) (1982) 245-258.
[26] C.R. Cruz, M. Gillen, Thermal expansion of Portland Cement Paste, Mortar and Concrete at high temperatures, Fire and Mater. J., 4(2) (1980) 66-70.
[27] Z.P. Bazant, M.F. Kaplan, Z.P., Concrete at High Temperatures: Material Properties and Mathematical Models, Longman, London, 1996.
[28] G.A. Khoury, B.N. Grainger, P.J.E. Sullivan, Strain of concrete during first heating to 600°C under load, Mag. of Concr. Res., 37(133) (1985) 195-215.
[29] F. Delhomme, J. Ambroise, A. Limam (2011). Influence de la substitution du ciment Portland par du laitier de haut fourneau sur des éprouvettes de mortier portées à hautes températures, Rabat, Morocco.
[30] D.S. De Toledo Pereira, F.J. Da Silva, A.B. Rodrigues Porto, V. Scarpini Candido, A. C. Rios Da Silva, F. Da Costa Garcia Filho, S. Neves Monteiro, Comparative analysis between properties and microstructures of geopolymeric concrete and Portland concrete, J. of Mater. Res. and Technol., 7(4) (2018) 606-611.
[31] H.F. Caetano, G. Ferreira, J.P.C. Rodrigues, P. Pimienta, Effect of the high temperatures on the microstructure and compressive strength of high strength fiber concretes, Constr. and Build. Mater., 199 (2018) 717-736.
[32] Z. Huang, P. Krishnan, S. Li, J.Y.R. Liew, Mechanical properties and microstructure of ultra-weight cement composites with fly ash cenospheres after exposure to high temperatures Constr. and Build. Mater., 164 (2018) 760-774.
Cem. and Concr. Res., 31 (2001) 1065-1073.
[34] T.Z. Harmathy, Effect of moisture on the fire endurance of building materials, Moisture in relation to fire tests, ASTM Spec. Tech. Publ., 385 (1965) 74-95.
[35] R. Jansson, 2013. Fire spalling of concrete – A historical overview. MATEC Web of Conferences. 6, 01001.
[36] K.M. Caldwell, P.K. Gallagher, D.W. Johnson Jr., Effect of Thermal Transport Mechanisms on the Thermal Decomposition of CaCO3, Thermochim. Acta, 18(1) (1977) 15-19.
[37] P.K. Gallagher, D.W. Johnson Jr., The Effects of Sample Size and Heating Rate on the Kinetics of the Thermal Decomposition of CaCO3, Thermochim. Acta, 6(1) (1973) 67-83. [38] I. Galan, F.P. Glasser, C. Andrade, Calcium carbonate decomposition, J. of Therm. Anal.
and Calorim., 111(2) (2013) 1197-1202.
[39] F.W. Willburn, J.H. Sharp, D.M. Tinsley, R.M. Mcintosh, The effect of procedural variables on TG, DTG and DTA curves of calcium carbonate, J. of Therm. Anal., 37(9) (1991) 2003-2019.
[40] L. Bodnarova, J. Valek, L. Sitek, J. Foldyna, Effect of high temperature on cement composite materials in concrete structures, Acta Geodyn. et Geomater., 10(2) (2013) 173-180.
[41] D.L.Y. Kong, J. G. Sanjayan, Effect of elevated temperature on geopolymer paste, mortar and concrete, Cem. and Concr. Res., 40(2) (2010) 334-339.
[42] M.G. Hernandez, M.A.G. Izquierdo, A. Ibanez, J.J. Anaya, L.G. Ullate, Porosity estimation of concrete by ultrasonic NDE, Ultrason., 38(1-8) (2000) 531-533.
[43] U. Schneider, C. Ehm, U. Diederichs (1983). The behaviour of concrete under attack of liquid steel. Netherlands. North-Holland.
[44] L. Pazdera, L. Topolar, K. Mikulasek, J. Smutny, H. Seelmann, Non-Linear Characteristics of Temperature Degraded Concrete at High Temperature, Proced. Eng., 190 (2017) 100-105.
[45] H. M. Rootare, C.F. Prenzlow, Surface areas from mercury porosimeter measurements, J. of Phys. Chem., 71(8) (1967) 2733-2736.