CHEST
Zsolt Szucs-Farkas&Boglarka Megyeri&Andreas Christe& Peter Vock&Johannes T. Heverhagen&Sebastian T. Schindera
Received: 26 November 2013 / Revised: 14 March 2014 / Accepted: 28 April 2014 / Published online: 28 May 2014 # European Society of Radiology 2014
Abstract
Objectives To find a threshold body weight (BW) below 100 kg above which computed tomography pulmonary angi-ography (CTPA) using reduced radiation and a reduced contrast material (CM) dose provides significantly im-paired quality and diagnostic confidence compared with standard-dose CTPA.
Methods In this prospectively randomised study of 501 pa-tients with suspected pulmonary embolism and BW <100 kg, 246 were allocated into the low-dose group (80 kVp, 75 ml CM) and 255 into the normal-dose group (100 kVp, 100 ml CM). Contrast-to-noise ratio (CNR) in the pulmonary trunk was calculated. Two blinded chest radiologists independently evaluated subjective image quality and diagnostic confidence. Data were compared between the normal-dose and low-dose groups in five BW subgroups.
Results Vessel attenuation did not differ between the normal-dose and low-normal-dose groups within each BW subgroup (P=1.0). The CNR was higher with the normal-dose compared with the
low-dose protocol (P<0.006) in all BW subgroups except for the 90-99 kg subgroup (P=0.812). Subjective image quality and diagnostic confidence did not differ between CT protocols in all subgroups (P between 0.960 and 1.0).
Conclusions Subjective image quality and diagnostic confi-dence with 80 kVp CTPA is not different from normal-dose protocol in any BW group up to 100 kg.
Key Points
• 80 kVp CTPA is safe in patients weighing <100 kg • Reduced radiation and iodine dose still provide high vessel
attenuation
• Image quality and diagnostic confidence with low-dose CTPA is good
• Diagnostic confidence does not deteriorate in obese patients weighing <100 kg
Keywords Angiography, computed tomography . Pulmonary embolism . Image quality . Radiation dose . Prospective randomised trial
Introduction
In recent years, low tube voltage has been shown to be a powerful tool for radiation dose reduction with computed tomography (CT) angiographic applications. Image quality of such protocols has been thoroughly investigated in virtually all body regions. Several experimental and clinical studies focused on CT pulmonary angiography (CTPA) because the low X-ray absorption of aerated lungs facilitates low-dose techniques by introducing lesser noise increase compared with abdominal applications [1–5]. It has been established that protocols at 100 kVp tube voltage provide very similar image quality to the formerly used 120 kVp and 140 kVp techniques at a significantly lower radiation dose. As a consequence, 100
Z. Szucs-Farkas
:
A. Christe:
P. Vock:
J. T. Heverhagen:
S. T. SchinderaUniversity Institute of Diagnostic, Interventional and Paediatric Radiology, Inselspital, University Hospital Bern, Freiburgstrasse 10, Berne 3010, Switzerland
Z. Szucs-Farkas (*)
Institute of Radiology, Hospital Centre of Biel, Vogelsang 84, Biel/ Bienne 2501, Switzerland
e-mail: [email protected] B. Megyeri
Department of Anaesthesiology and Intensive Care, University of Debrecen, Health and Medical Science Centre, Nagyerdei krt. 98, Debrecen 4012, Hungary
S. T. Schindera
Department of Radiology, University Hospital Basel, Petersgraben 4, Basel 4031, Switzerland
Prospective randomised comparison of diagnostic confidence
and image quality with normal-dose and low-dose CT pulmonary
angiography at various body weights
kVp tube energy is becoming more widely accepted as the standard for CTPA.
In the last decade, a tube voltage of 80 kVp has also been introduced for CTPA. One might apply low kVp at a constant iodine delivery rate solely for further reduction of radiation dose, which can reach 30-40 %, compared with 100 kVp protocols. A more interesting approach is to use the increased iodine attenuation at 80 kVp to reduce the volume of admin-istered contrast material (CM) to the patient. The combination of lower radiation dose and a reduced CM dose at 80 kVp CT angiography is potentially valuable, especially in younger patients and in elderly subjects with impaired renal function, not only for the lungs but also for other body regions [6–16]. Increased noise is a known potential disadvantage of the 80 kVp technique, which might impair its applicability in patients with higher body weight (BW) or body mass index (BMI). There is no consensus in the community regarding the threshold to which 80 kVp CTPA protocols can be used. Although results from a phantom study predicted that image quality is acceptable for diagnosis in a patient of up to 100 kg BW and the first clinical experiences strengthened these data [3, 7,17], most groups reserve 80 kVp CTPA for lean patients with low BMI or BW of less than 60-80 kg [9,10,18,19]. Moreover, no prospective data have been reported on whether confidence to rule in or out PE is affected by the low-dose protocol.
Herein we report on the image quality and diagnostic confi-dence from a large-scale single-centre prospective randomised study that compared a standard 100 kVp CTPA protocol with a low-dose protocol at 80 kVp using both reduced radiation and a reduced CM dose. Our aim was to find a threshold BW above which the low-dose protocol provides significantly impaired quality and diagnostic confidence compared with the standard protocol in patients weighing up to 100 kg.
Materials and methods
Patients
The REDOPED (Reduced Dose in Pulmonary Embolism Detection) trial was registered with ClinicalTrials.gov (NCT01258140) and was powered to find significant differences in accuracy with normal-dose and low-dose CTPA. The study was financially supported by the Stanley Thomas Johnson Foundation. The authors had no contractual obligations towards this founda-tion; they are neither its employees nor its consultants, and they had full control of the data and the information in this manuscript. The recruitment phase was open between September 2008 and December 2011 on a 7/24-h basis. Patients with indicated CTPA for suspected pulmonary embolism (PE) at the emer-gency department of the University Hospital Bern, Inselspital and weighing less than 100 kg, who signed the informed consent form, were randomly assigned to the normal-dose
(A) or low-dose (B) group. Exclusion criteria were age less than 18 years, and contraindication to intravenous administra-tion of iodinated contrast media. Patients weighing more than 100 kg were examined with the normal-dose protocol but were not included in the study. Morphological data, including BW and height, were recorded for all patients. Study subjects were blinded to their group assignment.
Of the 2,714 patients who underwent CTPA in the study period, only 504 were randomised. The high drop-out rate was mainly due to high overload of CT personnel or patients de-clining to participate in the study. Two of the 504 randomised patients withdrew their consent in retrospect and one patient was erroneously enrolled in the trial twice. Excluding these three examinations, the data of 501 patients were included in the final analysis. The normal-dose group consisted of 255 patients and the low-dose group of 246 patients (Fig.1).
CT protocols
The same 16-row multidetector CT system (Somatom Sensation 16; Siemens, Forchheim, Germany) was used for CTPA during the entire study period. A collimation of 16× 0.75 mm, pitch of 1.15 and tube rotation time of 0.5 s were kept unchanged in both groups. Automatic real-time tube current modulation (CareDose4D, level “average”) was switched on in all patients. In group A, we used a tube voltage of 100 kVp and a quality reference tube current time product of 100 mAs. In group B, the tube voltage was decreased to 80 kVp and the quality reference tube current time product was increased to 150 mAs. These parameters were based on a phantom study and provided good image quality in a smaller patient collective [3, 7]. All patients had their arms lying above the torso during the examination.
In both patient groups, the same standard iodinated contrast medium at 300 mg I/ml (iobitridol, Xenetix 300; Guerbet, Aulnay-sous-Bois, France) was administered in an antecubital vein through a 20- or 18-gauge canula using a commercial injector (CT Expres; Swiss Medical Care, Lausanne, Switzerland). One hundred millilitres of CM was injected at a flow rate of 4 ml/s in the normal-dose group (A) and 75 ml CM was injected at 3 ml/s in the low-dose group (B), resulting in equal injection times of 25 s. The contrast bolus was followed by a saline chaser of 20 ml at the same injection rates as for the CM. A bolus tracking technique (Care Bolus; Siemens) was used for optimal opacification of the pulmonary arteries, where-as image acquisition wwhere-as started 4 s after reaching 100 Hounsfield units (HU) in the main pulmonary artery.
Transverse images were contiguously reconstructed at 5 and 1 mm using standard filtered back projection and a smooth reconstruction kernel (B30f). Since maximum inten-sity projection (MIP) images are routinely used in our institute for aiding correct localisation of PE, overlapping MIP images were calculated from the 1-mm-thick transverse slices in the
coronal and transversal planes with 10-mm thickness at 2-mm increments. All images were stored in a picture archiving and communication system (PACS).
Analysis of objective image quality
The attenuation was measured by placing circular regions of interest of 75-100 mm2in the centre of the main pulmonary artery on the 1-mm-thick transverse images (HUtrunk). Care
was taken to avoid false registration of the vessel wall. The standard deviations of these CT numbers were used as image noise. The attenuation measured in the paraspinal muscles at the level of the pulmonary trunk served as background signal (HUbackgr.). All measurements were performed in three
differ-ent slices and the averages were used for further calculation. The contrast-to-noise ratio (CNR) was computed as CNR=(HUtrunk– HUbackgr.)/noise.
Assessment of subjective image quality and diagnostic confidence
All examinations were randomised and independently evalu-ated by two expert chest radiologists (Z.S.F., A.C.) with 13 and 11 years of experience with CTPA. Although the readers were not aware of patient data and technical parameters, including CT tube voltage, the latter was sometimes obvious from the image characteristics, preventing reliable blinding in this respect. The observers rated overall image quality in the 1-mm-thick transverse images using a five-grade scale (1=bad,
no diagnosis possible; 2=poor, diagnostic confidence signif-icantly reduced; 3=moderate, but sufficient for diagnosis; 4= good; 5=excellent). In the case of a score of 3 or less, readers gave one or more reasons for deteriorated image quality: 1= increased noise; 2=CM related, including too late or too early bolus, rapid CM dilution due to low CM flow, high cardiac output or shunt; 3=artefacts (respiratory, movement or metal-lic); 4=pathology in the lung parenchyma, including tumour, pneumonia or atelectasis; 5=significant pleural effusion; 6= other cause with a brief description.
Readers were asked to report the presence or absence of PE, along with the level of the affected artery (main, left or right pulmonary, lobar, segmental, 1st and 2nd subsegmental) and the confidence rate of the diagnosis (1=low; 2=medium; 3=high). An embolus was claimed to be present in the case of an intraluminal filling defect in at least three consecutive 1-mm-thick transverse images without major artefacts.
Observers entered their data into a table electronically. During the image analysis, adjustments of the window level, width, and magnification were allowed. The readers used both the original transverse CT images and the MIP reconstructions to localise PE. All image analyses were performed on high-definition LCD monitors routinely used for reporting CT images (ME355i2; Totoku Electric Co., Tokyo, Japan).
Radiation dose and figure of merit
The size-specific dose estimates (SSDE) were calculated for all patients by multiplying the volume CT dose index by a
2210 were not randomized: - 134 had exclusion criteria - 298 could not give informed consent - 14 were in prison
- 1764 had unspecified reasons
504 were randomized 2714 patients had CTPA
Normal-dose group n= 255
Low-dose group n= 249
255 were included in final analysis 246 were included in final analysis 3 were excluded:
- 1 was previously enrolled - 2 withdrew consent
Fig. 1 Selection and allocation of patients to the study groups
size-specific correction factor as determined in the American Association of Physicists in Medicine Report No. 204. Patient size was characterised by the effective diameter of the chest which was calculated as square root of the product of the anterioposterior and lateral chest diameters in centimetres [20]. Those diameters were measured on a transverse image at the level of the pulmonary trunk and on the anterioposterior CT radiograph (topogram).
In an effort to objectively analyse changes in image quality as function of dose at various patient weights, we calculated a figure of merit (FOM) as follows: FOM=CNR2/SSDE [3,21].
Statistical analysis
Patients were classified into five subgroups on the basis of their BW (<60 kg, 60-69 kg, 70-79 kg, 80-89 kg and 90-99 kg). In order to find any significant disadvantage of the low-dose protocol in obese patients, we also grouped study subjects on the basis of their BMI (<25 kg/m2=underweight and normal weight; 25-30 kg/m2=overweight; >30 kg/m2= obesity). Except for gender, all patient data and image param-eters were tested for normal distribution using the Shapiro-Wilk W test. Parameters with normal distribution were com-pared between the two dose groups and the various BW and BMI subgroups using analysis of variance and post hoc tests. Non-normally distributed data were compared with the Kruskal-Wallis test and gender ratio was analysed with the chi-squared test. The Kendall coefficient of concordance was computed to assess the interobserver agreement regarding overall image quality. Statistical analyses were performed with Statistica software (StatSoft, Tulsa, OK). A P value of less than 0.05 was considered statistically significant.
For the calculation of statistical power we estimated that each BW group would consist of 100 patients, 50 for each CTPA protocol. Supposing a standard deviation of 0.6, which was based on our former experience with three- and five-grade scales used for the confidence and image quality, a difference of 0.34 between the means can be proved with a power of 0.8 at a two-sided alpha-level of 0.05.
Results
Overall patient data in the normal-dose and low-dose groups
Demographic and morphological data
Unexpectedly, significantly more women were included in the low-dose group B than in the normal-dose group A (P=0.015; Table1). As a consequence, mean BW and height were higher in the normal-dose group. The difference in BMI in favour of the normal-dose group just reached statistical significance (P=0.0497).
Number of PEs detected by the readers
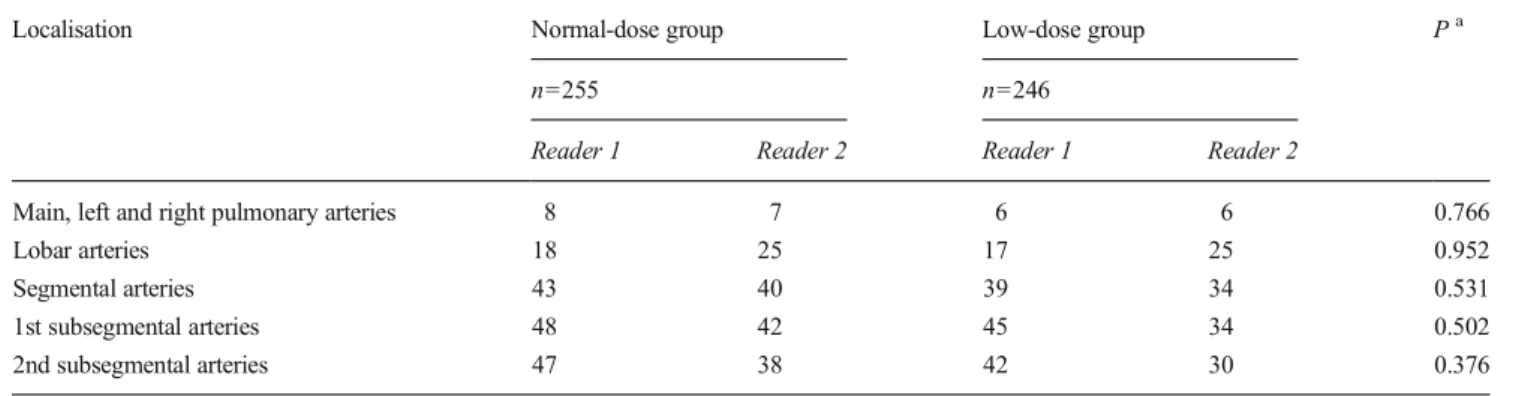
The number of patients with PE did not differ significantly between readers (P between 0.259 and 1.0) or between groups A and B at any level of the pulmonary arterial tree (P between 0.376 and 0.952; Table2). The salient inter-reader difference for the lobar arteries was resolved during a consensus reading and was due to discrepant interpretation of minimal involve-ment of lobar arteries at their ramifications.
Overall subjective rating of quality and cause for reduced image quality
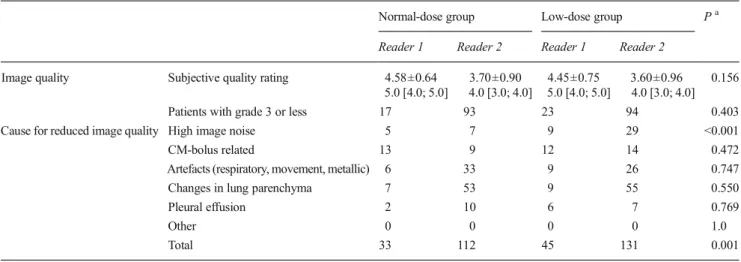
The overall rating of subjective image quality was very similar in groups A and B (P=0.156; Table3). The Kendall coeffi-cient of concordance between the readers for the subjective quality grading was 0.630. The number of patients with de-creased image quality (i.e. a grade of 3 or less) did not differ significantly between the groups (P=0.403). Readers marked a high noise level as a cause for impaired image quality more frequently in the low-dose group than in the normal-dose group (P<0.001).
Results in various BW groups
Gender ratio, age, BW, height and BMI were not significantly different between groups A and B within each BW subgroup (P between 0.069 and 1.0; Table1).
Objective image quality
Attenuation in the pulmonary trunk decreased with increasing BW in both groups A and B (P<0.001), but there was no difference between the normal-dose and low-dose groups within each BW subgroup (P=1.0; Fig. 2). Except for the <60-kg (P=0.093) and the 90- to 99-kg groups (P=0.123), image noise was higher in the low-dose group in all BW classes (P<0.001). CNR was higher with the normal-dose protocol compared with the low-dose protocol (P<0.006) in all BW subgroups except for the 90- to 99-kg subgroup (P= 0.812).
Subjective image quality and diagnostic confidence
Both subjective image quality (P between 0.622 and 1.0) and diagnostic confidence (P between 0.960 and 1.0) were rated similarly with both CT protocols in all BW subgroups (Figs. 2 and 3).
Radiation dose and FOM
SSDE was significantly lower with the low-dose CTPA pro-tocol in all BW subgroups (P<0.001). The mean SSDE was
6.8 mGy±1.2 in the normal-dose group and 4.8 mGy±1.0 in the low-dose group (P<0.001), corresponding to a decrease of 30 %. SSDE was not significantly different between BW subgroups above 60 kg within each CT protocol (P between 0.292 and 1.0).
FOM was in general higher at lower BWs than in patients with higher BW, but there was no significant difference between the BW subgroups above 70 kg with the normal-dose protocol and above 80 kg at 80 kVp. Within each BW subgroup, 100 kVp and 80 kVp CTPA yielded very similar results (P between 0.724 and 1.0; Fig. 2).
Results in various BMI groups
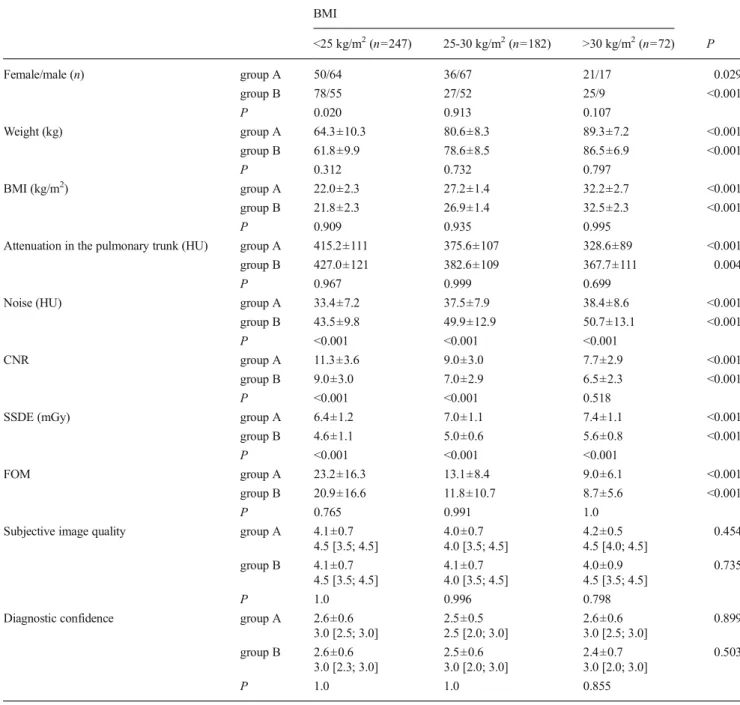
Although only patients weighing less than 100 kg were included in this trial, 254 of 501 (50.7 %) study subjects were classified as being overweight or obese (i.e. BMI >25 kg/m2; Table 4). Radiation exposure was significantly lower in the low-dose group than in the normal-dose group within all BMI subgroups (P<0.001) and the same was true for CNR in normal-weight and overweight patients, but not in obese patients (P=0.518). FOM, subjective image quality rating, and diagnostic confidence were not different between CTPA protocols within each BMI sub-group (P between 0.765 and 1.0).
Table 1 Descriptive statistics of demographic and morphological data of 501 study patients All patients Patients grouped by body weight
<60 kg (n=89) 60-69 kg (n=117) 70-79 kg (n=116) 80-89 kg (n=122) 90-99 kg (n=57) Pa Female/male (n) group A 107/148 30/9 26/22 22/42 21/47 8/28 <0.001 group B 130/116 42/8 43/26 21/31 17/37 7/14 <0.001 P 0.015 0.399 0.378 0.069 0.943 0.358
Age (years) group A 59.5±16.4 54.6±19.6 59.8±17.4 63.3±14.6 59.9±16.2 56.8±13.1 0.091 group B 57.4±17.8 55.0±19.4 59.2±19.9 59.8±16.4 56.6±16.8 53.2±16.0 0.433 P 0.168 1.0 1.0 0.986 0.991 0.997 Weight (kg) group A 74.6±13.3 53.1±4.8 65.1±3.0 74.2±3.0 83.7±2.9 94.3±3.4 <0.001 group B 70.6±13.4 52.2±5.7 63.9±3.0 74.7±2.8 83.6±3.0 93.1±3.4 <0.001 P <0.001 0.980 0.902 0.999 1.0 0.995 Height (cm) group A 170.5±9.3 163.2±8.1 167.7±8.3 170.4±7.8 173.1±8.4 177.3±9.0 <0.001 group B 168.3±9.1 162.0±7.6 166.8±6.8 170.0±7.9 172.1±9.9 174.6±9.5 <0.001 P 0.009 1.0 1.0 1.0 1.0 0.993 BMI (kg/m2) group A 25.7±4.2 20.0±2.1 23.3±2.3 25.7±2.5 28.1±2.7 30.2±3.6 <0.001 group B 24.9±4.4 19.9±2.4 23.1±1.8 26.0±2.6 28.5±3.4 30.8±3.6 <0.001 P 0.0497 1.0 1.0 1.0 1.0 1.0
Data are means and standard deviations except for gender. For each parameter, the third row contains P values for comparisons of study groups A and B BMI body mass index
a
P values for differences between various body weight groups
Table 2 Pulmonary emboli found by readers in both study groups
Localisation Normal-dose group Low-dose group Pa
n=255 n=246
Reader 1 Reader 2 Reader 1 Reader 2
Main, left and right pulmonary arteries 8 7 6 6 0.766
Lobar arteries 18 25 17 25 0.952
Segmental arteries 43 40 39 34 0.531
1st subsegmental arteries 48 42 45 34 0.502 2nd subsegmental arteries 47 38 42 30 0.376 Numbers are patients with PE at the corresponding anatomical level of the pulmonary arterial tree
a
Discussion
Former studies on low-dose CTPA were mainly retro-spective in nature, we are aware of only one proretro-spective study analysing data of 70 consecutive patients [9]. None of those series focused on image quality and diagnostic confidence in different BW groups because of the relatively low numbers of patients included. Results of our large-scale prospective randomised trial on 501 patients provide evidence that subjective image quality and diagnostic confidence for detecting PE with normal-dose CTPA at 100 kVp and with low-dose CTPA at 80 kVp tube energy, using a reduced radiation dose by 30 % and a reduced iodine load by 25 %, do not differ significantly up to a BW of 100 kg. The weight limit of 100 kg seems to be valid for the 80 kVp CTPA protocol, as we found no significant difference in subjective image quality and diagnostic confidence compared with the normal-dose protocol in any of the BW subgroups. Nor were these parameters for both protocols significantly different in obese pa-tients with BMI >30 kg/m2. The number of detected PE with both CTPA protocols was not different at all ram-ification levels. These data confirm findings of former experimental and retrospective studies [8, 22].
Despite the reduced iodine flux by 25 % in the low-dose group, the mean attenuation in the pulmonary trunk did not differ from that measured in the normal-dose group. As a net effect, together with the increased image noise, CNR was lower in the low-dose group. These results are well explained by the physical prop-erties of iodine at low kVp and consistent with
measurements in a chest phantom predicting increased attenuation by 25 % at constant iodine concentration when reducing tube voltage from 100 to 80 kVp [3, 23, 24]. On the contrary, an initial retrospective com-parison in 90 patients showed that CTPA using 80 kVp and less CM by 25 % provided higher vessel attenua-tion and a similar CNR to the standard CTPA protocol at 100 kVp [7]. The current prospective randomised trial, with its markedly higher numbers of patients, provides more reliable data.
The analysis of the FOM, a parameter characterising improvement of CNR per exposure risk to the patient, showed that kVp reduction is more important in thin patients than in large patients, as FOM was higher at lower BW. As BW rises, scattering becomes an impor-tant factor and leads to higher image noise. A reduced iodine signal at a higher BW because of beam harden-ing also deteriorates CNR in large patients [25]. The fact that FOM did not differ between the normal-dose and low-dose groups in any weight classes indicates that the lower CNR at 80 kVp is well in balance with the reduced radiation dose compared with the 100 kVp group. The analysis of accuracy in the REDOPED study did not find any significant difference between CTPA protocols [26].
Our trial had some limitations. Most important, only patients weighing less than 100 kg were included in the
Table 3 Subjective image quality as rated by the readers with causes for diminished subjective image quality in the normal-dose and low-dose groups Normal-dose group Low-dose group Pa Reader 1 Reader 2 Reader 1 Reader 2
Image quality Subjective quality rating 4.58±0.64 3.70±0.90 4.45±0.75 3.60±0.96 0.156 5.0 [4.0; 5.0] 4.0 [3.0; 4.0] 5.0 [4.0; 5.0] 4.0 [3.0; 4.0] Patients with grade 3 or less 17 93 23 94 0.403 Cause for reduced image quality High image noise 5 7 9 29 <0.001 CM-bolus related 13 9 12 14 0.472 Artefacts (respiratory, movement, metallic) 6 33 9 26 0.747 Changes in lung parenchyma 7 53 9 55 0.550
Pleural effusion 2 10 6 7 0.769
Other 0 0 0 0 1.0
Total 33 112 45 131 0.001
Data for subjective image quality are mean ± standard deviation, followed by the median and the quartile range in brackets. Other data are number of patients. Readers often noted more than one cause for reduced image quality in the same patient
a
P values for differences between the normal-dose and low-dose groups, based on averaged data over both readers
Fig. 2 Box-and-whisker plots depicting objective and subjective parameters assessed with normal-dose (group A) and low-dose CTPA (group B) at various body weights. The middle point of the box represents the mean, the box values represent the standard error, and the whiskers represent the standard deviation. CNR contrast-to-noise ratio
study, since results from phantom experiments predicted a significantly decreased image quality above this BW. Our subjective impression in real patients was that the 80 kVp protocol would in fact result in an image noise level that would impede diagnosis above 100 kg. However, there are no objective data to support this observation. We cannot explain the unexpected differ-ence in the sex ratio between the study groups, as analysis of study records did not reveal systemic error or protocol violation during patient enrolment. This difference, however, did not influence the comparisons within the various weight subgroups. Although the trial included 501 individuals, the number of patients with a BW of <60 kg and 90-99 kg or with a BMI >30 kg/m2 was relatively low, with a negative impact on the sta-tistical power in these subgroups. Our CT unit was equipped with a relatively old detector and did not use
iterative image reconstruction, since at the start of our study this tool was not yet widely available. This shows that a significant dose reduction is possible even with older CT units. From some recently published encour-aging results on low kVp CTPA combined with iterative reconstruction [19], we are convinced that the latest hardware would result in significant improvement of image quality with the 80 kVp protocol, which could facilitate its wider acceptance among radiologists or may permit the examination of patients weighing more than 100 kg. The injection time of 25 s with both CTPA protocols was rather long. More rapid scanning techniques requiring a shorter contrast bolus enable a decrease in total iodine load to the patient. We also note that the applicability of low tube voltage can be shifted towards higher BWs when using stronger real time mAs modulation. Thus, there is significant potential in our
A B C D E F G H I J
Fig. 3 Transversal 1-mm-thick slices at the level of the main pulmonary artery to demonstrate image quality with normal-dose CTPA (A, B, C, D, E) and low-dose CTPA (F, G, H, I, J) in patients from various body weight groups. The window level was set at 100 HU and the window width at 500 HU in each case. Body weights were as follows: A 51 kg, B 62 kg, C 71 kg, D 89 kg, E 94 kg, F 56 kg, G 66 kg, H 73 kg, I 82 kg, J 92 kg. Pulmonary emboli are seen in images A, C, D, E, G, H, I and J
low-dose protocol for further optimisation. Since CTPA examinations have the primary goal to rule in or out PE, our quality assessment focused on the pulmonary arteries. Although analysis of image quality in the me-diastinum and lung parenchyma was no subject of this investigation, our experience shows that major patholo-gies can be excluded in both of those localisations at 80 kVp, even in filtered back projection images.
In conclusion, 80-kVp CTPA using reduced radiation ex-posure and a reduced CM dose does not significantly differ
from the normal-dose protocol at 100 kVp with regard to subjective image quality or diagnostic confidence in any BW class up to 100 kg. More recent technical implications will enable further dose reduction and quality improvement of the 80-kVp protocol.
Acknowledgements The scientific guarantor of this publication is Zsolt Szucs-Farkas, M.D. The authors of this manuscript declare relation-ships with the following companies: J.T.H.—research grants from Bracco SA, Siemens AG and Guerbet; S.T.S.—research grant from Siemens AG. Table 4 Patient characteristics, image quality and diagnostic confidence in various BMI groups
BMI <25 kg/m2(n=247) 25-30 kg/m2(n=182) >30 kg/m2(n=72) P Female/male (n) group A 50/64 36/67 21/17 0.029 group B 78/55 27/52 25/9 <0.001 P 0.020 0.913 0.107 Weight (kg) group A 64.3±10.3 80.6±8.3 89.3±7.2 <0.001 group B 61.8±9.9 78.6±8.5 86.5±6.9 <0.001 P 0.312 0.732 0.797 BMI (kg/m2) group A 22.0±2.3 27.2±1.4 32.2±2.7 <0.001 group B 21.8±2.3 26.9±1.4 32.5±2.3 <0.001 P 0.909 0.935 0.995
Attenuation in the pulmonary trunk (HU) group A 415.2±111 375.6±107 328.6±89 <0.001 group B 427.0±121 382.6±109 367.7±111 0.004
P 0.967 0.999 0.699
Noise (HU) group A 33.4±7.2 37.5±7.9 38.4±8.6 <0.001 group B 43.5±9.8 49.9±12.9 50.7±13.1 <0.001 P <0.001 <0.001 <0.001
CNR group A 11.3±3.6 9.0±3.0 7.7±2.9 <0.001 group B 9.0±3.0 7.0±2.9 6.5±2.3 <0.001 P <0.001 <0.001 0.518
SSDE (mGy) group A 6.4±1.2 7.0±1.1 7.4±1.1 <0.001 group B 4.6±1.1 5.0±0.6 5.6±0.8 <0.001 P <0.001 <0.001 <0.001
FOM group A 23.2±16.3 13.1±8.4 9.0±6.1 <0.001 group B 20.9±16.6 11.8±10.7 8.7±5.6 <0.001
P 0.765 0.991 1.0
Subjective image quality group A 4.1±0.7 4.0±0.7 4.2±0.5 0.454 4.5 [3.5; 4.5] 4.0 [3.5; 4.5] 4.5 [4.0; 4.5]
group B 4.1±0.7 4.1±0.7 4.0±0.9 0.735 4.5 [3.5; 4.5] 4.0 [3.5; 4.5] 4.5 [3.5; 4.5]
P 1.0 0.996 0.798
Diagnostic confidence group A 2.6±0.6 2.5±0.5 2.6±0.6 0.899 3.0 [2.5; 3.0] 2.5 [2.0; 3.0] 3.0 [2.5; 3.0]
group B 2.6±0.6 2.5±0.6 2.4±0.7 0.503 3.0 [2.3; 3.0] 3.0 [2.0; 3.0] 3.0 [2.0; 3.0]
P 1.0 1.0 0.855
Data are mean ± standard deviation. For subjective image quality and diagnostic confidence, the median is also given with the lower and upper quartiles in brackets
This study has received funding from the Stanley Thomas Johnson Foundation. Mr. Samuel Iff, M.D., M.Sc. kindly provided statistical advice for this manuscript. One of the authors has significant statistical expertise. Institutional Review Board approval was obtained. Written informed consent was obtained from all subjects (patients) in this study. Some study subjects or cohorts have been previously reported by Szucs-Farkas et al. [26]. Methodology: prospective, randomised controlled trial, performed at one institution.
References
1. Schueller-Weidekamm C, Schaefer-Prokop CM, Weber M, Herold CJ, Prokop M (2006) CT angiography of pulmonary arteries to detect pulmonary embolism: improvement of vascular enhancement with low kilovoltage settings. Radiology 241:899–907
2. Heyer CM, Mohr PS, Lemburg SP, Peters SA, Nicolas V (2007) Image quality and radiation exposure at pulmonary CT angiography with 100- or 120-kVp protocol: prospective randomized study. Radiology 245:577–583
3. Szucs-Farkas Z, Verdun FR, von Allmen G, Mini RL, Vock P (2008) Effect of X-ray tube parameters, iodine concentration, and patient size on image quality in pulmonary computed tomography angiog-raphy: a chest-phantom-study. Invest Radiol 43:374–381
4. Fanous R, Kashani H, Jimenez L, Murphy G, Paul NS (2012) Image quality and radiation dose of pulmonary CT angiography performed using 100 and 120 kVp. AJR Am J Roentgenol 199:990–996 5. Matsuoka S, Hunsaker AR, Gill RR et al (2009) Vascular
enhance-ment and image quality of MDCT pulmonary angiography in 400 cases: comparison of standard and low kilovoltage settings. AJR Am J Roentgenol 192:1651–1656
6. Sigal-Cinqualbre AB, Hennequin R, Abada HT, Chen X, Paul JF (2004) Low-kilovoltage multi-detector row chest CT in adults: feasibility and effect on image quality and iodine dose. Radiology 231:169–174 7. Szucs-Farkas Z, Kurmann L, Strautz T, Patak MA, Vock P, Schindera
ST (2008) Patient exposure and image quality of low-dose pulmo-nary computed tomography angiography: comparison of 100- and 80-kVp protocols. Invest Radiol 43:871–876
8. Szucs-Farkas Z, Schaller C, Bensler S, Patak MA, Vock P, Schindera ST (2009) Detection of pulmonary emboli with CT angiography at reduced radiation exposure and contrast material volume: compari-son of 80 kVp and 120 kVp protocols in a matched cohort. Invest Radiol 44:793–799
9. Viteri-Ramirez G, Garcia-Lallana A, Simon-Yarza I et al (2012) Low radiation and low-contrast dose pulmonary CT angiography: com-parison of 80 kVp/60 ml and 100 kVp/80 ml protocols. Clin Radiol 67:833–839
10. Kristiansson M, Holmquist F, Nyman U (2009) Ultralow contrast medium doses at CT to diagnose pulmonary embolism in patients with moderate to severe renal impairment: a feasibility study. Eur Radiol 20:1321–1330
11. Holmquist F, Hansson K, Pasquariello F, Bjork J, Nyman U (2009) Minimizing contrast medium doses to diagnose pulmonary embolism with 80-kVp multidetector computed tomography in azotemic pa-tients. Acta Radiol 50:181–193
12. Holmquist F, Nyman U (2006) Eighty-peak kilovoltage 16-channel multidetector computed tomography and reduced contrast-medium doses tailored to body weight to diagnose pulmonary embolism in azotaemic patients. Eur Radiol 16:1165–1176
13. Chen CM, Chu SY, Hsu MY, Liao YL, Tsai HY (2014) Low-tube-voltage (80 kVp) CT aortography using 320-row volume CT with adaptive iterative reconstruction: lower contrast medium and radia-tion dose. Eur Radiol 24:460–468
14. Sommer WH, Helck A, Bamberg F et al (2010) Diagnostic value of time-resolved CT angiography for the lower leg. Eur Radiol 20: 2876–2881
15. Bahner ML, Bengel A, Brix G, Zuna I, Kauczor HU, Delorme S (2005) Improved vascular opacification in cerebral computed tomog-raphy angiogtomog-raphy with 80 kVp. Invest Radiol 40:229–234 16. Schindera ST, Graca P, Patak MA et al (2009)
Thoracoabdominal-aortoiliac multidetector-row CT angiography at 80 and 100 kVp: assessment of image quality and radiation dose. Invest Radiol 44: 650–655
17. Szucs-Farkas Z, Strautz T, Patak MA, Kurmann L, Vock P, Schindera ST (2009) Is body weight the most appropriate criterion to select patients eligible for low-dose pulmonary CT angiography? Analysis of objective and subjective image quality at 80 kVp in 100 patients. Eur Radiol 19:1914–1922
18. Faggioni L, Neri E, Sbragia P et al (2012) 80-kV pulmonary CT angiography with 40 mL of iodinated contrast material in lean pa-tients: comparison of vascular enhancement with iodixanol (320 mg I/mL) and iomeprol (400 mg I/mL). AJR Am J Roentgenol 199: 1220–1225
19. Pontana F, Pagniez J, Duhamel A et al (2013) Reduced-dose low-voltage chest CT angiography with sinogram-affirmed iterative re-construction versus standard-dose filtered back projection. Radiology 267:609–618
20. The American Association of Physicists in Medicine (2011) Size-specific dose estimates (SSDE) in pediatric and adult body CT examinations. AAPM Report No. 204. American Association of Physicists in Medicine, College Park
21. Wong J, Xu T, Husain A, Le H, Molloi S (2004) Effect of area x-ray beam equalization on image quality and dose in digital mammogra-phy. Phys Med Biol 49:3539–3557
22. Szucs-Farkas Z, Schibler F, Cullmann J et al (2011) Diagnostic accu-racy of pulmonary CT angiography at low tube voltage: intraindividual comparison of a normal-dose protocol at 120 kVp and a low-dose protocol at 80 kVp using reduced amount of contrast medium in a simulation study. AJR Am J Roentgenol 197:W852–W859
23. Huda W, Scalzetti EM, Levin G (2000) Technique factors and image quality as functions of patient weight at abdominal CT. Radiology 217:430–435
24. Wolbarst A (1993) The formation of a radiographic image. In: Physics of radiology. Appleton and Lange, East Norwalk, pp 147-205 25. Schindera ST, Tock I, Marin D et al (2010) Effect of beam hardening
on arterial enhancement in thoracoabdominal CT angiography with increasing patient size: an in vitro and in vivo study. Radiology 256:528–535
26. Szucs-Farkas Z, Christe A, Megyeri B et al (2014) Diagnostic accu-racy of computed tomography pulmonary angiography with reduced radiation and contrast material dose: a prospective randomized clin-ical trial. Invest Radiol 49:201–208