Deadly heat waves projected in the densely
populated agricultural regions of South Asia
The MIT Faculty has made this article openly available.
Please share
how this access benefits you. Your story matters.
Citation
Im, Eun-Soon, Jeremy S. Pal, and Elfatih A. B. Eltahir. “Deadly Heat
Waves Projected in the Densely Populated Agricultural Regions of
South Asia.” Science Advances 3, no. 8 (August 2017): e1603322.
As Published
http://dx.doi.org/10.1126/SCIADV.1603322
Publisher
American Association for the Advancement of Science (AAAS)
Version
Final published version
Citable link
http://hdl.handle.net/1721.1/113642
Terms of Use
Attribution-NonCommercial 2.0 Generic (CC BY-NC 2.0)
C L I M A T O L O G Y Copyright © 2017 The Authors, some rights reserved; exclusive licensee American Association for the Advancement of Science. No claim to original U.S. Government Works. Distributed under a Creative Commons Attribution NonCommercial License 4.0 (CC BY-NC).
Deadly heat waves projected in the densely populated
agricultural regions of South Asia
Eun-Soon Im,1* Jeremy S. Pal,2* Elfatih A. B. Eltahir3†The risk associated with any climate change impact reflects intensity of natural hazard and level of human vul-nerability. Previous work has shown that a wet-bulb temperature of 35°C can be considered an upper limit on human survivability. On the basis of an ensemble of high-resolution climate change simulations, we project that extremes of wet-bulb temperature in South Asia are likely to approach and, in a few locations, exceed this critical threshold by the late 21st century under the business-as-usual scenario of future greenhouse gas emissions. The most intense hazard from extreme future heat waves is concentrated around densely populated agricultural re-gions of the Ganges and Indus river basins. Climate change, without mitigation, presents a serious and unique risk in South Asia, a region inhabited by about one-fifth of the global human population, due to an unprecedented combination of severe natural hazard and acute vulnerability.
INTRODUCTION
The risk of human illness and mortality increases in hot and humid weather associated with heat waves. Sherwood and Huber (1) pro-posed the concept of a human survivability threshold based on wet-bulb temperature (TW). TW is defined as the temperature that an air parcel would attain if cooled at constant pressure by evaporating water within it until saturation. It is a combined measure of temperature [that is, dry-bulb temperature (T)] and humidity (Q) that is always less than or equal toT. High values of TW imply hot and humid conditions and vice versa. The increase inTW reduces the differential between hu-man body skin temperature and the inner temperature of the huhu-man body, which reduces the human body’s ability to cool itself (2). Because normal human body temperature is maintained within a very narrow limit of ±1°C (3), disruption of the body’s ability to regulate temperature can immediately impair physical and cognitive functions (4). If ambient airTW exceeds 35°C (typical human body skin temperature under warm conditions), metabolic heat can no longer be dissipated. Human exposure toTW of around 35°C for even a few hours will result in death even for the fittest of humans under shaded, well-ventilated conditions (1). While TW well below 35°C can pose dangerous conditions for most humans, 35°C can be considered an upper limit on human survivability in a natural (not air-conditioned) environment. Here, we consider max-imum dailyTW values averaged over a 6-hour window (TWmax), which
is considered the maximum duration fit humans can survive at 35°C.
HISTORICAL DISTRIBUTION OF MAXIMUM WET-BULB TEMPERATURE
According to the global historical reanalysis for modern record (1979– 2015) (5), the largest TWmaxrarely exceeds 31°C in the current climate.
However, three extensive regions, where values exceed 28°C, are ob-served: southwest Asia around the Persian/Arabian Gulf and Red Sea, South Asia in the Indus and Ganges river valleys, and eastern China
(Fig. 1). To identify the precise reasons for highTW, individual studies need to be performed because of each region’s unique geography and climate. The underlying reasons why southwest Asia stands out are dis-cussed by Pal and Eltahir (6), who concluded that future TWmaxaround
the Persian/Arabian Gulf region is likely to exceed theTW threshold for human survivability by the end of the century under a business-as-usual (BAU) scenario of atmospheric greenhouse gas (GHG) concentrations. In summer 2015,TW in the Bandar Mahshahr, Iran Persian/Arabian Gulf, reached nearly 35°C, suggesting that the threshold may be breached sooner than projected (7). In this study, we shift our attention to the region of South Asia, here defined as Pakistan, Nepal, India, Bangladesh, and Sri Lanka. The northern part of this region is the second hottest after southwest Asia but is more expansive when considering the land area affected.
Heat waves and their impacts on human health are combined consequences of high dry-bulb temperatures and humidity (that is, highTW) and the vulnerability of the population. Many previous studies have investigated the impacts of anthropogenic climate change on heat waves and human health (8, 9). However, it is not until more recently that the combined effects of temperature and hu-midity have been more commonly considered. For example, the Fourth Assessment Report of the Intergovernmental Panel on Climate Change (IPCC) (10) when making projections about future heat waves only considersT. However, the latest IPCC report (11) does consider the combined effects ofT and Q when considering working conditions, which are projected to worsen considerably in many re-gions (12, 13). In addition, studies that include the combined effects at a global scale are largely based on output from climate models with resolutions on the order of 100 to 200 km (1, 14). Studies that are based on higher-resolution simulations are generally focused on North America and Europe (15, 16). However, the most detrimental human impacts of climate change on heat waves could potentially be those in developing nations because of the vulnerability of their populations. In much of India and Pakistan, an apparent rising trend in the frequency of deadly heat waves has been observed (17–19). For example, severe heat waves resulting in thousands of deaths to humans and livestock were reported around Odisha (eastern India) in 1998, Andhra Pradesh in 2003, and Ahmadabad and other parts of Gujarat (western India) in 2010 (20). In particular, the fifth deadliest heat wave in recorded history (21) affected large parts of India and Pakistan, claiming around 1
Division of Environment and Sustainability, Department of Civil and Environmental Engineering, The Hong Kong University of Science and Technology, Kowloon, Hong Kong.
2Department of Civil Engineering and Environmental Science, Loyola Marymount
University, Los Angeles, CA 90045, USA.3Ralph M. Parsons Laboratory, Massachusetts Institute of Technology, Cambridge, MA 02139, USA.
*These authors contributed equally to this work. †Corresponding author. Email: eltahir@mit.edu
on February 9, 2018
http://advances.sciencemag.org/
3500 lives in 2015 (22). We note that the large positive departure of max-imum temperature from the climatology during the heat wave periods largely coincides with the areas (particularly in Uttar Pradesh, Bihar, and Odisha) whereTW is projected to approach or exceed the survivability threshold under the Representative Concentration Pathway 8.5 (RCP 8.5) scenario (see Fig. 2) (23).
IMPACTS OF CLIMATE CHANGE
To study the potential impacts of climate change on human health due to extremeTW in South Asia, we apply the Massachusetts Institute of Technology Regional Climate Model (MRCM) (24) forced at the lateral and sea surface boundaries by output from three simulations from the Coupled Model Intercomparison Project Phase 5 (CMIP5) coupled Atmosphere-Ocean Global Climate Model (AOGCM) experiments (25). By conducting high-resolution simulations, we include detailed representations of topography and coastlines as well as detailed physical
processes related to the land surface and atmospheric physics, which are lacking in coarser-resolution AOGCM simulations (26). On the basis of our comparison of MRCM simulations driven by three AOGCMs for the historical period 1976–2005 (HIST) against reanalysis and in situ observational data, MRCM shows reasonable performance in capturing the climatological and geographical features of mean and extremeTW over South Asia. Furthermore, the mean biases of MRCM simulations are statistically corrected at the daily time scale to enhance the reliability of future projections (see Materials and Methods). We project the potential impacts of future climate change toward the end of century (2071–2100), assuming two GHG concentration scenarios based on the RCP trajectories (27): RCP4.5 and RCP8.5. RCP8.5 represents a BAU scenario resulting in a global CMIP5 ensemble average surface temperature increase of approximately 4.5°C. RCP4.5 includes mod-erate mitigation resulting in approximately 2.25°C average warming, slightly higher than what has been pledged by the 2015 United Nations Conference on Climate Change (COP21).
Fig. 1. Spatial distribution of highest daily maximum wet-bulb temperature,TWmax(°C), in modern record (1979–2015). Global distribution of TWmaxis computed
using ERA-Interim 3-hourly data with 0.75° × 0.75° horizontal resolution. The enlarged domain highlights three distinguishable regions with higher TWmax: southwest Asia
around the Persian/Arabian Gulf and Red Sea, South Asia in the Indus and Ganges river valleys, and eastern China. TWmaxvalues below 27°C are not shown.
on February 9, 2018
http://advances.sciencemag.org/
B A
C D
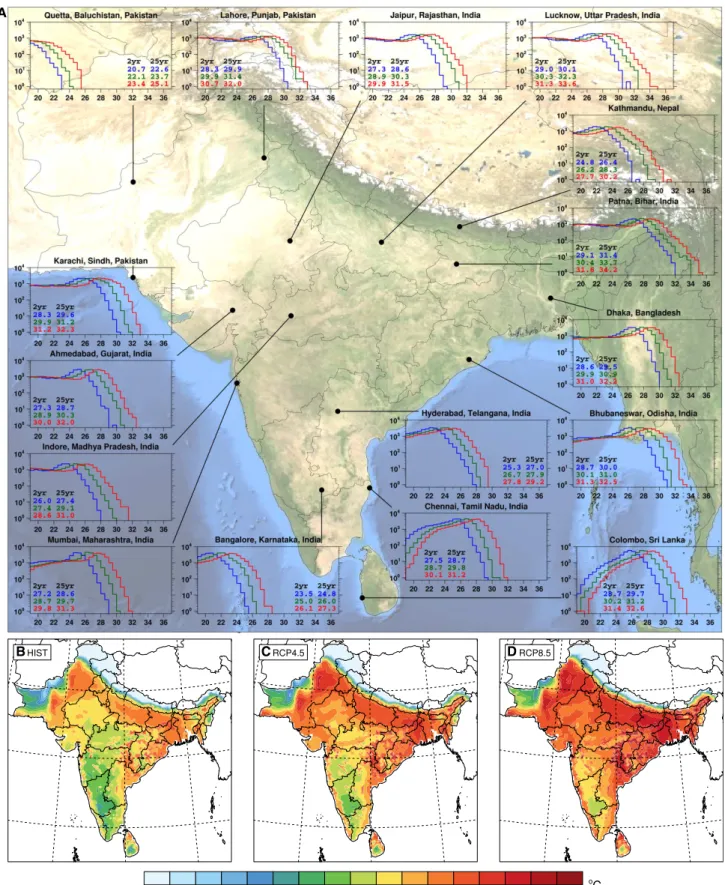
Fig. 2. Histograms of daily maximum wet-bulb temperature,TWmax(°C), and maps of the ensemble averaged 30-yearTWmax. (A) The histograms are generated
for the most populous cities in the selected regions for each scenario: HIST (blue), RCP4.5 (green), and RCP8.5 (red). Values within each panel correspond to the 2- and 25-year return period of the bias-corrected annual maxima of TWmax, and the x and y axes indicate TWmax(°C) and the number of occurrences on a logarithmic scale,
respectively. The background image was obtained from NASA Visible Earth. (B to D) The spatial distributions of bias-corrected ensemble averaged 30-year TWmaxfor each
GHG scenario: HIST (1976–2005) (B), RCP4.5 (2071–2100) (C), and RCP8.5 (2071–2100) (D).
on February 9, 2018
http://advances.sciencemag.org/
On the basis of the simulation results,TWmaxis projected to exceed
the survivability threshold at a few locations in the Chota Nagpur Plateau, northeastern India, and Bangladesh and projected to approach the 35°C threshold under the RCP8.5 scenario by the end of the cen-tury over most of South Asia, including the Ganges river valley, north-eastern India, Bangladesh, the north-eastern coast of India, Chota Nagpur Plateau, northern Sri Lanka, and the Indus valley of Pakistan (Fig. 2). Under the RCP4.5 scenario, no regions are projected to exceed 35°C; however, vast regions of South Asia are projected to experience episodes exceeding 31°C, which is considered extremely dangerous for most humans (see the Supplementary Materials). Less severe conditions, in general, are projected for the Deccan Plateau in India, the Himalayas, and western mountain ranges in Pakistan.
Many urban population centers in South Asia are projected to ex-perience heat waves characterized byTWmaxwell beyond 31°C under
RCP8.5 (Fig. 2). For example, in Lucknow (Uttar Pradesh) and Patna (Bihar), which have respective current metro populations of 2.9 and 2.2 million,TW reaches and exceeds the survivability threshold. In most locations, the 25-year annualTWmaxevent in the present climate,
for instance, is projected to become approximately an every year oc-currence under RCP8.5 and a 2-year event under RCP4.5 (Fig. 2 and fig. S1). In addition to the increase inTWmaxunder global warming,
the urban heat island effect may increase the risk level of extreme heat, measured in terms of temperature, for high-density urban population exposure to poor living conditions. However, Shastriet al. (28) found that urban heat island intensity over many Indian urban centers is low-er than in non-urban regions along the urban boundary during daytime in the pre-monsoon summer because of the relatively low veg-etation cover in non-urban areas.
VULNERABILITY
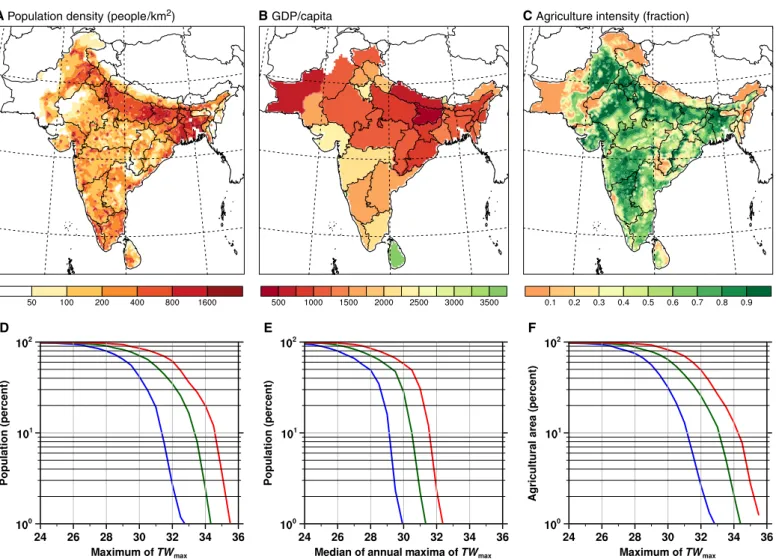
The geographical locations of the most extreme projected heat waves in the Indus and Ganges river valleys coincide largely with locations of highly vulnerable human populations in terms of population density, gross domestic product (GDP) per capita, and agricultural intensity (Fig. 3). Agricultural workers in these regions spend significant time working outdoors during the seasons with the highestTW (boreal spring, summer, and autumn; fig. S2). Under RCP8.5, a small fraction of the South Asian population (~4%) is projected to experienceTWmax
exceeding 35°C by 2100. However, approximately 75% of the popula-tion is projected to experienceTWmaxexceeding 31°C, considered
dangerous levels for most humans (6), compared to 15% in the current climate and 55% under RCP4.5 (Fig. 3). Similarly, the fractional pop-ulation exposed to the median daily maximumTWmaxof 31°C is
projected to increase from essentially zero in the present day to ~30% under RCP8.5 and only 2% under RCP4.5. In terms of fractional agricultural area affected, the numbers are similar to those of fraction-al population because most of the populations in these regions live in rural areas. The difference between the projections for RCP8.5 and RCP4.5 suggests that the region stands to benefit from significant mit-igation efforts, such as those pledged by COP21.
To examine the robustness of our estimates of the characteristics of heat stress, we also investigate the frequency and intensity of severe heat waves based on the criteria used by the India Meteorological De-partment, which do not consider the effects of humidity (figs. S3 and S4). Heat waves characterized by solely maximum temperatures are projected to significantly increase in both frequency and intensity, with maximum severity in northwest India and the desert region of
Pakistan. Combining our analysis based onTWmaxand severe heat
wave defined byTmax, we find that a sizable part of the Indian
sub-continent is likely to experience more frequent and intensified heat waves and associated physical stress during the extended period covering the pre-monsoon to monsoon seasons.
POTENTIAL MECHANISMS
The fertile valleys of the Indus and the Ganges, where human popu-lation is currently in the hundreds of millions, will likely experience some of the most severe projected hazard from heat waves. Three independent mechanisms are offered to explain this projection. First, the monsoon system transports warm and humid air masses into the Indus and Ganges valleys from the surrounding warm Arabian Sea and Bay of Bengal. Second, surface elevations in these valleys are erally lower than 100 m above sea level, and hence, surface air is gen-erally warmer than surrounding higher-elevation areas. Third, much of the valleys are irrigated, which tends to enhanceTW over irrigated areas because of modifications in the surface energy balance (29). These three factors add together to favor higherTW conditions in the valleys compared to the surrounding regions. Furthermore, large-scale modes of climate variability indirectly affect the character-istics of heat waves through teleconnections. The possible linkage be-tween the El Niño–Southern Oscillation and heat wave variability has been previously investigated (30). El Niño delays the onset of the Indian Summer Monsoon, which, in turn, induces more severe and longer-lasting heat waves in India. Furthermore, most years with abnormal heat waves in terms of intensity and spatial extent correspond to a year following an El Niño event (31, 32). We note that the regions identified with severe heat waves associated with El Niño coincide with the loca-tions of higherTW in our analysis.
RAMIFICATIONS
Studies of detection and attribution of recent climate change have found compelling evidence of human influence on regional heat waves (33), surface specific humidity (34), and temperature- and moisture-related heat stress (35). These detection/attribution results lend further credibility to the projected late 21st century increases in the frequency and magnitude of heat extremes and related heat stress due to anthropogenic GHGs, which will likely impose significant risk and negative impact on human health (11). In this regard, our find-ings have significant implications to the ongoing considerations re-garding climate change policy. In the absence of serious mitigation, some of the most severe hazards associated with climate change will fall on some of the most vulnerable populations. In poorer regions, such as South Asia, air conditioning is not currently available as a safe haven to most of the population, increasing the risk of illness and death related to extreme heat conditions. This disparity raises impor-tant environmental justice questions beyond the scope of this study. At the regional scale, India’s GHG emissions have been increasing rap-idly in recent decades because of rapid economic and population growth and high dependence on coal used for energy generation. De-spite their relatively low GHG per capita emissions, India (and more so China) is responsible for much of the recent rise in global emissions. The findings from this study may present a significant dilemma for India because the continuation of this current trajectory of rising emis-sions will likely impose significant added human health risks to some of its most vulnerable populations.
on February 9, 2018
http://advances.sciencemag.org/
MATERIALS AND METHODS Experimental design
To investigate the future changes inTW in response to anthropogenic GHG forcing over South Asia, we produced high-resolution regional projections using the MRCM (24). MRCM is based on the Abdus Salam International Centre for Theoretical Physics Regional Climate Model Version 3 (RegCM3) (36) but with several important improvements (26). In particular, the irrigation module implemented within the Integrated Biosphere Simulator (IBIS) land surface scheme takes into account the impact of large-scale irrigation practiced in the agricultural sector in South Asia (fig. S5). In previous studies, we have demonstrated that the irrigation module of MRCM is suited for climate simulations representing how irrigation enhances evapotranspiration and affects the surface energy balance (29, 37).
The simulation domain covers the entire Indian subcontinent and adjacent Indian Ocean, including the five targeted countries of this study: India, Pakistan, Bangladesh, Nepal, and Sri Lanka. It is centered at 79°E and 20.5°N with a 25-km grid spacing on a Lambert conformal
projection. The 25-km grid spacing is fine enough to represent the gen-eral geographical setting. In particular, it reasonably captures the complex topography characterized by the sharp gradient of the Himalaya between the Indo-Gangetic Plain and the Tibetan Plateau (fig. S5), which is a key factor in accurately simulating the South Asian monsoon and henceTW. The surface and lateral boundary conditions used to force MRCM were taken from three AOGCMs participating in CMIP5 (25): Com-munity Climate System Model version 4 (CCSM4) (38), Max-Planck-Institute Earth System Model (MPI-ESM) (39), and Australian Community Climate and Earth System Simulator (ACCESS) (table S1) (40). The AOGCM horizontal resolution ranges from approximately 100 to 200 km for the atmosphere and 30 to 100 km for the ocean. The AOGCMs were selected based on a rigorous evaluation of per-formance in simulatingT and TW over South Asia. More specifically, the bias and root mean square error of the seasonal mean climatology and the probability density function of daily time scale data were com-pared with the European Centre for Medium-Range Weather Forecasts Interim reanalysis (ERA-Interim) data (5).
A B C
D E F
Fig. 3. Vulnerability due to population density, poverty, and outdoor working conditions. (A to C) Maps of population density in people/km2(A), GDP in U.S. dollars
per capita (B), and agricultural land fraction (C). (D to F) Population fraction exposed at least once in the simulations to TWmax(D) and exposed to median of annual
maxima of TWmax(E), and agricultural land fraction (crop and pasture) exposed at least once in the simulations to TWmax(F). Blue, green, and red lines represent the
HIST (1976–2005), RCP4.5 (2071–2100), and RCP8.5 (2071–2100) scenarios, respectively. Data for 2000 population density (43), 2014 GDP (Indian Ministry of Statistics and Programme Implementation), and 2000 agricultural intensity (44) are regridded onto the MRCM grid.
on February 9, 2018
http://advances.sciencemag.org/
For each selected AOGCM, the present-day climate is represented with historical GHG concentrations for the period 1975–2005 (HIST), whereas future climate is projected under the RCP trajectories (27) for the period 2070–2100. To quantify the effect of a range of GHG concen-trations, two different RCP scenarios, namely, RCP4.5 and RCP8.5, were adopted. RCP8.5 is a rising concentration pathway leading to 8.5 W m−2 of radiative forcing by 2100 and can be considered a BAU scenario. RCP4.5 is a stabilization scenario after about 2060, leading to 4.5 W m−2 of radiative forcing by 2100. It represents moderate mitigation effort. In summary, South Asian regional climate was simulated using MRCM forced by three AOGCMs under three GHG concentration scenarios for a total of nine 31-year simulations. The first year of each simulation was excluded as a spin-up period, and the analysis was performed based on the remaining 30 years of simulation.
ExtremeTW and T computations with bias correction For impact studies, it is often desirable to bias correct climate model simulation results by assuming that the bias in the historical simulation remains constant in the future projections (41). Doing so reduces the likelihood that impact assessments are biased by model deficiencies. Here, we applied the same methodology for bias correc-tion of simulatedTW developed by Pal and Eltahir (6) for the climate change projections in southwest Asia.TW is computed by the formu-lation developed by Davies-Jones (42) using instantaneous values sur-face temperature, humidity, and pressure. BecauseTW does not consider the variation of solar radiation assuming moderately high ra-diation, it neglects the effects of direct sunlight on heat stress. It can result in a slight overestimation of heat stress in cloudy days or during nighttime but underestimation during periods of full sun (14). The ERA-Interim reanalysis data are considered the best available combined spatial and temporal representation of observations for the region and are therefore used for the following bias correction procedure: (i) The maximum 6-hour averageTW and T for each day are computed for both the MRCM hourly output and the ERA-Interim reanalysis 3-hourly 0.75° × 0.75° data, denoted byTWmaxandTmax, respectively. (ii) The
ERA-InterimTWmaxandTmaxdata are interpolated from the 0.75° ×
0.75° horizontal grid to the 25-km MRCM grid. (iii) Consistent MRCM and ERA-Interim climatologies ofTWmaxandTmaxare computed for
each day of the year on the MRCM 25-km grid. (iv) The magnitude of the bias for each day of the year is estimated by the difference between 30-day running means of the two climatologies. (v) The daily bias is then applied to the MRCM daily values ofTWmaxandTmaxfor the
present-day and future climates. The corrections forTmaxare on the
order of 1° to 2°C, which is in line with the meanTW bias (fig. S6). The adjusted values were, in turn, used to compute annualTWmax
andTmaxmaxima andTWmaxandTmaxhistograms at each grid point. To
describe the statistical likelihood of extremeTWmaxandTmaxoccurrence,
we also computed the return period using an empirical Weibull ranking. By comparing the levels ofTWmaxandTmaxcorresponding to the same
return period, we were able to project the future changes in the intensity and frequency ofTWmaxandTmaxwith respect to the present climate.
The comparison between the RCP4.5 and RCP8.5 scenarios is meaning-ful for addressing the potential impact of mitigating GHG emissions.
SUPPLEMENTARY MATERIALS
Supplementary material for this article is available at http://advances.sciencemag.org/cgi/ content/full/3/8/e1603322/DC1
Supplementary Text
fig. S1. Bias-corrected annual TWmaxreturn period for the most populous cities in the selected
regions for each scenario.
fig. S2. Seasonal cycle of the 30-year average monthly maximum TWmaxafter bias correction
for the most populous cities in the selected regions for each scenario.
fig. S3. April-May-July climatological frequency (days/year) of severe heat wave calculated using daily maximum temperature derived from MRCM historical simulation (1976–2005) and
RCP4.5 and RCP8.5 projections (2071–2100).
fig. S4. As in fig. S3 but for intensity (°C) of severe heat wave.
fig. S5. Geographical settings and typical climatological conditions of the South Asian monsoon.
fig. S6. Spatial distribution of June-July-August 30-year (1982–2011) climatology of TW and
TWmax(°C) for ERA-Interim and the MRCM simulations driven by ERA-Interim.
fig. S7. Spatial distribution of June-July-August 30-year climatology of TW and TWmax(°C) for
ERA-Interim (1979–2008) and the MRCM ensemble of the three simulations (1976–2005)
driven by three AOGCMs (CCSM4, MPI-ESM, and ACCESS).
fig. S8. Spatial distribution of 95th percentile exceedance of TWmax(days/year) from
ERA-Interim (1979–2008) and the MRCM ensemble of simulations (1975–2005) driven by three AOGCMs (CCSM4, MPI-ESM, and ACCESS).
fig. S9. Histogram of TWmax(°C) at three stations (Punjab, Patna, and Lucknow) from in situ
observations (1979–2008) and the MRCM simulations (1976–2005) driven by three AOGCMs (CCSM4, MPI-ESM, and ACCESS).
fig. S10. Histograms of daily maximum temperature, Tmax(°C), and maps of the ensemble
averaged 30-year Tmax.
fig. S11. Bias-corrected annual Tmaxreturn period for the most populous cities in the selected
regions for each scenario.
fig. S12. Conversion tables between NOAA National Weather Service Heat Index and TW. table S1. Horizontal resolution of the atmospheric and ocean components of the three AOGCMs used in this study.
References (45–47)
REFERENCES AND NOTES
1. S. C. Sherwood, M. Huber, An adaptability limit to climate change due to heat stress.
Proc. Natl. Acad. Sci. U.S.A. 107, 9552–9555 (2010).
2. C. P. Yaglou, D. Minard, Control of heat casualties at military training centers. AMA Arch.
Ind. Health 16, 302–316 (1957).
3. Y. Epstein, D. S. Moran, Thermal comfort and the heat stress indices. Ind. Health 44, 388–398 (2006).
4. K. R. Smith, A. Woodward, D. Campbell-Lendrum, D. D. Chadee, Y. Honda, Q. Liu, J. Olwoch, B. Revich, R. Sauerborn, Human health: Impacts, adaptation, and co-benefits, in Climate Change 2014: Impacts, Adaptation, and Vulnerability. Part A: Global and Sectoral Aspects. Contribution of Working Group II to the Fifth Assessment Report of the Intergovernmental Panel on Climate Change, C. B. Field, V. R. Barros, D. J. Dokken, K. J. Mach, M. D. Mastrandrea, T. E. Bilir, M. Chatterjee, K. L. Ebi, Y. O. Estrada, R. C. Genova, B. Girma, E. S. Kissel, A. N. Levy, S. MacCracken, P. R. Mastrandrea, L. L. White, Eds. (Cambridge Univ. Press, 2014), pp. 709–754.
5. D. P. Dee, S. M. Uppala, A. J. Simmons, P. Berrisford, P. Poli, S. Kobayashi, U. Andrae, M. A. Balmaseda, G. Balsamo, P. Bauer, P. Bechtold, A. C. M. Beljaars, L. van de Berg, J. Bidlot, N. Bormann, C. Delsol, R. Dragani, M. Fuentes, A. J. Geer, L. Haimberger, S. B. Healy, H. Hersbach, E. V. Hólm, L. Isaksen, P. Kållberg, M. Köhler, M. Matricardi, A. P. McNally, B. M. Monge-Sanz, J.-J. Morcrette, B.-K. Park, C. Peubey, P. de Rosnay, C. Tavolato, J.-N. Thépaut, F. Vitart, The ERA-Interim reanalysis: Configuration and performance of the data assimilation system. Q. J. Roy. Meteorol. Soc. 137, 553–597 (2011).
6. J. S. Pal, E. A. B. Eltahir, Future temperature in southwest Asia projected to exceed a
threshold for human adaptability. Nat. Clim. Change 6, 197–200 (2016).
7. C. Schär, Climate extremes: The worst heat waves to come. Nat. Clim. Change 6, 128–129 (2016).
8. G. A. Meehl, C. Tebaldi, More intense, more frequent, and longer lasting heat waves in the 21st century. Science 305, 994–997 (2004).
9. G. B. Anderson, M. L. Bell, Heat waves in the United States: Mortality risk during heat waves and effect modification by heat wave characteristics in 43 U.S. communities.
Environ. Health Perspect. 119, 210–218 (2011).
10. IPCC, Climate Change 2007: The Physical Science Basis. Contribution of Working Group I to Fourth Assessment Report of the Intergovernmental Panel on Climate Change, S. Solomon, D. Qin, M. Manning, Z. Chen, M. Marquis, K. B. Averyt, M. Tignor, H. L. Miller, Eds. (Cambridge Univ. Press, 2007).
11. K. R. Smith, A. Woodward, D. Campbell-Lendrum, D. D. Chadee, Y. Honda, Q. Liu, J. M. Olwoch, B. Revich, R. Sauerborn, Human health: Impacts, adaptation, and co-benefits, in Climate Change 2014: Impacts, Adaptation, and Vulnerability. Part A: Global and Sectoral Aspects. Contribution of Working Group II to the Fifth Assessment Report of
on February 9, 2018
http://advances.sciencemag.org/
the Intergovernmental Panel of Climate Change, C. B. Field, V. R. Barros, D. J. Dokken, K. J. Mach, M. D. Mastrandrea, T. E. Bilir, M. Chatterjee, K. L. Ebi, Y. O. Estrada, R. C. Genova, B. Girma, E. R. Kissel, A. N. Levy, S. MacCracken, P. R. Mastrandrea, L. L. White, Eds. (Cambridge Univ. Press, 2014), pp. 709–754.
12. T. Kjellstorm, J. Crowe, Climate change, workplace heat exposure, and occupational health and productivity in Central America. Int. J. Occup. Environ. Health 17, 270–281 (2011). 13. J. P. Dunne, R. J. Stouffer, J. G. John, Reductions in labour capacity from heat stress under
climate warming. Nat. Clim. Change 3, 563–566 (2013).
14. K. M. Willett, S. C. Sherwood, Exceedance of heat index thresholds for 15 regions under a warming climate using the wet-bulb globe temperature. Int. J. Climatol. 32, 161–177 (2012).
15. E. M. Fischer, C. Schär, Consistent geographical patterns of changes in high-impact European heatwaves. Nat. Geosci. 3, 398–403 (2010).
16. C. Steinweg, W. J. Gutowski Jr., Projected changes in greater St. Louis summer heat stress in NARCCAP simulations. Weather Clim. Soc. 7, 159–168 (2015).
17. S. K. Dash, A. Mamgain, Changes in the frequency of different categories of temperature extremes in India. J. Appl. Meteorol. Climatol. 50, 1842–1858 (2011).
18. S. K. Dash, T. Kjellstrom, Workplace heat stress in the context of rising temperature in India. Curr. Sci. 101, 496–503 (2011).
19. S. K. Dash, R. K. Jenamani, S. R. Kalsi, S. K. Panda, Some evidence of climate change in
twentieth-century India. Clim. Change 85, 299–321 (2007).
20. G. S. Azhar, D. Mavalankar, A. Nori-Sarma, A. Rajiva, P. Dutta, A. Jaiswal, P. Sheffield, K. Knowlton, J. J. Hess; Ahmedabad HeatClimate Study Group, Heat-related mortality in India: Excess all-cause mortality associated with the 2010 Ahmedabad heat wave. PLOS ONE 9, e91831 (2014).
21. The International Disaster Database, Centre for Research on the Epidemiology of Disasters. 22. Disasters in Asia and the Pacific: 2015 Year in Review (United Nations Economic and Social
Commission for Asia and the Pacific, 2016); www.unescap.org/sites/default/files/ 2015_Year%20in%20Review_final_PDF_1.pdf.
23. Annual Climate Summary-2015 (National Climate Change, India Meteorological Department, 2015); www.imdpune.gov.in/Links/annual%20summary%202015.pdf. 24. E.-S. Im, R. L. Gianotti, E. A. B. Eltahir, Improving the simulation of the West African
Monsoon using the MIT regional climate model. J. Climate 27, 2209–2229 (2014). 25. K. E. Taylor, R. J. Stouffer, G. A. Meehl, An overview of CMIP5 and the experiment design.
Bull. Am. Meteorol. Soc. 93, 485–498 (2012).
26. N. L. Bindoff, P. A. Stott, M. AchutaRao, M. R. Allen, N. Gillett, D. Gutzler, K. Hansingo, G. Hegerl, Y. Hu, S. Jain, Detection and attribution of climate change: From global to regional, in Climate Change 2013: The Physical Science Basis. Contribution of Working Group I to the Fifth Assessment Report of the Intergovernmental Panel on Climate Change, B. D. Stocker. D. Qin, G.-K. Plattner, M. M. B. Tignor, S. K. Allen, J. Boschung, A. Nauels,
Y. Xia, V. Bex, P. M. Midgley, Eds. (Cambridge Univ. Press, 2013), pp. 867–952.
27. D. P. van Vuuren, J. Edmonds, M. Kainuma, K. Riahi, A. Thomson, K. Hibbard, G. C. Hurtt, T. Kram, V. Krey, J.-F. Lamarque, T. Masui, M. Meinshausen, N. Nakicenovic, S. J. Smith, S. K. Rose, The representative concentration pathways: An overview. Clim. Change 109,
5–31 (2011).
28. H. Shastri, B. Barik, S. Ghosh, C. Venkataraman, P. Sadavarte, Flip flop of day-night and summer-winter surface urban heat island intensity in India. Sci. Rep. 7, 40178 (2017). 29. E.-S. Im, M. P. Marcella, E. A. B. Eltahir, Impact of potential large-scale irrigation on the
West African Monsoon and its dependence on location of irrigated area. J. Climate 27,
994–1009 (2014).
30. K. K. Murari, A. S. Sahana, E. Daly, S. Ghosh, The influence of the El Niño Southern
Oscillation on heat waves in India. Meteorol. Appl. 23, 705–713 (2016).
31. P. Rohini, M. Rajeevan, A. K. Srivastava, On the variability and increasing trends of heat waves over India. Sci. Rep. 6, 26153 (2016).
32. D. S. Pai, S. A. Nair, A. N. Ramanathan, Long term climatology and trends of heat waves
over India during the recent 50 years (1961–2010). Mausam 64, 585–604 (2013).
33. S. C. Lewis, D. J. Karoly, Anthropogenic contributions to Australia’s record summer temperature of 2013. Geophys. Res. Lett. 40, 3705–3709 (2013).
34. K. M. Willett, N. P. Gillett, P. D. Jones, P. W. Thorne, Attribution of observed surface humidity changes to human influence. Nature 449, 710–712 (2007).
35. T. R. Knutson, J. J. Ploshay, Detection of anthropogenic influence on a summertime heat stress index. Clim. Change 138, 25–39 (2016).
36. J. S. Pal, F. Giorgi, X. Bi, N. Elguindi, F. Solmon, X. Gao, S. A. Rauscher, R. Francisco, A. Zakey, J. Winter, M. Ashfaq, F. S. Syed, J. L. Bell, N. S. Diffenbaugh, J. Karmacharya, A. Konaré, D. Martinez, R. P. Da Rocha, L. C. Sloan, A. L. Steiner, Regional climate modeling for the developing world: The ICTP RegCM3 and RegCNET. Bull. Am. Meteorol. Soc. 88, 1395–1409 (2007).
37. M. P. Marcella, E. A. B. Eltahir, Introducing an irrigation scheme to a regional climate
model: A case study over West Africa. J. Climate 27, 5708–5723 (2014).
38. G. A. Meehl, W. M. Washington, J. M. Arblaster, A. Hu, H. Teng, C. Tebaldi, B. N. Sanderson, J.-F. Lamarque, A. Conley, W. G. Strand, J. B. White III, Climate system response to external forcings and climate change projections in CCSM4. J. Climate 25, 3661–3683 (2012). 39. M. A. Giorgetta, J. Jungclaus, C. H. Reick, S. Legutke, J. Bader, M. Böttinger, V. Brovkin,
T. Crueger, M. Esch, K. Fieg, K. Glushak, V. Gayler, H. Haak, H.-D. Hollweg, T. Ilyina, S. Kinne, L. Kornblueh, D. Matei, T. Mauritsen, U. Mikolajewicz, W. Mueller, D. Notz, F. Pithan, T. Raddatz, S. Rast, R. Redler, E. Roeckner, H. Schmidt, R. Schnur, J. Segschneider, K. D. Six, M. Stockhause, C. Timmreck, J. Wegner, H. Widmann, K.-H. Wieners, M. Claussen, J. Marotzke, B. Stevens, Climate and carbon cycle changes from 1850 to 2100 in MPI-ESM simulations for the Coupled Model Intercomparison Project phase 5. J. Adv. Model. Earth
Syst. 5, 572–597 (2013).
40. D. Bi, M. Dix, S. J. Marsland, S. O’Farrell, H. A. Rashid, P. Uotila, A. C. Hirst, E. Kowalczyk, M. Golebiewski, A. Sullivan, H. Yan, N. Hannah, C. Franklin, Z. Sun, P. Vohralik, I. Watterson, X. Zhou, R. Fiedler, M. Collier, Y. Ma, J. Noonan, L. Stevens, P. Uhe, H. Zhu, S. M. Griffies, R. Hill, C. Harris, K. Puri, The ACCESS coupled model: Description, control climate and
evaluation. Austr. Meteorol. Oceanogr. J. 63, 41–64 (2013).
41. M. Ashfaq, L. C. Bowling, K. Cherkauer, J. S. Pal, N. S. Diffenbaugh, Influence of climate model biases and daily-scale temperature and precipitation events on hydrological impacts assessment: A case study of the United States. J. Geophys. Res. 115, D14116 (2010). 42. R. Davies-Jones, An efficient and accurate method for computing the wet-bulb
temperature along pseudoadiabats. Mon. Weather Rev. 136, 2764–2785 (2008). 43. D. L. Balk, U. Deichmann, G. Yetman, F. Pozzi, S. I. Hay, A. Nelson, Determining global
population distribution: Methods, applications and data. Adv. Parasitol. 62, 119–156 (2006).
44. N. Ramankutty, A. T. Evan, C. Monfreda, J. A. Foley, Farming the planet: 1. Geographic distribution of global agricultural lands in the year 2000. Global Biogeochem. Cycles 22, GB1003 (2008).
45. M. A. S. Chandran, A. V. M. S. Rao, V. M. Sandeep, V. P. Pramod, P. Pani, V. U. M. Rao, V. V. Kumari, C. S. Rao, Indian summer heat wave of 2015: A biometeorological analysis using half hourly automatic weather station data with special reference to Andhra Pradesh. Int. J. Biometeorol. 61, 1063–1072 (2017).
46. R. W. Reynolds, N. A. Rayner, T. M. Smith, D. C. Stokes, W. Wang, An improved in situ and
satellite SST analysis for climate. J. Climate 15, 1609–1625 (2002).
47. P. V. S. Raju, R. Bhatla, M. Almazroui, M. Assiri, Performance of convection schemes on the simulation of summer monsoon features over the South Asia CORDEX domain using RegCM-4.3. Int. J. Climatol. 35, 4695–4706 (2015).
Acknowledgments: We thank the editor and three anonymous reviewers for their constructive comments leading to improvements of the manuscript. We are grateful to S. Kang for his assistance with data handling and visualization. Funding: This research was supported by the National Research Foundation Singapore through the Singapore-MIT Alliance for Research and Technology’s Center for Environmental Sensing and Modeling interdisciplinary research program. Author contributions: E.A.B.E. conceived the study. E.-S.I. and J.S.P. performed the simulations and analyzed the output. All authors discussed the results and wrote the manuscript. Competing interests: The authors declare that they have no competing interests. Data and materials availability: All data needed to evaluate the conclusions in the paper are present in the paper and/or the Supplementary Materials. Additional data related to this paper may be requested from the authors.
Submitted 30 December 2016 Accepted 6 July 2017 Published 2 August 2017 10.1126/sciadv.1603322
Citation:E.-S. Im, J. S. Pal, E. A. B. Eltahir, Deadly heat waves projected in the densely populated agricultural regions of South Asia. Sci. Adv. 3, e1603322 (2017).
on February 9, 2018
http://advances.sciencemag.org/
Eun-Soon Im, Jeremy S. Pal and Elfatih A. B. Eltahir
DOI: 10.1126/sciadv.1603322 (8), e1603322.
3
Sci Adv
ARTICLE TOOLS http://advances.sciencemag.org/content/3/8/e1603322
MATERIALS
SUPPLEMENTARY http://advances.sciencemag.org/content/suppl/2017/07/28/3.8.e1603322.DC1
REFERENCES
http://advances.sciencemag.org/content/3/8/e1603322#BIBL
This article cites 40 articles, 2 of which you can access for free
PERMISSIONS http://www.sciencemag.org/help/reprints-and-permissions
Terms of Service
Use of this article is subject to the
registered trademark of AAAS.
is a
Science Advances
Association for the Advancement of Science. No claim to original U.S. Government Works. The title
York Avenue NW, Washington, DC 20005. 2017 © The Authors, some rights reserved; exclusive licensee American (ISSN 2375-2548) is published by the American Association for the Advancement of Science, 1200 New
Science Advances
on February 9, 2018
http://advances.sciencemag.org/