HAL Id: inserm-02907177
https://www.hal.inserm.fr/inserm-02907177
Submitted on 27 Jul 2020
HAL is a multi-disciplinary open access
archive for the deposit and dissemination of
sci-entific research documents, whether they are
pub-lished or not. The documents may come from
teaching and research institutions in France or
abroad, or from public or private research centers.
L’archive ouverte pluridisciplinaire HAL, est
destinée au dépôt et à la diffusion de documents
scientifiques de niveau recherche, publiés ou non,
émanant des établissements d’enseignement et de
recherche français ou étrangers, des laboratoires
publics ou privés.
Distributed under a Creative Commons Attribution| 4.0 International License
stemness and immune microenvironment to drive
metastasis in mice
Eva Hadadi, William Taylor, Xiao-Mei Li, Yetki Aslan, Marthe Villote, Julie
Rivière, Gaelle Duvallet, Charlotte Auriau, Sandrine Dulong, Isabelle
Raymond-Letron, et al.
To cite this version:
Eva Hadadi, William Taylor, Xiao-Mei Li, Yetki Aslan, Marthe Villote, et al.. Chronic circadian
disruption modulates breast cancer stemness and immune microenvironment to drive metastasis in
mice. Nature Communications, Nature Publishing Group, 2020, 11 (1), pp.3193.
�10.1038/s41467-020-16890-6�. �inserm-02907177�
Chronic circadian disruption modulates breast
cancer stemness and immune microenvironment
to drive metastasis in mice
Eva Hadadi
1
✉
, William Taylor
1
, Xiao-Mei Li
1,2
, Yetki Aslan
3
, Marthe Villote
4
, Julie Rivière
4
, Gaelle Duvallet
5
,
Charlotte Auriau
5
, Sandrine Dulong
1,2
, Isabelle Raymond-Letron
6,7
, Sylvain Provot
3
,
Annelise Bennaceur-Griscelli
1,2,8
& Hervé Acloque
1,4
✉
Breast cancer is the most common type of cancer worldwide and one of the major causes of
cancer death in women. Epidemiological studies have established a link between night-shift
work and increased cancer risk, suggesting that circadian disruption may play a role in
carcinogenesis. Here, we aim to shed light on the effect of chronic jetlag (JL) on mammary
tumour development. To do this, we use a mouse model of spontaneous mammary
tumourigenesis and subject it to chronic circadian disruption. We observe that circadian
disruption signi
ficantly increases cancer-cell dissemination and lung metastasis. It also
enhances the stemness and tumour-initiating potential of tumour cells and creates an
immunosuppressive shift in the tumour microenvironment. Finally, our results suggest that
the use of a CXCR2 inhibitor could correct the effect of JL on cancer-cell dissemination and
metastasis. Altogether, our data provide a conceptual framework to better understand and
manage the effects of chronic circadian disruption on breast cancer progression.
https://doi.org/10.1038/s41467-020-16890-6
OPEN
1Inserm, U935, Université Paris Sud, Villejuif, France.2Université Paris Sud, Université Paris Saclay, UFR de Médecine Kremlin Bicêtre, Le
Kremlin-Bicêtre, France.3Inserm, U1132, Université Paris Diderot, Hôpital Lariboisière - Centre Viggo Petersen, 75010 Paris, France.4GABI, INRA, AgroParisTech, Université Paris-Saclay, 78352 Jouy-en-Josas, France.5Inserm, UMS33 Villejuif, France.6Département des Sciences Biologiques et Fonctionnelles,
Laboratoire d’HistoPathologie Expérimentale et Comparée (LabHPEC), ENVT, Université de Toulouse, Toulouse, France.7STROMALab, CNRS ERL5311, EFS,
ENVT, Inserm U1031, Université de Toulouse, Toulouse, France.8Service d’hématologie, APHP, GHU Paris Sud, Paris, France. ✉email:eva.hadadi@inserm.fr;
herve.acloque@inra.fr
123456789
G
lobally, breast cancer (BC) is the most frequent cancer in
women. The cumulative risk that a woman will develop
BC is around 5% worldwide, with a 1.4% risk of death.
In 2018, there were more than 2 million newly diagnosed cases,
representing almost 25% of all cancer cases in women. BC is the
leading cause of death for women in most countries
1. Genetic
causes account for <10% of BC; instead, the majority of BC
development has been linked with non-hereditary causes. These
include nutrition-related factors, alcohol consumption,
exo-genous hormone intake, reproductive history, and
menstrua-tion parameters
1. Environmental factors such as air pollution or
altered light/dark cycles, such as those experienced by
night-shift workers, can also affect BC incidence
2–4. Indeed, in 2007
the International Agency for Research on Cancer (IARC)
classified circadian rhythm disruption (CRD) as probably
car-cinogenic based on eight epidemiological studies and data from
animal models
4. Since then, additional and better-documented
epidemiological studies, genome-wide association studies
(GWAS), and cellular and animal studies have substantiated the
link between BC development and circadian disruption
5. A
recent population-based case-control study confirmed that
factors including night-work duration, length of shifts, and time
since last night shift affect the odd ratios for BC, mostly in
premenopausal women
6. In this, hormonal receptor status also
plays an important role: BC risk associated with night work is
only higher for ER+HER2+ cancer. These epidemiological
studies are supported by GWAS analyses that have revealed a
significant statistical association between genetic variation
located in circadian genes (ARNTL, CLOCK, CRY1, CRY2,
RORA, RORB, RORC, PER1) and the risk of breast cancer, as
well as between circadian clock-gene expression and
metastasis-free survival
7,8. Experimental studies on mammary epithelial
cells have also provided evidence of an important role for core
circadian clock genes in mammary gland formation and
func-tion. Specifically, female Per2
−/−mutant mice fail to form
normal terminal mammary ducts, and instead have an excess of
basal progenitors
9. Female Arntl
−/−mutants have fewer ductal
branches, shorter ductal length and more terminal end buds,
while female Clock
−/−mutants present defects in daytime
maternal behaviour and milk production
10,11. Studies of core
circadian genes in human mammary epithelial cells have
con-firmed these in vivo observations and have identified a strong
effect of these genes on the stemness of mammary epithelial
cells, either by decreasing or increasing stemness
9,12,13.
How-ever, it is not always clear whether the observed phenotypes
result from the non-circadian function of these transcription
factors or are instead an indirect consequence of global
dysre-gulation of the circadian clock in cells and tissues.
Experimental results on the effects of CRD on breast cancer
onset have already been obtained using an inducible p53 mutant
mouse model that was predisposed to developing primary
mammary tumours. These mice typically developed mammary
tumours in 50 weeks, but onset was 8 weeks earlier when the mice
experienced CRD. This study supported the key role that CRD
can have in driving breast cancer development
14.
Here, we wanted to progress beyond the onset of
tumour-igenesis and explore the effects of CRD on tumour progression,
cancer-cell dissemination, and immune phenotype. To do this, we
use the MMTV:PyMT model of spontaneous murine mammary
carcinogenesis
15and test the effects of chronic CRD applied for
10 weeks at the beginning of puberty-initiated tumourigenesis.
We observe that circadian disruption significantly increases
cancer-cell dissemination and metastasis by acting on the
stem-ness and tumour-initiating potential of tumour cells and
by creating an immunosuppressive shift in the tumour
microenvironment.
Results
Chronic CRD moderately affects primary tumour
develop-ment. The original MMTV:PyMT mouse model with FVB
background (FVB PyMT) is known to experience rapid and
strong metastasis
15; instead, the PyMT mouse model with the
C57Bl/6J (B6) background experiences delayed tumourigenesis,
with a more gradual but variable tumour growth rate and reduced
lung metastasis compared with FVB PyMT mice
16. As the
aggressive FVB PyMT model was incompatible with our goal of
modelling long-term chronic CRD, and because we were also
interested in investigating the earlier/linear phase of tumour
growth, we decided to use a mixed B6*FVB PyMT background.
In line with previous observations, we observed a delayed onset of
tumour development and slower cancer progression in these mice
compared with typical FVB mice, with a low prevalence (ca. 30%)
of lung metastasis at the age of 16 weeks. To maximise the
pos-sibility of observing differences between our experimental groups,
mice were analysed in the early/mid phase of tumour
develop-ment, from 6 to 16 weeks (Fig.
1
a). At 6 weeks old, mice carrying
the MMTV:PyMT and MMTV:LUC transgenes were divided into
two lots. One was maintained for 10 weeks in normal conditions
of alternating light and dark periods (LD, 12-h light and 12-h
dark), while the other group was exposed for 10 weeks to chronic
CRD through continuous jet lag, simulated by a reduction of 8 h
in the dark period every other day (JL) (Fig.
1
a). This jet-lag
protocol was previously shown to totally disrupt the 24-h
peri-odicity of the rhythmic pattern of rest (12-h light period) and
activity (12-h dark period) and is frequently used to mimic the
effects of shift work or frequent eastbound transmeridian
flights
17. By assessing the locomotor activity and body
tempera-ture of these mice, we confirmed that this jet-lag protocol also
disrupted circadian activity in our transgenic model (Fig.
1
b,
Supplementary Fig. 1 and Supplementary Table 1). From
10 weeks of age to the end of the experiment at 16 weeks, the
growth of primary tumours was monitored every 2 weeks by
imaging the luciferase activity derived from the MMTV:LUC
transgene. At 16 weeks of age, mice were weighed and sacrificed,
and their tissues were processed for further analysis. The median
weight of JL mice was slightly but not significantly higher than
that of LD mice, as expected from previous studies (Fig.
1
c)
18,19.
Peripheral blood cell counts were similar between the two
experimental conditions (Fig.
1
d). In addition, there were only a
few differences in the blood biochemistry parameters of the two
groups of mice: glucose level was significantly reduced in JL mice,
while total levels of cholesterol, triglycerides and free fatty acids
were significantly increased in the plasma of these mice (Fig.
1
e
and supplementary Fig. 2). In vivo imaging revealed no
sig-nificant difference in the onset of tumourigenesis (Fig.
1
f).
However, in JL mice, in vivo bioluminescence measurement of
tumour growth showed a slight increase with age, and tumour
burden was significantly higher (Fig.
1
f, g). We assessed the grade
of primary tumours on paraffin-embedded sections stained with
HES (hematoxylin, eosin, and saffron). Multiple tumour grades,
ranging from hyperplasia to late carcinoma
20, were observed in
primary tumours from both LD and JL mice, but, overall, the
lesions in JL mice were more malignant (Supplementary Table 2
and Supplementary Fig. 3).
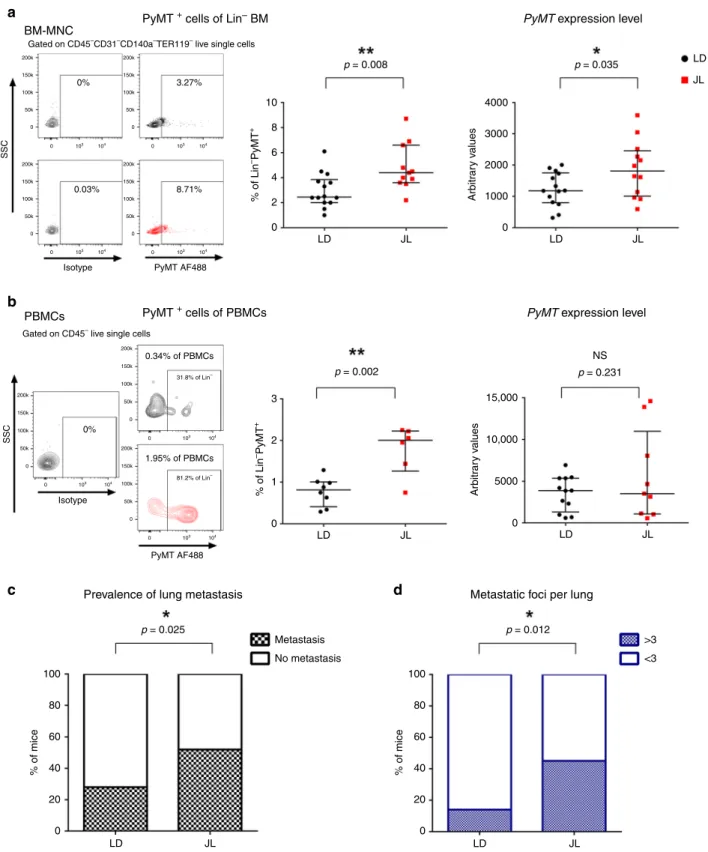
CRD promotes cancer-cell dissemination and metastasis. Using
these mice, we then explored if chronic CRD affected the
semination of cancer cells. We quantified the presence of
dis-seminated cancer cells (DCCs) using
flow cytometry and
real-time PCR analyses of the expression of the PyMT transgene. With
both types of analyses, we observed a significant elevation of
transgene expression in the bone marrow (BM) of JL mice, with
an almost two-fold increase in DCCs in the Lin
−mononucleated
cells of BM (Fig.
2
a). Flow analysis also confirmed an increase in
circulating cancer cells (CTCs)in the bloodstream of JL mice
(Fig.
2
b). Furthermore, we observed DCC cells with H&E staining
of bone sections, and µCT analysis also revealed bone lesions,
highlighting the dissemination of cancer cells to bone
(Supple-mentary Fig. 4a). Consistent with these observations, we observed
a significant increase in the prevalence of metastasis in JL
com-pared with LD mice (Fig.
2
c). The proportion of mice with lung
metastasis increased from 28% in LD to 52% in JL (Fig.
2
c) and
the number of metastatic foci was also significantly higher in JL
mice (Fig.
2
d; Supplementary Fig. 4b). Altogether, our results
reveal a significant impact of chronic CRD on cancer-cell
dis-semination and metastasis.
a
c
e
f
g
Glucose p = 0.043 p = 0.029 p = 0.027 p < 0.0001 p = 0.012 20 3 2.5 2.0 1.5 1.0 0.5 0.0 2 1 0 15 10 5 0 mmol l –1 T otal flux [p s –1 ] T u mour b u rden % mmol l –1 mmol l –1 2.5 2.0 1.5 1.0 0.5 0.0 mEq l –1Total cholesterol Triglycerides Free fatty acids
NS 35 15 60 40 20 0 10 5 0.5 0.4 0.3 0.2 0.1 0.0 30 25 20 15 LD LD WBC RBC WBC 109 I–1 RBC 1012 I–1 HGB g dl–1 HCT % RDWs % MCV fl MCH pg MCH g dl–1 RDWs fl LYM 109 I–1 MON 109 I–1 NEU 109 I–1 JL LD 6.0 × 10⁶ 4.0 × 10⁶ 2.0 × 10⁶ 0 10 12 Weeks 14 16 0 5 10 15 20 25 JL LD LD JL JL LD JL LD JL LD JL JL LD JL LD JL LD JL W eight (g) p = 0.112
d
b
LD LD B6 * FVB MMTV:PyMT MMTV:LUC Weeks 0B IVIS IVIS IVIS IVIS
Da ys 6 8 10 12 14 16 Puberty Early Tumourigenesis LD LD 12:12 Jet Lag JL
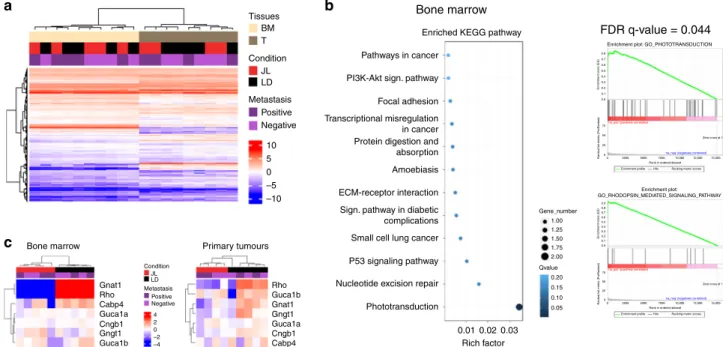
CRD modulates expression of phototransduction genes. In
order to identify the potential molecular players and pathways
that drove the increase in dissemination in JL mice, we performed
an mRNA-seq study on bulk of dissociated primary tumour cells
and on bulk of BM mononuclear cells from
five JL and five LD
mice (Supplementary Fig. 5a). Hierarchical clustering based on
global gene expression profiles clearly separated BM and primary
tumour samples, but did not distinguish between LD and JL
conditions or the absence/presence of metastasis in lungs
(Fig.
3
a). We confirmed this observation through principal
components analysis on BM and primary cancer cells
(Supple-mentary Fig. 5b), in which the two
first principal components
axes did not separate LD and JL samples. We then performed
differential gene expression analysis. As expected from the
hier-archical clustering analysis, only a few genes were significantly
differentially expressed between JL and LD conditions
(Supple-mentary Data 1 and Supple(Supple-mentary Data 2). Intriguingly, in
mononuclear BM cells, the genes with the largest differences in
expression (Rhodopsin, Gnat1, Rbp3 and Prph2) were associated
with Gene Ontology (GO) terms linked with photoperception
and phototransduction (Fig.
3
b). Compared with LD controls,
these genes were strongly downregulated in mononuclear BM
cells from JL mice: Rhodopsin by 23-fold, Gnat1 by 11-fold, Rbp3
by 7-fold and Prph2 by 6-fold (Supplementary Data 1). Similarly,
in primary tumours these genes showed significant
down-regulation (3–4-fold), together with other genes associated with
light perception and phototransduction, such as Cngb1, Nrl
(6-fold) or Bhlhe40 (Supplementary Data 2). Hierarchical clustering
using the genes belonging to the GO term phototransduction
clearly separates BM samples from JL and LD mice while a subset
of these genes also clearly separates primary tumour samples
from JL and LD (Fig.
3
c and Supplementary Fig. 5c). These data
suggest a strong effect of CRD on the expression of genes whose
function is associated with light perception and light signal
transduction, even in tissues that are not directly exposed to light
(due to poor tissue penetration) or not known to respond to light
stimulation.
CRD promotes stemness of primary tumour cells. In order to
understand how chronic CRD can affect the dissemination and
metastatic potential of mammary cancer cells, we further
characterised the cellular composition of primary tumours. We
first tried to assess whether the proportion of mammary cancer
stem cells was different between LD and JL conditions. To do
this, we quantified the expression of known markers of
mam-mary cancer-cell stemness from primam-mary tumours. Using
flow
cytometry, we observed a statistically significant increase in the
percentage of cancer cells that were positive for CD24, CD49f,
and CD326 in JL mice (Supplementary Fig. 6a). Similarly, we
observed an increase in the expression of Itgb1 (coding for
CD29) and Itga6 (coding for CD49f) (Supplementary Fig. 6b
and Supplementary Data 3), together with the upregulation of
genes associated with EMT (Supplementary Fig. 6c and
Sup-plementary Data 3), a key biological process also known to
modulate the stemness of breast cancer cells
21,22. Moreover, the
expression of Inhibin-βA (Inhba) was four times higher in the
primary tumours of JL mice. Inhba encodes a protein subunit
that is necessary to activate TGFβ signalling, a key pathway
associated with EMT
23. We then evaluated the proportions of
cancer stem cells using the mouse mammary stem-cell (MaSC)
signature CD24
medCD29
hiCD49f
hi(Fig.
4
a), which has also
been described for mouse mammary cancer stem cells
24–27. We
observed a significant enrichment in CD24
medCD29
hiCD49f
hicancer cells in the primary tumours of JL mice (Fig.
4
b). Next,
we tested whether this enrichment was associated with an
actual increase in the stemness potential of primary tumours.
To test this hypothesis, we purified cancer cells from primary
tumours of LD and JL mice (see Methods) and performed
mammosphere-formation
assays.
Mammosphere-formation
efficiency (MFE) was significantly higher in cancer cells from
primary tumours of JL mice (Fig.
4
c). Previous studies showed
that Per2 plays an important role in tumour suppression as its
knockdown increases the stemness of mammary epithelial and
cancer cells
13,28. We also observed a decrease of Per2 and Cry2
expression in primary tumours of JL mice (Fig.
4
d and
Sup-plementary Data 3) while expression levels of other core clock
genes remained similar between treatments (Fig.
4
d and
Sup-plementary Data 3). Furthermore, we observed that circadian
oscillations of clock genes modulated the stemness of human
mammary
epithelial
cells.
Specifically, we synchronised
MCF12A cells with respect to their circadian rhythm and
sampled cells at times that corresponded to peaks in PER2 or
BMAL1 expression (Supplementary Fig. 6d, e)
29. We then
assessed the stemness of these cells at the different time points.
We observed a diurnal oscillation in mammosphere-formation
efficiency, with a negative correlation with the expression peaks
of PER genes (Fig.
4
e). Finally, to quantify the
tumour-initiation potential of cells from the primary tumours, we
performed orthotopic injection of isolated tumour cells into the
mammary fat pads of recipient mice (see Methods). We found
that grafted cancer cells that were purified from JL donor mice
demonstrated increased tumour-initiating potential in
immu-nocompetent wild-type C57BL/6J mice compared with cells
obtained from LD donors (Fig.
4
f). We further confirmed that
the tumours used for transplants and mammospheres
forma-tion were all of similar subtypes, ruling out the possibility that
Fig. 1 Chronic circadian disruption slightly enhances tumour burden. a Experimental timeline for evaluation of the effect of chronic jet lag on spontaneous mammary tumourigenesis in B6*FVB PyMT mice. B: birth; IVIS: tumour growth monitoring using bioluminescence. Dashed lines highlight the start and end points of the experiment.b Representative actograms of LD and JL mice. LD: 12-h light and 12-h dark; JL: jet lag, represented by a shortening of the dark period by 8 h every second day.c Weight at sacrifice of mice in LD (n = 25) and JL (n = 21) conditions. Data are presented as a scatter dot plot with lines indicating the median with interquartile range (error bars).P-value calculated from an unpaired two-sided t-test. d Blood cell counts: total numbers of white blood cells (WBC) and red blood cells (RBC) in LD (n = 16) and JL (n = 17) mice. LYM lymphocytes, MON monocytes, NEU neutrophils, HGB haemoglobin, HCT haematocrit, MCV mean corpuscular volume, MCH mean corpuscular haemoglobin, RDW red cell distribution width. Data presented as box-and-whisker plots. Variability is shown using medians (line in the box), 25th and 75th percentiles (box), and min to max (whiskers).e Glucose (n = 8 LD and n = 9 JL), total cholesterol (n = 10 LD and n = 10 JL), triglyceride (n = 9 LD and n = 9 JL, p = 5.04882e−5), and free fatty acid (n = 9 LD and n = 9 JL) profiles of LD and JL mice. Data are presented as scatter dot plots with lines indicating the median with interquartile range (error bars).P-value calculated from an unpaired two-sided t-test. f Timelines of tumour growth in total flux [p s−1] measured by in vivo bioluminescence imaging in LD (n = 6) or JL (n = 5) groups. Data are presented as a dot plot with dots indicating the median with interquartile range (error bars).g Tumour burden (tumour to body weight ratio) as % in LD (n = 25) or JL (n = 21) conditions. Data are presented as a scatter dot plot with lines indicating the median with interquartile range (error bars).P-value calculated from an unpaired two-sided t-test. Indicated (n) represent number of independent experiments as biological replicates.a
b
c
d
15,000 10,000 5000 0 Arbitr ar y v aluesPyMT + cells of Lin– BM
PyMT + cells of PBMCs
Prevalence of lung metastasis Metastatic foci per lung
PyMT expression level
PyMT expression level
p = 0.008 p = 0.002 p = 0.025 p = 0.012 p = 0.231 NS 10 8 6 4 2 0 0 1000 2000 3000 4000 % of Lin –PyMT + p = 0.035 BM-MNC PBMCs 200k 150k 100k 0% 3.27% 8.71% 0.03% Isotype Isotype SSC SSC PyMT AF488 PyMT AF488 LD LD Arbitr ar y v alues JL LD Metastasis No metastasis 100 80 60 40 20 % of mice 0 100 >3 <3 80 60 40 20 % of mice 0 3 2 1 0 JL LD JL LD JL LD JL JL LD JL 50k 0 200k 150k 100k 50k 0 200k 150k 100k 50k 0 200k 150k 100k 50k 0 200k 150k 100k 50k 0 200k 150k 100k 50k 0 0 103 104 0 103 104 0 103 104 0 103 104 0 103 81.2% of Lin– 31.8% of Lin– 0.34% of PBMCs 1.95% of PBMCs 0% 104 0 103 104 0 103 104 200k 150k 100k 50k 0
Gated on CD45–CD31–CD140a–TER119– live single cells
Gated on CD45–live single cells
% of Lin
–PyMT
+
Fig. 2 Chronic circadian disruption increases cancer-cell dissemination and metastasis. a Disseminated tumour cells detected in LD and JL mice at 16 weeks of age byflow cytometry (left, LD n = 14 and JL n = 11) and real-time PCR (right, LD n = 14 and JL n = 12) of bone marrow mononucleated cells (BM-MNC). Representativeflow cytometry plots showing intracellular PyMT staining of CD45−CD31−CD140a−Ter119−live BM-MNC cells. Data are presented as scatter dot plots with lines indicating the median with interquartile range (error bars).P-values are calculated from an unpaired two-sided t-test. b Circulating tumour cells in peripheral blood mononuclear cells (PBMCs) detected by flow cytometry (left; LD: n = 8 and JL: n = 6) and real-time qPCR (right; LD:n = 12 and JL: n = 9) in mice at 16 weeks of age. Representative flow cytometry plots showing intracellular PyMT staining of CD45−live PBMCs (SSC: side scatter). Data are presented as scatter dot plots with lines indicating the median with interquartile range (error bars).P-values are calculated from an unpaired two-sidedt-test. c Prevalence of lung metastasis in LD (n = 25) and JL (n = 21) cohorts at 16 weeks of age. Data represent the percentage of mice with metastasis in both conditions,P-value obtained from a binomial two-sided test. d Number of metastatic foci per lung in LD (n = 25) and JL (n = 21) mice at 16 weeks of age. Data represent the percentage of mice with >3 or <3 metastatic foci in both conditions. P-value obtained from a binomial two-sided test. Indicated (n) represents the number of independent experiments as biological replicates.
this may be the cause of the observed differences in MFE and
tumour-initiating potential (Supplementary Table 2).
Altogether, these data support the
findings of previous studies,
but also provide further evidence for the importance of a
functional circadian clock in regulating the stemness of
mammary epithelial cells and deepen our understanding of the
biological consequences of CRD.
CRD
promotes
an
immunosuppressive
tumour
micro-environment. The immune system plays a critical role in
tumour progression and metastatic dissemination. To
investi-gate whether the increased prevalence of metastasis in JL mice
resulted from changes in the immune microenvironment of
tumours, we characterised tumour-infiltrating cells (TICs)
using
flow cytometry (see the representative gating strategy
30in
the Supplementary Fig. 7). We found reduced numbers of
CD45
+immune cells in tumours from JL mice (Fig.
5
a), but
no significant alteration in the proportional distribution
of different immune cell types (Fig.
5
b; Supplementary Fig. 8).
However,
fine-scale characterisation of subpopulations of
macrophages and T cells revealed significant differences
between the LD and JL tumour immune microenvironment.
Specifically, the CD64
+CD24
−macrophages, determined by
using the gating strategy described by Yu et al.
30, were further
dissected based on their MHC II expression level. Similarly to
previous report
31, we identified CD11b
+MHC II
hianti-tumour
and CD11b
+MHC II
lowpro-tumour tumour-associated
mac-rophages (TAMs) (Supplementary Fig. 7a). In JL tumours, the
percentage of tumour-suppressive MHC II
hiTAMs was not
significantly altered compared with LD tumours (Fig.
5
c).
Instead, JL tumours had a significantly higher proportion of
tumour-supporting MHC II
lowTAMs (Fig.
5
d).
Characteriza-tion of the major T-cell populaCharacteriza-tions revealed a decrease in
the number of infiltrating CD8
+T cells and an increase in the
CD4/CD8 ratio in JL tumours (Fig.
5
e). Importantly, we
observed a significant enrichment of the immunosuppressive
CD4
+FoxP3
+Treg population in the primary tumours of JL
mice and consequent elevation of Treg/CD8 ratio (Fig.
5
f),
which together with CD4/CD8 ratio is a prognostic indicator
of therapy responsiveness and survival in breast cancer
patients
32–34. A significant elevation in the CD4/CD8 ratio was
also detected in the peripheral blood of JL mice (Fig.
5
g,
Sup-plementary Fig. 8b). This additional use of CD4 or Treg to CD8
ratio also provides cleaner representation of TIL/lymphocyte
values, which in general show high inter-individual variability
(Fig.
5
e, f, Supplementary Fig. 8b). Our results suggest that
chronic CRD weakens the anti-tumour immune response and
creates an immunosuppressive pro-tumour microenvironment.
The latter effect, together with the effects of CRD on cancer-cell
stemness, may help to facilitate the dissemination of mammary
cancer cells and the formation of lung metastasis.
Chronic CRD alters the cytokine–chemokine network. The
importance of circadian regulation in leukocyte homoeostasis
and migration is well-documented
35to better understand how
chronic CRD could modify the immune microenvironment of
a
Tissues
Bone marrow
Bone marrow
FDR q-value = 0.044
Enriched KEGG pathway
Enrichment plot: GO_PHOTOTRANSDUCTION
Enrichment plot: GO_RHODOPSIN_MEDIATED_SIGNALING_PATHWAY
Enr
ichment score (ES)
0.8 0.7 0.6 0.5 0.4 0.3 0.2 0.1 0.0 75 ‘na_pos’ (positively correlated)
‘na_neg’ (negatively correlated) 50
25
0
0 2500 5000 7500
Rank in ordered dataset
Enrichment profile Hits Ranking metric scores
Rank ed list metr ic (PreRank ed) 75 50 25 0 Rank ed list metr ic (PreRank ed) 10,000 12,500 15,000 0 2500 5000 7500
Rank in ordered dataset
Enrichment profile Hits Ranking metric scores
10,000 12,500 15,000
Zero cross at 1
‘na_pos’ (positively correlated)
‘na_neg’ (negatively correlated) Zero cross at 1
Enr
ichment score (ES)
0.8 0.9 0.7 0.6 0.5 0.4 0.3 0.2 0.1 0.0 0.02 Rich factor 0.03 Gene_number Qvalue 0.20 0.15 0.10 0.05 1.00 1.25 1.50 1.75 2.00 0.01 Pathways in cancer PI3K-Akt sign. pathway Focal adhesion
Protein digestion and absorption Amoebiasis ECM-receptor interaction
Small cell lung cancer P53 signaling pathway Nucleotide excision repair Phototransduction Sign. pathway in diabetic complications Transcriptional misregulation in cancer Primary tumours Gnat1 Gnat1 Condition Metastasis JL LD Rho Rho Cabp4 Cabp4 Guca1a Guca1a Guca1b Cngb1 Cngb1 Gngt1 Gngt1 Guca1b Condition Metastasis BM T JL LD Positive Negative Positive Negative 4 2 0 –2 –4 10 5 0 –5 –10
b
c
Fig. 3 Chronic circadian disruption does not profoundly alter gene expression profiles in primary tumours or bone marrow mononucleated cells, with the exception of genes linked with phototransduction and light perception. a RNA-seq sample heatmap and hierarchical clustering based on the expression (FPKM) of 12,556 genes across the two tissues. Gene expression matrix was centered, reduced, and log2 transformed. Samples appear as columns and genes as rows; samples are labelled by their tissue of origin (BM: bone marrow (n = 10, salmon) and T: primary tumour (n = 9, grey)), experimental conditions (JL (n = 9) in red and LD (n = 10) in black) and the presence (n = 9)/absence (n = 10) of metastasis (dark and light violet). Hierarchical clustering was performed using Euclidean distance and the Ward.D2 criterion for agglomeration. The colour scale represents expression levels, red for high expression and blue for low expression.b Enriched KEGG Pathway and Gene Set enrichment analysis for bone marrow. GSEA plots are shown for the Gene Ontology (GO) terms: Phototransduction and Rhodopsin_mediated_signaling_pathway.c Heatmap based on the expression (FPKM) of differentially expressed genes linked with phototransduction and photoperception in bone marrow (n = 10) and primary tumours (n = 9). Gene expression matrix was centered, reduced, and log2 transformed. Samples appear as columns and genes as rows; samples are labelled by the experimental conditions (JL in red and LD in black) and the presence/absence of metastasis. Hierarchical clustering was performed using Euclidean distance and the Ward.D2 criterion for agglomeration. The colour scale represents expression levels, red for high expression and blue for low expression. Indicated (n) represents the number of independent experiments as biological replicates.
tumours, we decided to investigate the cytokine–chemokine
network in JL mice. Using a magnetic Luminex assay, we
first
quantified levels of 17 circulating cytokines in plasma from JL
and LD mice. No significant differences were observed, with the
exception of IL-4 whose circulating levels were slightly lower in
JL mice (Supplementary Table 3). Since plasma cytokine/
chemokine levels are not necessarily representing the tumour
microenvironment, we used the data of our transcriptomic
study and real-time PCR to assess the expression levels of
cytokines/chemokines and their receptors in primary tumours.
a
b
c
e
d
f
LD CD24 BV510 CD29 FITC CD49f PE CD24 BV510 LDLD or JL primary tumour cells
Orthotopic injection (MFP) p = 0.039 p = 0.0003 p = 0.025 6 100 80 60 40 20 0 100 mm % of mice LD donor JL donor Tumour initiation
No tumour initiation JL donor
LD donor MFP 8 weeks post injection
140 2.5 2.0 1.5 1.0 0.5 0.0 ZT24 ZT36 ZT48 ZT60 Expression le v el (FPKM) 120 100 80 60 40 20 0 ArntlArntl2Cloc k
Cry1 Cry2 Per1 Per2 Per3Nr1d1 Rorc
0.862 0.513 0.978 0.691 0.016 0.119 0.238 0.026 0.125 0.172 4 4 3 2 1 0 2 0 P ercentage of Lin-MFE % MFE % JL LD JL CD29 FITC CD49f PE 65.6% CD24med CD24med CD29hi CD29hi CD49fhi CD49fhi 72.6% 4.04% 2.74% 81.9% 88.7% 1.48% of TC 2.61% of TC SSC JL SSC SSC SSC SSC SSC
MaSC % (CD24medCD29hiCD49fhi) of tumour cells
MaSC % CD24+medCD29hiCD49fhi Mammosphere formation >50 µm Mammosphere formation >40 µm
Gated on CD45–CD31–CD140a–TER119– live single tumour cells (TC)
250K 200K 150K 100K 50K 0 250K 200K 150K 100K 50K 0 0 103 104 105 0 103 104 105 0 103 100 101 102 103 104 105 100 101 102 103 104 105 104 105 0 103 104 105 250K 200K 150K 100K 50K 0 250K 200K 150K 100K 50K 0 250K 200K 150K 100K 50K 0 250K 200K 150K 100K 50K 0
We observed that the most downregulated (<−0.8 Log2FC)
cytokines/chemokines in JL primary tumours, including Ifng,
Cxcl13, Tnfs18 and Cxcl11, are known to favour an anti-tumour
immune response (Fig.
6
a; Supplementary Data 3). While the
other hand, the most upregulated (>0.8 Log2FC) ones,
including Cxcl3, Cxcl5, Il10 and Il1b, are linked to
immuno-suppression or tumour progression (Fig.
6
a, Supplementary
Data 3; Supplementary Fig. 9b). In BM mononucleated cells,
transcriptomic analysis revealed a high degree of similarity
between LD and JL conditions. However, consistent with the
results from primary tumours, we detected significantly
ele-vated levels of Cxcl5 in JL BM mononuclear cell samples
compared with LD samples (Supplementary Fig. 9e). As CXCL5
has been previously linked to recruitment of suppressive
immune cell phenotypes
36, metastatic processes
37–39and also
shown to be under circadian gating
35,40we assessed its
recep-tor, CXCR2 level in primary tumours. In addition, as a major
regulator of tumour cell dissemination we also investigated the
expression of CXCR4
41,42, which is also under circadian
reg-ulation
35. In primary tumours, we observed a significant
increase in the number of CXCR4
+(Fig.
6
b), but not of
CXCR2
+(Supplementary Fig. 9c) cancer cells while the number
of CXCR2
+TICs was also significantly increased in JL tumours
(Fig.
6
c). Collectively, these data support the existence of
CRD-driven alterations in the cytokine–chemokine network that
promote
cancer-cell
dissemination
and
the
immune-suppressive tumour phenotype: potentially a more prominent
CXCL12-CXCR4 axis favouring cancer-cell dissemination and
specifically, an enhanced role for the CXCL5-CXCR2 axis that
enriches immune-suppressive cell types in the tumour
micro-environment. To test this, we explored the effects of CXCR2 on
tumour progression in JL mice by treating them with a CXCR2
inhibitor (SB265610)
43,44. Briefly, 10-week-old MMTV:PyMT
mice, who had been subjected to chronic jet lag since the age of
6 weeks, were injected with the CXCR2 inhibitor daily for
5 days then given 2 days’ rest; this treatment continued until
they reached 18 weeks of age (Fig.
6
d). Mice were then
sacri-ficed and examined as in our previous analyses. In the group
treated with the CXCR2 inhibitor, we observed a significant
decrease in the prevalence of lung metastasis (Fig.
6
e) and in
the amount of PyMT-positive DCCs in the BM (Fig.
6
f). While
the percentage of TIC remains similar between conditions
(Fig.
6
g), the CD4/CD8 ratio was significantly lower in the
group treated with the CXCR2 inhibitor, indicating enrichment
in cytotoxic CD8 T cells (Fig.
6
h, i, Supplementary Fig. 10a).
Finally, in agreement with previous studies
37,38,44we observed
that CXCR2 inhibition under LD conditions (Supplementary
Fig. 10b–f) also led to a significant reduction in PyMT-positive
DCC and in the CD4/CD8 ratio, without altering the
percen-tage of total TIC, lymphoid and myeloid cells (Supplementary
Fig. 10c–f). However, there was no significant difference in the
number of metastases detected in LD mice treated with the
CXCR2 inhibitor (Supplementary Fig. 10b).
Discussion
In addition to epidemiological studies, there is a growing body
of experimental evidence linking circadian disruption to
increased breast cancer risk and poorer survival
out-come
6,8,45,46. Here, we present
findings showing that chronic
CRD favours cancer-cell dissemination and metastasis
forma-tion, and we shed light on the underlying cellular and molecular
alterations. For this purpose we used the MMTV::PyMT model
of spontaneous murine mammary carcinogenesis
15,47, which
recapitulates many processes involved in human metastatic
breast cancer
20,48. This model allowed us to work over extended
time periods, representing a physiological context closer to that
of human breast cancer, and thus to perform a comprehensive
analysis of cancer cells and the tumour microenvironment, with
an eye towards systematic changes and metastatic
dissemina-tion. Mice were raised under jet-lag conditions that mimicked
the effects of shift work or frequent eastbound transmeridian
flights; this protocol results in severe perturbations in
rest-activity cycles, body temperature and clock-gene expression in
the CNS and peripheral organs
17. It also takes into account the
observation that the circadian rhythm is more disturbed by
advances rather than delays in local time
49.
Our observations on the systemic physiology of these mice
confirmed the importance of circadian rhythm in metabolic
processes. In line with previous studies, we found a significant
increase in the plasma lipid levels in JL mice compared with
controls, supporting the link between CRD and cardiovascular
diseases
50,51. Besides lipid metabolism, the feeding-signalling and
insulin-glucose axes are also under circadian regulation. Several
studies have reported elevated leptin and insulin resistance in
CRD conditions, associated with weight gain, obesity and type-2
diabetes
14,52,53. In our study, we detected only
fine-scale
differ-ences in weight and leptin or insulin levels, which might be due to
the timeframe of our study and to the continuous feeding activity
of JL mice, which reduces physiological differences between rest
and activity phases
54. Furthermore, we did not examine the
ability of carcinogenesis to reprogram hepatic homeostasis and
metabolism
55,56. For this reason, we cannot exclude that the
developing mammary tumours could have partially rewired
Fig. 4 Chronic circadian disruption increases cancer-cell stemness in primary tumours. a Representative gating strategies for CD24medCD29hiCD49fhimammmary stem cells (MaSC) with contour plots shown for LD (black) and JL (red) tumours (SSC: side scatter).b Frequency of CD24medCD29hiCD49fhi
mammary stem cells (MaSC) in LD and JL tumours (n = 13). Data are shown as a scatter dot plot with lines indicating the median with interquartile range (error bars).P-value obtained from an unpaired two-sided t-test. c Mammosphere-formation efficiency (MFE%) of LD and JL tumour cells (n = 3). Data are shown as a scatter dot plot with lines indicating the median with interquartile range (error bars).P-value obtained from an unpaired two-sided t-test. d Circadian clock genes mRNA expressions (FPKM: Fragments Per Kilobase Million) in cancer cells from LD (n = 5) and JL (n = 4) primary tumours. Data presented as box-and-whisker plots. Variability is shown using medians (line in the box), 25th and 75th percentiles (box), and min to max (whiskers). P-values were calculated using DESeq2 and the Wald test based on the negative binomial distribution. Respective log2FoldChange (log2FC) are listed in Supplementary Data 3.e Mammosphere-formation efficiency (MFE%) of MCF12A normal human mammary cells in different circadian phases (n = 3). Blue squares and grey diamonds represent peaks ofBMAL1HIGH/PER2LOWandBMAL1LOW/PER2HIGHexpression, respectively. Data are presented as a dot plot
with dots indicating the median with interquartile range (error bars).P-value was calculated from a one-way ANOVA/Tukey’s multiple comparisons test. f Tumour-initiation study based on orthotopic injection of primary tumour cells from LD (n = 6) and JL (n = 6) mice in the mammary fat pad (MFP) of host mice (n = 4 per each donor). Tumour-initiation potential was calculated as the percentage of host mice that formed tumours. We set a threshold based on MFP weight at 0.25 g for positivity.P-value was obtained from a binomial two-sided test. The picture illustrates the observed differences between MFP between JL and LD donors. Indicated (n) represent number of independent experiments as biological replicates.
a
b
c
e
f
g
d
TIC% Anti tumour CD11b+MHC IIhi TAM CD4+ TILCD4+FoxP3+ Treg Treg/CD8+ TIL ratio CD4+/CD8+ ratio
CD8+ TIL CD4+/CD8+ TIL ratio
Pro tumour CD11b+ MHC IIlow TAM p = 0.043 20 Monocytes LD TIC % JL TIC % Macrophages DCs Neutrophils Eosinophils T cells B cells NK cells 15 10 5 0 LD 60 80 50 10 8 6 4 2 0 40 30 20 10 0 60 40 20 0 100 80 60 40 20 0 40 20 0 % of CD45 + % of CD45 +CD3 + % of CD4 +F o xp3 + CD4 +F o xp3 + / CD8 + % of CD45 +CD3 + CD4 / CD8 CD4 / CD8 % of CD45 +CD64 + NS p = 0.426 NS p = 0.314 p = 0.034 p = 0.019 p = 0.022 p = 0.0024 p = 0.0083 NS p = 0.748 p = 0.007 p = 0.016 JL LD JL LD JL LD 3 2.0 1.5 1.0 0.5 0.0 2 1 0 20 25 15 10 5 0 JL LD JL LD JL LD JL LD JL 60 40 20 0 % of CD45 + LD JL LD JL 100 80 60 40 20 0 % of CD45 +CD64 + LD JL CD45 + cells %
Fig. 5 Chronic circadian disruption attenuates immune infiltration and creates a pro-tumour immune microenvironment. a Percentage of tumour-infiltrating immune cells (TIC) in LD (n = 13) and JL (n = 13) tumours. Flow cytometric analysis revealed a lower percentage of TICs in JL tumours. Data are presented as a scatter dot plot with lines indicating the median with interquartile range (error bars).P-value obtained from an unpaired two-sided t-test. b Relative distribution of main immune cell types in TICs from LD and JL tumours. Data presented as pie charts displaying the mean values of 13 mice. c, d Tumour-associated macrophage (TAM) phenotypes in LD (n = 13) and JL (n = 13) tumours. Flow cytometry of JL tumours showed a significant reduction in the anti-tumour CD11b+MHC IIhiphenotype, with a significant increase in pro-tumour CD11b+MHC IIlowTAMs.e Tumour-infiltrating
lymphocytes (TIL) in LD (n = 10) and JL (n = 8) tumours. TILs are presented as percentage of CD3+immune cells. The proportion of CD8+ TILs was significantly lower in JL tumours, resulting in an increase in the CD4/CD8 ratio. f Tumour-infiltrating CD4+FoxP3+T cells in LD (n = 10) and JL (n = 8) mice. Flow cytometry revealed a significant increase of Treg and Treg/CD8+ratio in primary tumours of JL mice.g CD4/CD8 ratio in the peripheral blood of LD (n = 8) and JL (n = 6) mice. c–g Data are presented as scatter dot plots with lines indicating the median with interquartile range (error bars). P-values obtained from unpaired two-sided t-test. Indicated (n) represent number of independent experiments as biological replicates.
hepatic circadian homeostasis and consequently buffered the
CRD-induced metabolic changes.
Consistent with the slight metabolic changes observed between
conditions, we did not observe major histological differences in
primary tumours following 10 weeks of CRD. This supports the
hypothesis that the increase in DCCs and the observed
enrich-ment in malignant lesions in JL mice represent a global speed-up
toward carcinogenesis rather than a selective process leading to
the development of different tumour subtypes in LD and JL mice.
Previous studies proposed that CRD boosts tumour
progres-sion through increased proliferation and metabolic
reprogram-ming
17,56–59. Here we demonstrate that CRD also leads to
significantly enhanced cancer-cell dissemination and metastatic
burden. Our results provide experimental evidence that reinforces
a
b
d
e
g
h
i
f
Prevalence of lung metastasis PyMT+ cells in BM-MNC PyMT+ cells in PBMC
NS Screening for DTCs and immunophenotyping Metastasis No metastasis p = 0.041 p = 0.94 TIC % NS p = 0.041 p = 0.098 100 40 30 20 10 0 4 p = 0.009 3 2 1 0 10 5 4 3 2 1 0 8 6 4 2 0 80 60 40 20 0 Vehicle SB265610 Vehicle SB265610 Vehicle SB265610 Vehicle 43% 57% 38% Lymphoid Myeloid 62% SB265610 Vehicle SB265610 Vehicle SB265610 % of mice PyMT +Lin – % CD45 + cells % CD4/CD8 r atio CD4/CD8 ratio PyMT +Lin – % i.p. injection Jet lag 10 Cxcr2 inhibitor SB265610 6 Weeks: 18
c
>0.8log2FC 40 40 150 2.5 2.0 1.5 1.0 0.5 0.0 100 50 0 30 20 10 4 3 2 1 0 0.067 0.017 0.020 0.101 0.002 0.001 0.057 0.207 0.264 0.009 0.004 0.009 0.048 0.015 0.028 0.044 0.288 30 20 10 0Cxcl3 Cxcl15 Cxcl13 Cxcl11 Cxcl9 II17b II1a II12b II10 II1b II1r
n Ifng Tnfsf18 Cxcl5 Ccl22 Ccl12 Ccl28 Expression le v e l (fpkm) >0.8log2FC <–0.8log2FC <–0.8log2FC Chemokines
Primary tumour cells CXCR4
Tumour-infiltrating immune cells CXCR2 p = 0.0016 p = 0.013 5.0 × 10⁵ 4.0 × 10⁵ 3.0 × 10⁵ 2.0 × 10⁵ 1.0 × 10⁵ 0 LD JL LD JL Cell million –1 2.5 × 10⁵ 2.0 × 10⁵ 1.5 × 10⁵ 1.0 × 10⁵ 5.0 × 10⁴ 0 Cell million –1 Cytokines
the
findings of previous genetic studies linking cancer severity,
relapse and higher risk of metastasis with the compromised
expression of clock genes
8,60,61. Specifically, we observed reduced
expression of the Per2 and Cry2 clock genes in primary tumours
of JL mice. Intriguingly, genes involved in phototransduction
were among the most significantly altered in both primary
tumours and mononuclear BM cells from JL mice. The expression
of several phototransduction genes is under circadian regulation
through the NR1D1 (Rev-Erbα)—NRL, CRX and NR2E3
com-plexes
62,63, and their downregulation is certainly related to the
CRD conditions experienced, despite the fact that the analysed
tissues were not directly exposed to light stimuli. In mammals, the
functionality of phototransduction molecules in non-visual
tis-sues has only been poorly investigated. Some data have suggested
a light-independent mechanism of activation of the
photo-transduction (transducin/PDE6/Ca
2+/cGMP) cascade through
Wnt/Frizzled-2, which might function as an anti-apoptotic
mechanism
64,65. Two recent studies also showed that peripheral
clocks can be synchronised by light independently of a functional
central circadian clock, and suggested that phototransduction
players could drive this
66,67.
Clock genes and circadian oscillation have been shown to
regulate the EMT programme
13,68, which is one of the
mechanisms behind the spread and colonisation of tumour
cells
23,69. Our differential gene expression analysis of primary
tumours revealed an elevated expression of genes associated
with EMT under CRD conditions. The upregulated
EMT-inducers—Zeb2, Foxc2 and Inhba—have also been implicated in
promoting cancer stem-cell and metastatic properties
70–72. As
found in previous studies, our data support the link between the
EMT process and the stemness/tumour-initiating ability of
cancer cells
21,22,73. In particular, we observed enrichment in the
stem-cell population of primary tumours from JL mice.
Fur-thermore, our data reveal an enhanced degree of stemness and
tumour-initiation potential for JL cancer cells in vitro and
in vivo. In addition, we demonstrate here that the stemness of
mammary epithelial cells oscillates diurnally. This provides
further evidence for the role that circadian rhythm and clock
genes play in regulating the stemness of mammary cells. The
negative correlation between oscillatory PER2 expression and
capacity for mammosphere formation confirms the suppressive
effect of Per2 on self-renewal and tumour initiation
13. Similarly,
mammary epithelial cells derived from ClockΔ19 mutant mice
showed reduced mammosphere-formation capacity
12.
Collec-tively, these data suggest that CRD promotes metastasis by
enhancing the EMT programme and, consequently, the
tumour-initiating potential of cancer cells.
Circadian regulation of leukocyte homeostasis, trafficking and
immune responses, especially in contexts of infection and
inflammation, is well-documented
74–76. However, little is known
about the effect of circadian rhythms on the tumour
micro-environment and tumour immunity. Our results demonstrate
that CRD has a profound effect on tumour immunity through
modulation of the cytokine–chemokine network. Our data
sug-gest that CRD attenuates immune infiltration to tumour sites
potentially by disrupting the diurnal trafficking of leukocytes and
consequently reducing the daily total number of these cells in the
circulation
77. Here, we provide evidence that CRD induces a
pro-tumourigenic switch of the tumour immune microenvironment,
primarily driven by alterations in the CXCL5-CXCR2 axis. The
circadian expression of the CXCL5-CXCR2 axis has been
described in previous studies, along with its involvement in
inflammatory diseases
35,40,78,79. Furthermore, CXCR2 and several
of its ligands (CXCL1, CXCL2, CXCL5, CXCL7 and CXCL8) have
also been linked to breast cancer progression and metastatic
invasion
80. Therefore, considering the results of previous studies,
we propose the following inflammatory cascade as a possible
mechanism behind CRD-related enhanced tumourigenesis and
metastatic spread (Fig.
7
): CRD increases the expression of Cxcl5
in tumours, leading to enhanced infiltration of CXCR2
+myeloid
cells, e.g. MDSCs. The consequent accumulation of MDSCs,
TAMs and TANs promotes an immunosuppressive
micro-environment
36. These cells are able to directly suppress T-cell
responses and inhibit CD8 T-cell infiltration, resulting in
impaired anti-tumour activity
36,81–83. Collectively, this autocrine
cascade promotes tumour growth and metastasis. In JL mice, the
inhibition of CXCR2 significantly reduced lung metastasis and
dissemination to bones, which strongly supports our
hypothe-sized model of CRD-linked tumourigenesis. Two mechanisms
have been described that explain how the inhibition of
CXCR2 signalling suppresses metastasis. First, CXCR2 signalling
has been shown to play a role in the modulation of the tumour
immune microenvironment and the recruitment of MDSCs in
distant metastatic sites, along with the consequent development
of the pre-metastatic niche
37,38. Second, the CXCL5-CXCR2 axis
has also been associated with the process by which circulating
tumour cells home to the bone
39. In addition, a more recent study
showed its importance in colonization during bone metastasis
84.
In line with these studies, we observed fewer cancer cells in the
BM after inhibition of CXCR2 in both LD and JL conditions, and
a lower degree of metastasis in JL condition (but not in the LD
group), but it remains unclear which one of these mechanisms (or
both) might be responsible. Here, in line with previous
stu-dies
37,38, we suggest the use of CXCR2 inhibition in combination
Fig. 6 Circadian disruption alters chemokine/cytokine regulatory networks. a The most up- and downregulated chemokines and cytokines in LD (n = 5) and JL (n = 4) tumours, as detected by mRNA-seq. Expression data represent FPKM values and are presented as box-and-whisker plots. Variability is depicted using medians (line in the box), 25th and 75th percentiles (box), and min to max (whiskers).P-values were calculated using DESeq2 and the Wald test based on the negative binomial distribution. Respective log2FoldChange (log2FC) are listed in Supplementary Data 3.b Number of tumour cells positive for CXCR4 in LD (n = 14) and JL (n = 9) tumours. Data are shown as a scatter dot plot with lines indicating the median with interquartile range (error bars).P-values obtained from unpaired two-sided t-test. c Number of tumour-infiltrating immune cells positive for CXCR2 in LD (n = 11) and JL (n = 8) samples. Data are shown as a scatter dot plot with lines indicating the median with interquartile range (error bars).P-values obtained from unpaired two-sidedt-test. d–i Effects of CXCR2 inhibition on tumour development in JL mice. d Scheme illustrating the experimental plan. MMTV:PyMT mice were subjected to chronic jet lag from the age of 6 weeks, and from 10 to 18 weeks of age were intraperitoneally (i.p.) injected once a day (5 days injection+ 2 days resting) with the CXCR2 antagonist SB265610 (2 mg kg−1in 5% DMSO–8% Tween80 0.9% NaCl). Mice were sacrificed at 18 weeks of age. e Prevalence of lung metastasis in mice injected with vehicle (n = 5) or SB265610 (n = 6). P-value obtained from a binomial two-sided test. f The percentage of disseminated tumour cells in BM and peripheral blood in mice injected with vehicle (n = 5) and SB265610 (n = 6). g Percentage of tumour-infiltrating immune cells (TIC) in mice injected with vehicle (n = 5) and SB265610 (n = 6). h Relative distribution of lymphoid and myeloid TICs in both cohorts. Data are presented as pie charts displaying the mean values of mice.i CD4/CD8 ratio in tumours from vehicle (n = 5) and SB265640 (n = 6) groups. Data (f, g, i) are presented as scatter dot plots with lines indicating the median with interquartile range (error bars).P-values were calculated from an unpaired two-sidedt-test. Indicated (n) represent number of independent experiments as biological replicates.with conventional chemotherapy or immunotherapy to reduce
cancer-cell dissemination and improve therapy outcome. This
could be especially beneficial in cases with known CRD (either
systemic or localised, tumour specific alteration of the circadian
molecular clock) where the CXCR2 driven mechanisms are
accelerated, as our results show.
Furthermore, we also describe here upregulation in the
CXCL12-CXCR4 axis, which is another key mechanism that
promotes metastatic spread in JL mice. Circadian control of the
CXCL12-CXCR4 axis
35,77,85and its role in immunosuppression
and breast cancer metastasis are well described
41,42,86.
The CRD-induced alterations we describe in chemokine/
chemokine-receptor signalling drive the changes in the
tumour microenvironment and metastatic capacity. Recent
studies have also suggested the use of CXCR2 or CXCR4
inhibitors in combination with immunotherapy to overcome
therapeutic resistance
83,87. These therapeutic strategies,
toge-ther with the use of predictive tools based on clock-gene
expression for cancer prognosis, will lead to precision circadian
medicine with improved efficacy and responsiveness to
immunotherapy
46,88.
In conclusion, our study provides, experimental evidence of the
link between CRD and an increase in cancer-cell dissemination
and metastasis. Based on our results, we propose two molecular
mechanisms by which CRD promotes tumourigenesis: (1) CRD
increases the stemness and tumour-initiating potential of cancer
cells, at a minimum by promoting a pro-EMT intra-tumoural
context, and (2) CRD reduces anti-tumour immunity through
modifications in chemokine/chemokine-receptor signalling.
Finally, our
findings draw attention to the potential role of genes
involved in phototransduction in peripheral tissues. However, our
data do not confirm whether the observed downregulation of
these genes in JL mice is due to their circadian rhythmicity in LD
mice or whether it reflects a functional role in peripheral tissues.
This intriguing observation in bone marrow cells and primary
tumours during CRD need further investigation.
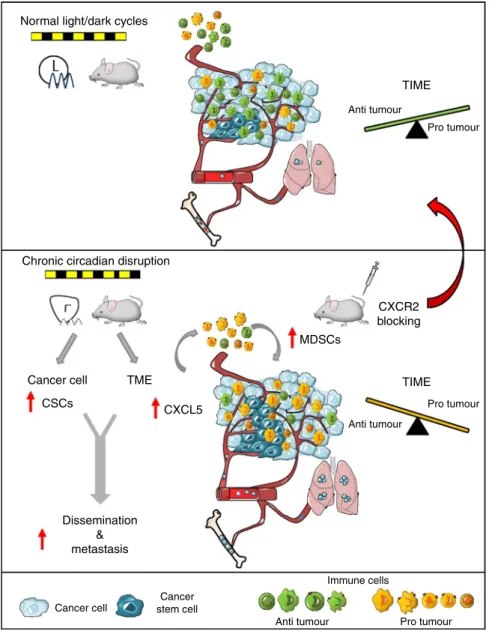
Normal light/dark cycles
Anti tumour Anti tumour Anti tumour Immune cells Pro tumour Pro tumour
Chronic circadian disruption
Pro tumour TIME TIME CXCR2 blocking MDSCs CXCL5 CSCs Cancer cell Cancer stem cell Dissemination & metastasis TME Cancer cell
Fig. 7 Conceptual schema. Chronic circadian disruption (CRD) alters two key aspects of tumour biology. It increases the proportion of cancer stem cells (CSCs, in dark blue) and modifies the tumour microenvironment (TME) through the recruitment of myeloid-derived suppressor cells (MDSCs, in yellow), resulting in a suppressive tumour immune microenvironment (TIME). At least one mechanism that could drive this process is an enhanced CXCL5-CXCR2 axis in the TIME. Collectively, these effects result in increased dissemination and metastasis in bone marrow and lungs. Inhibition of the CXCR2 axis is able to alleviate the effect of CRD and recover anti-tumour activity.