Debonding in Bi-layer Material Systems under Moisture Effect:
A Multiscale Approach
by
Tak Bun Denvid Lau B.Eng. Civil Engineering The University of Hong Kong, 2004
M.Phil. Structural Engineering The University of Hong Kong, 2006
S.M., Civil and Environmental Engineering
Massachusetts Institute of Technology, 2009
ARCHIVES
MASSACHUSETTS INSTTLUTE OF TECNOLOGY
L BRA R IES
SUBMITTED TO THE DEPARTMENT OF CIVIL & ENVIRONMENTAL ENGINEERING IN PARTIAL FULFILLMENT OF THE REQUIREMENTS FOR THE DEGREE OF
DOCTOR OF PHILOSOPHY IN THE FIELD OF STRUCTURES AND MATERIALS AT THE
MASSACHUSETTS INSTITUTE OF TECHNOLOGY JUNE 2012
@ Massachusetts Institute of Technology 2012. All rights reserved.
Signature of Author:
Departm te Civil and Environmental Engineering May 15, 2012
T
Certified by:
I,
Oral Bnynkoztnrk Professor of Civil and Environmental Engineering Thesis Supervisor
11 Accepted by:
He1i M.fepf Chair, Departmental Committee for Graduate Students
Debonding in Bi-layer Material Systems under Moisture Effect:
A Multiscale Approach
by
Tak Bun Denvid Lau
Submitted to the Department of Civil and Environmental Engineering on May 15, 2012 in Partial Fulfillment of the
Requirements for the Degree of Doctor of Philosophy in the Field of Structures and Materials
ABSTRACT
Bi-layer material systems are found in various engineering applications ranging from nano-scale components, such as thin films in circuit boards, to macro-scale structures such as adhesive bonding in aerospace and civil infrastructure applications. They are also found in many natural and biological materials such as nacre or bone. One of the most human-related applications of bi-layer material systems is the artificial tooth involving the bonding between the natural tooth and the metal cap glued with a polymer based material. The structural integrity of a bi-layer system depends on properties of both the interface and the constitutive materials. In particular, interfacial delamination has been observed as a major integrity issue. In this research, a comprehensive investigation on the interfacial debonding mechanism has been conducted both computationally and experimentally using an epoxy-silica system. In the computational approach, a multiscale model which can predict the intrinsic strength between organic and inorganic materials, based on a molecular dynamics simulation approach, is presented. The intrinsic strength between epoxy and silica derived from the molecular level can be used to predict the structural behavior of epoxy-silica interface at the macroscopic length-scale by invoking a finite element approach using a cohesive zone model developed in this research. In order to understand the moisture effect in a more comprehensive way, the free energy profile of the epoxy-silica bonded system describing the debonding process has been reconstructed for both dry and wet conditions and it is found that the adhesion between epoxy and silica, which is dominated by the van der Waals force and Coulombic interaction, can be weakened significantly (more than 68% reduction) in the presence of water. Experimental work involving two different approaches, namely "nanoindentation" and "superlayer" approaches, in characterizing the interfacial fracture toughness are presented and the advantages and disadvantages of these two approaches are discussed. The morphology of material in the vicinity of the interface has also been captured using the scanning electronic microscope (SEM). Experimental results show that the interface fracture energy decreases significantly after 4 weeks of moisture conditioning. Both the experimental and computational results show that water plays a main role in the interfacial deterioration. The mechanism of interfacial deterioration is explained using molecular dynamics simulation and a multiscale model of the epoxy-silica bonded system which is capable of predicting the macro-scale structural behavior based on the reconstructed free energy profile of the bonded system at the nano-scale. The multiscale modeling used in this research provides a powerful new approach to link nano-level to macro-level for complex material behavior.
Acknowledgement
In the process of preparing this thesis, there are many people supporting me, either directly or indirectly. I can only offer an inadequate acknowledgement of appreciation here. My special cordial thank goes to my thesis supervisor, Professor Oral Bniynik6ztnrk, for his guidance, friendship, encouragement, patience and support during my time at MIT. I am particularly grateful to him for providing me with the opportunities to be actively involved in different research projects and in various scholarly activities beyond a traditional graduate training such that I have developed a range of skills that will benefit me significantly for the time to come.
I thank my thesis committee members for their insights, availability and willingness to serve as my thesis committee members. In particular, I sincerely thank Professor Markus
J.
Buehler for bringing me into the research field of atomistic modeling with his guidance, encouragement and support, as well as widening my horizons in computational simulation. I would like to extend my appreciation to Professor John W. Hutchinson for providing me many contributing comments in the thesis meetings with his patience and encouragement, especially on the experimental part of my research. I would like to extend my gratitude to Professor David Roylance for his insight on the mechanics of polymer and his advice on modeling epoxy.I would like to thank Alan Schwartzman for his guidance in nanoindentation work. I would also like to express my appreciation to Kurt Broderick for his professionalism, kindness and help in the micro-fabrication process, SU-8 patterning and chromium coating. I thank my UROP students, Jose Cano, Reece Otsuka and Zheng Gong, for a fun working experience together.
I thank Croucher Foundation for providing me a scholarship which covered full tuition and living expenses of my first three years of studies. The research work reported in this thesis was supported by the National Science Foundation (NSF) through Grant No. CMS 0856325.
I would like to show my gratitude to all my friends and colleagues for their friendship and support over years with special acknowledgements to the two talented individuals Tzu-Yang Yu and Chakrapan Tuakta who have been very good friends of mine, and have given me insights in both research and life. My gratitude goes to Boston Chinese Evangelical Church, my spiritual home here in Boston; the Joshua I fellowship, and all my brothers and sisters in Christ. This is the place where I have grown spiritually the most. They have all provided me mental and spiritual support these years, especially during those most stressful times. Also, I would like to give special thank to my best friends, Hing Chung Fung, Marcos and Raymond Lam, for their support and accompany in these years. I cannot even imagine living without them during the time in Boston. Thank you for showing your great minds and talents, yet
Here, I want to say an honorable thank you to my parents, Jimmy and Candy Lau, for bringing me up. They have given me the most time, effort, guidance, care and support throughout the first twenty years of my life, and I acknowledge the many great biblical values they have implanted in me. Also, I will always have my appreciation and love to my younger sister, Ivy Lau, who has been very supportive throughout these years.
I would like to express my deepest gratitude to the love of my life, Joey Ngai, for her prayer, encouragement and continuous support. Without her sacrifice and tenacity,
I would never have had such an enjoyable experience at MIT. I am so grateful for
having someone like her who is willing to run this race with me. I dedicated this book to her as a diminutive way of saying "thank you".
Last but my most heartfelt thanks to my Lord! Thank you for giving me the chance to come across all these people in my life. Thank you for showering upon me the tremendous amounts of blessings all along, more than I could ever count or notice. But most importantly, thank you for granting me difficulties and struggles throughout the time at MIT, you made me realize how small a person I am but how great the God you are. Thank you Lord and I believe you have made me a finer person, more prepared and equipped now for the many challenges ahead.
Denvid Lau
Cambridge, Massachusetts 2012
Contents
TITLE PAGE ABSTRACT ACKNOW LEDGEMENT ... 4 CONTENTS ... 6 LIST OF FIGURES...8 LIST OF TABLES...13 CHAPTER 1: INTRODUCTION...14 1.1 BACKG RO UN D ... 141.1.1 DEBONDING OF BI-LAYERED MATERIAL SYSTEM ... 14
1.1.2 MOLECULAR DYNAMICS SIMULATIONS... 16
1.1.3 MULTISCALE MODELING ... 20
1.2 RESEARCH OBJECTIVE... 21
1.3 RESEARCH APPROACH ... 21
1.4 THESIS ORGANIZATION... 22
CHAPTER 2: MOLECULAR DYNAMICS SIMULATIONS FOR STRUCTURAL ENGINEERING PROBLEM ... 23
2.1 MOLECULAR DYNAMICS SIMULATION OF EPOXY-SILICA INTERFACE ... 23
2.2 SUMMARY COMMENTS... 30
CHAPTER 3: INTRINSIC STRENGTH OF EPOXY-SILICA INTERFACE ... 31
3.1 IN TRO DUCTIO N ... 31
3.2 MATERIALS AND METHODS... 33
3.2.1 METADYNAMICS ANALYSIS FOR ADHESION ENERGY OF A SINGLE EPOXY CHAIN... 34
3.2.2 WORM-LIKE-CHAIN (WLC) BASED FRACTURE MODEL... 37
3.2.3 U PSCA LIN G ... 38
3.3 RESULTS AND DISCUSSION ... 39
3.4 SUMMARY COMMENTS... 44
CHAPTER 4: EXPERIMENTAL VERIFICATION: NANO-SCALE...45
4.1 BACKGROUND ON NANOINDENTATION... 45
4.2 MATERIALS AND METHODS ... 48
4.3 PROCEDURE OF NANOINDENTATION USING HYSITRON TRIBOINDENTER... 50
4.4 RESULTS AND DISCUSSIONS ... 52
4.5 CHARACTERIZING INTERFACE FRACTURE TOUGHNESS USING NANOINDENTATION A PPRO A CH ... 55
5.1 BACKGROUND ON THE CHARACTERIZATION OF INTERFACIAL FRACTURE ENERGY ... 60
5.2 M A TERIA LS ... 62
5.3 PROCEDURE OF SUPERLAYER TEST... 62
5.4 M EASUREMENT OF RESIDUAL STRESS... 66
5.5 CALCULATION OF INTERFACE FRACTURE ENERGY ... 67
5.6 SUM MARY COMMENTS... 72
CHAPTER 6: MULTISCALE ANALYSIS...74
6.1 BACKGROUND ON THE MULTISCALE MODELING APPROACH... 74
6.2 COHESIVE ZONE M ODEL... 74
6.3 DERIVATION OF TRACTION-SEPARATION RELATION... 76
6.4 SUM M ARY COMMENTS... 80
CHAPTER 7: SUMMARY, CONCLUSIONS AND FUTURE WORK...82
7.1 SU M M A RY ... 82
7.2 C O N CLUSIO N S ... 83
7.3 FUTURE W O RK ... 84
7.3.1 MESO-SCALE COUPLED STRESS-DIFFUSION ... 84
7.3.2 ATOMISTIC MODEL DESCRIBING CONCRETE... 85
7.3.3 FINITE ELEMENT MODELING COUPLED WITH MOLECULAR DYNAMICS... 85
REFER EN CES...88
APPENDIX A: CVFF PARAMETERS...98
APPENDIX B: SAMPLE SCRIPT OF ATOM DEFINITION IN LAMMPS...100
APPENDIX C: SAMPLE INPUT SCRIPT FOR LAMMPS...103
List of Figures
FIG 1.1 TYPICAL FAILURE MODES OF FRP-RETROFITTED REINFORCED CONCRETE BEAM
(BOYI3KOZTORK ET AL. 2004) ... 15
FIG 1.2 (A) PLASTICIZATION OF EPOXY-PENETRATED CONCRETE LAYER, (B) WEAKENING OF BOND BETWEEN EPOXY AND CONCRETE ... 16
FIG 1.3 NUMERICAL APPROACH OF MOLECULAR DYNAMICS SIMULATION ... 17
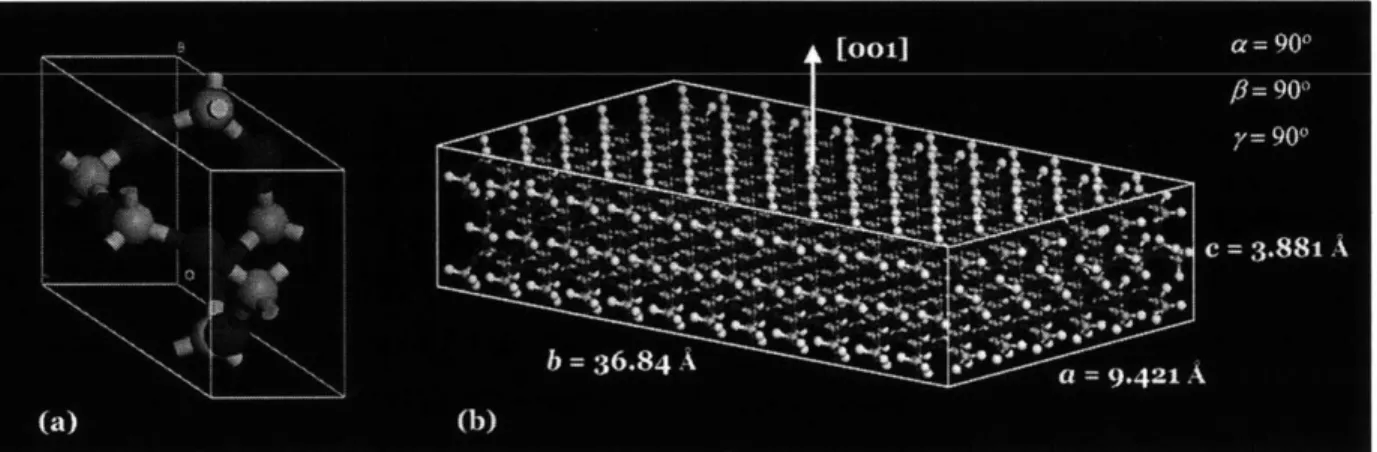
FIG 2.1 (A) UNIT CELL OF S10 2, (B) ATOMISTIC MODEL OF S102 SUBSTRATE ... 23
FIG 2.2 MOLECULAR STRUCTURE AND CHEMICAL FORMULA OF DGEBA WITH N=5 ... 23
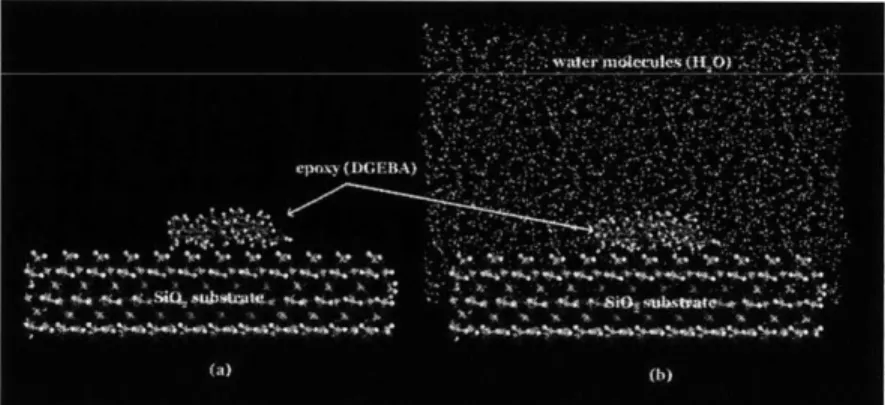
FIG 2.3 (A) SIMULATION MODEL FOR DRY CASE, (B) SIMULATION MODEL FOR WET CASE ... 24
FIG 2.4 MAJOR POTENTIAL TERMS IN THE CVFF USED HERE, APPLIED TO DESCRIBE THE SILICA SUBSTRATE, EPOXY CHAIN AND WATER ... 25
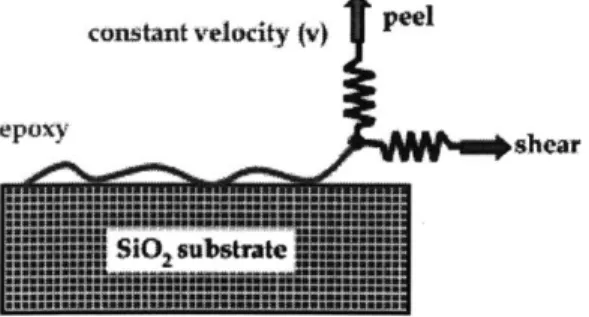
FIG 2.5 SCHEMATIC DIAGRAM OF THE COMPUTATIONAL EXPERIMENTS FOR BOTH PEEL AND SHEAR LOADING ... 26
FIG 2.6 SCHEMATIC DIAGRAM OF THE ENERGY PROFILE ... 27
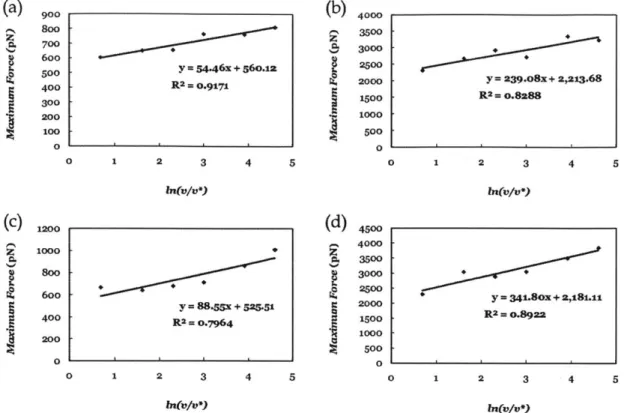
FIG 2.7 MAXIMUM FORCE AS A FUNCTION OF VARYING PULLING SPEED UNDER (A) PEEL AND DRY CONDITIONS, (B) PEEL AND WET CONDITIONS, (C) SHEAR AND DRY CONDITIONS, AND (D) SHEAR AND W ET CONDITIONS. ... 29
FIG 2.8 SUMMARY OF THE DIFFERENCE BETWEEN PEEL AND SHEAR LOADING CASES UNDER BOTH DRY AND WET CONDITIONS. THIS RESULT IMPLIES THAT ADHESION BETWEEN SILICA AND EPOXY IS WEAKENED BY ABOUT 15% IN THE PRESENCE OF WATER. ... 29
FIG 2.9 SNAPSHOTS OF THE MD SIMULATION IN WET CONDITION ... 30
FIG 3.1 THE CONTINUUM EPOXY-SILICA INTERFACE CAN BE REPRESENTED BY A DISCRETE GRID MODEL WHEN THE LENGTH SCALE GOES DOWN TO NANO-SCALE. THE ADHESION BETWEEN EACH EPOXY CHAIN AND THE SILICA SUBSTRATE CAN BE REPRESENTED BY THE WLC FRACTURE MODEL. THE PROPOSED MULTISCALE ANALYSIS IS TO DELIVER THE MECHANICAL PROPERTIES DERIVED IN THE WLC FRACTURE MODEL TO THE CONTINUUM MACROSCALE THROUGH THE IMPLEMENTATION OF A FINITE ELEMENT ANALYSIS. ... 32
FIG 3.2 (A) ATOMISTIC MODEL OF THE SILICA SUBSTRATE IN WHICH THE SURFACE IS CLEAVED IN [0 0 1] CRYSTALLOGRAPHIC PLANE, (B) THE EPOXY CHAIN WITH ONLY ONE REPEATING UNIT, (C) THE EPOXY CHAIN IS MOVED MANUALLY ONTO THE SILICA SUBSTRATE BEFORE CARRYING OUT THE SIMULATION. ... 34
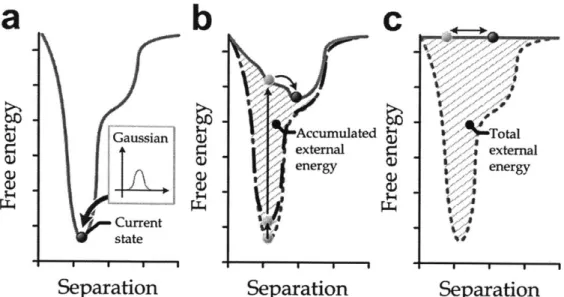
FIG 3.3 (A) GAUSSIANS ARE CONTINUOUSLY ADDED TO THE MOLECULAR SYSTEM, (B)
BECAUSE OF THE ADDITIONAL EXTERNAL ENERGY SOURCE, THE FREE ENERGY PROFILE OF THE
BE RECONSTRUCTED BY THE PROFILE OF EXTERNAL ENERGY APPLIED DURING THE PROCESS. 36
FIG 3.4 (A) SCHEMATIC DIAGRAM SHOWING THE DEFINITION OF CV IN EPOXY-SILICA SYSTEM, (B) IT SHOWS THE CONVERGENCE OF THE FREE ENERGY SURFACE IN THE
EPOXY-SILICA-SYSTEM UNDER DIFFERENT PROCESSING TIMES. THE SURFACE ENERGY OF THE EPOXY-SILICA-SYSTEM CAN BE
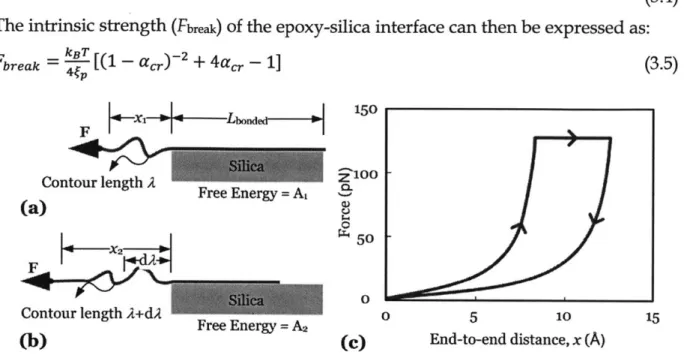
CALCULATED BY TAKEN THE ENERGY DIFFERENCE BETWEEN THE ATTACHED AND DETACHED STA G ES. ... 36 FIG 3.5 (A) SINGLE CHAIN EPOXY WITH A LENGTH LBONDED BONDED WITH THE SILICA
SUBSTRATE BY A CONTINUOUS VAN DER WAALS AND COLUMBIC INTERACTIONS IS STRAINED AT THE FREE END UNDER A CONSTANT FORCE F, (B) AT THE ONSET OF RUPTURE, THE
CONTOUR LENGTH INCREASES DUE TO THE DETACHMENT OF A PIECE OF CHAIN, (C) QUALITATIVE DESCRIPTION OF THE FORCE-DISPLACEMENT BEHAVIOR BEFORE AND AFTER DEBONDING, WITH AN ILLUSTRATION OF THE DISSIPATION ENERGY. IT IS NOTED THAT THE
MODEL DOES NOT REQUIRE THE APPLIED FORCE TO BE IN THE SHEAR DIRECTION AS SHOWN IN
PANELS (A) AND (B). IN FACT, IT IS VALID FOR OTHER LOADING ANGLES (SHEAR, TEAR, OR
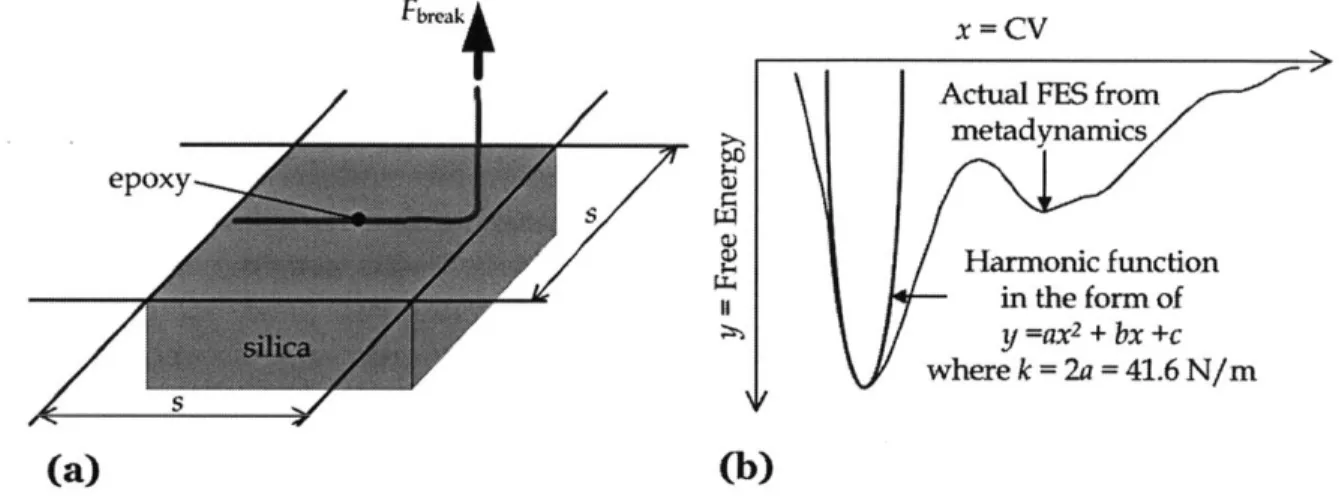
MIXED) AS WE ONLY CONSIDER THE FREE ENERGY CHANGE IN THE OVERHANG OF THE EPOXY CH A IN . ... 38 FIG 3.6 (A) THE DERIVATION OF THE MAXIMUM STRESS IN THE TRACTION-SEPARATION
RELATION FOR THE EPOXY-SILICA INTERFACE BY CONSIDERING THE TRIBUTARY AREA (S X S) FOR A SINGLE EPOXY CHAIN, (B) THE PREDICTION OF K BY CURVE FITTING FROM THE
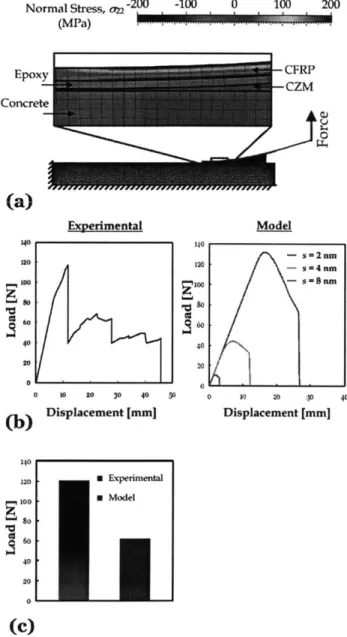
MOLECULAR DYNAMICS DATA VIA A HARMONIC FUNCTION. ... 40 FIG 3.7 CONFIGURATION OF THE INTERFACE FRACTURE SPECIMEN THAT ARE TESTED BY
APPLYING A PEEL LOAD AT THE END OF THE CFRP STRIP. ... 41 FIG 3.8 (A) THE STRESS (Xxy) DISTRIBUTION OF THE SPECIMEN AT THE PEAK OF THE LOAD-DISPLACEMENT CURVE. SEPARATION BETWEEN EPOXY AND THE SUBSTRATE CAN BE
CAPTURED BY THE DEFORMATION OF THE COHESIVE ELEMENT AS SHOWN IN THE CLOSE-UP, (B)
THE LOAD-DISPLACEMENT CURVES FROM THE PREDICTIVE MODEL AND EXPERIMENT ARE
SHOWN. THE PEAK OF THE LOAD-DISPLACEMENT CURVE FROM THE EXPERIMENT IS CLOSE TO
THE PREDICTION WHEN S= 2 NM WHICH IS A REASONABLE DISTANCE BETWEEN ADJACENT CROSSLINKS FOR A FULLY CURED EPOXY. THE GOOD AGREEMENT BETWEEN OUR PREDICTION
AND THE EXPERIMENTAL RESULT IMPLIES THAT OUR MULTISCALE MODEL OF INTERFACE CAN
PROVIDE A REASONABLE ESTIMATE OF THE GLOBAL STRUCTURAL BEHAVIOR OF THE EPOXY-SILICA INTERFACE, (C) A QUANTITATIVE COMPARISON OF BETWEEN THE MAXIMUM LOAD
MEASURED FROM THE EXPERIMENT AND THE PREDICTED AVERAGE PEAK LOAD BASED ON THE
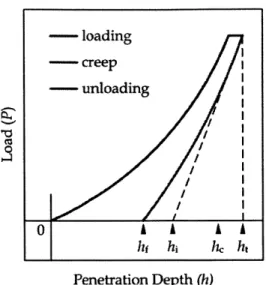
THREE CHOSEN S VALUES IS SHOWN USING A BAR PLOT. ... 42 FIG 4.1 TYPICAL P-H CURVE MEASURED FROM THE NANOINDENTATION IN FUSED SILICA .... 46 FIG 4.2 SCHEMATIC CROSS-SECTION OF INDENTATION (A) AT MAXIMUM LOAD AND (B) AFTER
COM PLETE UNLOADING ... 47 FIG 4.3 SAMPLE OF FUSED SILICA ... 49
FIG 4.5 SPIN COATER ... 50
FIG 4.6 LABORATORY OVEN ... 50 FIG 4.7 HYSITRON TRIBOINDENTER (A) MACHINE OUTLOOK, (B) OPTICS AS CIRCLED IN RED, (C) NANOINDENTER AS CIRCLED IN RED ... 50
FIG 4.8 FUSED SILICA SAMPLE MOUNTED ON A STAINLESS STEEL PLATE ... 52
FIG 4.9 P-H CURVES FOR FUSED SILICA UNDER DIFFERENT LOADING RATE RANGING FROM 20
piN /S TO 2,000 tN /S ... 53
FIG 4.10 EPOXY BASED POLYMER, SU-8, UNDER OPTICAL MICROSCOPE ... 54
FIG 4.11 P-H CURVES FOR NANOINDENTATION IN SU-8: (A) DRY CONDITION (B) WET
CONDITION (2 WEEK MOISTURE CONDITIONING) ... 54
FIG 4.12 HISTOGRAMS SHOWING THE RELATIONSHIP OF YOUNG'S MODULUS AND HARDNESS WITH RESPECT TO THE DURATION OF MOISTURE CONDITIONING, UNDER THREE DIFFERENT LOADING RATES: (A) 20 ptN/S, (B) 200 p.N/S AND (C) 2,000 tN/S...55
FIG 4.13 TYPICAL P-H CURVE SHOWS THE DETAILS OF THE CRACKING AND DELAMINATION
AREA (ETIENNE-CALAS ET AL. 2004). ... 56
FIG 4.14 SCHEMATIC DIAGRAM SHOWING THE SINGLE BUCKLING AND DOUBLE BUCKLING DURING NANOINDENTATION (VOLINSKY ET AL. 2002) ... 57 FIG 4.15 RELATIONSHIP BETWEEN DISSIPATED ENERGY AND THE MAXIMUM LOAD RECORDED
DURING NANOINDENTATION (ETIENNE-CALAS ET AL. 2004) ... 58
FIG 4.16 P-H CURVES FOR NANOINDENTATION AT THE INTERFACE BETWEEN SU-8 AND FUSED SILICA WITH DIFFERENT LOADING RATE: (A) 50 pN/S, (B) 500 p.N/S AND (C) 5,000 pN/S ...59
FIG 5.1 TYPICAL SILICON WAFER WITH THERMAL OXIDE LAYER THAT CRYSTALLINE
ORIENTATION [1 0 0] ... 62 FIG 5.2 EQUIPMENT AT MTL: (A) MECHANICAL SURFACE PROFILOMETER, DEKTAK 150, (B) SEM, A JOEL/ NIKON NEOSCOPE JCM-5000 ... 63
FIG 5.3 (A) AU PATTERN ON SI WAFER WITH A LAYER OF THERMAL OXIDE (0.9NM), (B) SU-8
WAS SPIN-COATED ON THE WAFER WITH A THICKNESS 20 - M, (C) CR WAS DEPOSITED ONTO THE SU-8 SURFACE BY THE SPUTTERER. THE RESIDUAL TENSILE STRESS IN CR LEADS TO THE CRACK INITIATION AT THE SU8-SIO2 INTERFACE WHEN THE CRITICAL CR THICKNESS IS A CH IEVED . ... 64 FIG 5.4 (A) TRANSPARENCY MASK FOR AU PATTERN WITH THREE 1 MM WIDE VERTICAL BLACK STRIPS, (B) TRANSPARENCY MASK FOR SU-8 PATTERN WITH 0.5 MM WIDE BLACK DARKER LINES AND 0.2 MM WIDE BLACK LIGHTER LINES. THE DIAMETER OF BOTH
TRANSPARENCIES IS 152.4 MM. THE WAFER WAS BROKEN INTO 21 SMALLER PIECES WHICH WERE THEN COATED BY CHROMIUM. THE RECTANGULAR BOX WITH RED DASH LINE
FIG 5.5 (A) CHAMBER OF THE SPUTTER, (B) CONTROL PANEL OF THE SPUTTER ... 65 FIG 5.7 A PLOT OF THE TOTAL FILM STRESS WITH THE NORMALIZED CR LAYER THICKNESS .. 67 FIG 5.8 A SCHEMATIC DIAGRAM SHOWING THE ENERGY BALANCE APPROACH TO FIND THE STRAIN ENERGY RELEASE RATE FOR A BI-LAYER THIN FILM SYSTEM (BAGCHI ET AL. 1994) .... 68
FIG 5.9 A SCHEMATIC DIAGRAM SHOWING THE DEFORMATION OF A BI-LAYER THIN FILM SYSTEM WHEN SUBJECTED TO RESIDUAL TENSILE STRESSES, RESULTING IN INTERFACIAL
DEBONDING. THE STRESSES E1 AND Z2 (A) ARE THE MISFIT STRESSES IN THE CR (SUBSCRIPT I=1) AND SU-8 (SUBSCRIPT i=2), WHICH PROVIDE THE FORCES, P1, AND THE MOMENTS, M, IN THE
BI-LAYER THIN FILM SYSTEM ABOVE THE DECOHESION. THE CURVATURE OF THE DEBONDED BI-LAYER THIN FILM IS K (BAGCHI ET AL. 1994). ... 69
FIG 5.10 A PLOT OF THE CALCULATED ENERGY RELEASE RATES WITH THE NORMALIZED CR LAYER THICKNESS. THE RED LINES SHOW THE LOWER AND UPPER BOUNDS THAT THE
CRITICAL ENERGY RELEASE RATE OF EPOXY-SILICA BONDED SYSTEM IN DRY CONDITION. ... 71
FIG 5.11 A PLOT OF THE CALCULATED ENERGY RELEASE RATES WITH THE NORMALIZED CR
LAYER THICKNESS. THE BLUE LINES SHOW THE UPPER BOUND THAT THE CRITICAL ENERGY
RELEASE RATE OF EPOXY-SILICA BONDED SYSTEM AFTER 4 WEEK MOISTURE CONDITIONING. 71 FIG 5.12 SCANNING ELECTRON MICROSCOPY (SEM) OF THE EPOXY-SILICA BONDED SYSTEM
WITH CR SUPERLAYER. (A) INTERFACIAL DEBONDING WAS OBSERVED WHEN THE CR
THICKNESS iS 3 FtM, (B) A CROSS SECTION OF THE SPECIMEN WITH 3 piM THICK CR SUPERLAYER, (C) A SEM WAS TAKEN WITH A MAGNIFICATION x3,500 AT THE VICINITY OF THE
INTERFACIAL CRACK TIP WAS TAKEN, (D) A MORE DETAILED SEM WITH MAGNIFICATION
x10,000 WAS TAKEN AT THE DEBONDING SURFACES. IT IS NOTICED THAT THE INTERFACIAL
CRACK DOES NOT SEPARATE SU-8 AND SILICA IN A CLEAN MANNER; INSTEAD THE
INTERFACIAL CRACK PROPAGATES IN A RANDOM ZIGZAG PATH INSIDE THE SU-8 LAYER AND
REMAINS CLOSELY TO THE INTERFACE. SUCH PHENOMENON IS OBSERVED FOR BOTH DRY AND W ET SPECIM EN S. ... 72 FIG 6.1 FRACTURE PROCESS ZONE AHEAD OF A CRACK TIP ... 75
FIG 6.2 ELASTIC TRACTION-SEPARATION LAW WITH LINEAR DAMAGE EVOLUTION ... 76 FIG 6.3 THE RECONSTRUCTED FES FOR BOTH DRY AND WET CASES USING METADYNAMICS
APPROACH (LAIO AND PARRINELLO 2002; LAIO AND GERVASIO 2008). THE MINIMUM POINT IN THE FES IS THE EQUILIBRIUM STATE OF THE EPOXY-SILICA BONDED SYSTEM REFERRING TO
THE ATTACHED STAGE. A 68% REDUCTION IN TERM OF THE FREE ENERGY IS RECORDED. THIS FREE ENERGY DIFFERENCE INDICATES THAT THE EPOXY-SILICA BONDED SYSTEM IS MUCH MORE VULNERABLE AGAINST THE DEBONDING PROCESS BECAUSE THE ENERGY BARRIER
BETWEEN THE ATTACHED AND THE DETACHED STATES REDUCES SIGNIFICANTLY AS SHOWN
IN THE RECONSTRUCTED FES. ... 79
FIG 6.4 ILLUSTRATION OF THE PROCESS OF USING MD SIMULATION (LEFT) TO DETERMINE
THE FREE ENERGY LANDSCAPE (CENTER) USING ADVANCED MD METHODS SUCH AS
FES), TO IDENTIFY THE TRACTION-SEPARATION RELATION THAT CAN BE DIRECTLY FIT TO CONTINUUM CZM MODELS. ... 79 FIG 6.5 THE LOAD-DISPLACEMENT CURVES OF FRP-EPOXY-SILICA SYSTEM FOR BOTH DRY AND WET CASES. THERE IS SEVERE DETERIORATION DUE TO THE PRESENCE OF WATER. BOTH
THE STIFFNESS AND THE MAXIMUM LOAD CAPACITY IN SUCH BONDED SYSTEM REDUCE
SIGNIFICANTLY UNDER THE EFFECT OF MOISTURE. ... 80 FIG 6.6 THE TRACTION-SEPARATION RELATION CAN BE OBTAINED BY CONSIDERING THE 1ST DERIVATIVE OF THE FES WITH RESPECT TO THE INTERFACE SEPARATION (6). ... 80 FIG 7.1 MULTISCALE SIMULATION INVOLVING QM, REAxFF, MD SIMULATION AND FINITE ELEM ENT M ODELING ... 85 FIG 7.2 ATOMISTIC AND CONTINUUM APPROACHES CONNECTED IN THE HAND-SHAKING
List of Tables
TABLE 3.1 PREDICTIONS OF THE MATERIAL PROPERTIES AT EPOXY-SILICA INTERFACE ... 43 TABLE 4.1 SUMMARY OF THE YOUNG'S MODULUS AND THE HARDNESS FOR BOTH DRY (0
WEEK) AND WET (2 WEEK) SU-8 SAMPLES ... 55 TABLE 5.1 SUMMARY OF ADHESION TESTS ... 60
Chapter
1Introduction
1.1 Background
1.1.1 Debonding of bi-layered material system
An earlier development of molecular dynamics simulation was reported in 1957 (Alder and Wainwright 1957) for a study on the dynamics of a hard sphere system consisting of several hundreds of particles. Since then, advancement of molecular dynamics simulation has been observed with the evolution of computational power in the last few decades. Molecular dynamics simulation represents a powerful tool for potential applications in various research fields including physics, chemistry, biology, bio-engineering and medicine (Allen and Tildesley 1989; Rapaport 1997). Recently, efforts have been made for applying the method to structural mechanics and engineering. Traditionally, the classical continuum mechanics theories have been the basis for most computational methods used in various engineering fields including civil and mechanical engineering; examples are finite elements, finite difference, finite volume and boundary element methods. The capability of the continuum approach is limited when structural solution at a small length scale is of concern, or if predictions
about material behavior should be made from a fundamental bottom-up perspective. Molecular dynamics simulation is based on modeling at atomistic level when the discrete nature of the matter at that level is explicitly considered. In an atomistic model the atomic distance provides a natural measure for the spatial discretization. The smallest unit in the atomistic model is an atom; the motion of each in the material is modeled over the course of a simulation time span. Collective behavior of the atoms allows one to understand how the material undergoes structural deformation. Atomistic models provide a fundamental chemistry-based description of material properties and processes, and molecular dynamics simulation is capable of solving the dynamic evolution of equilibrium and non-equilibrium processes. Thus, a particular and detailed insight into the physics of fundamental processes can be obtained. The atomistic approach has been shown to be powerful in obtaining solutions for small scale structural mechanics problems such as, localized fracture processes in materials (see, for example (Buehler and Ackbarow 2007) and references therein).
Study of organic-inorganic interfaces for various applications has been of interest to numerous researchers. Development of molecular dynamics simulation based on the atomic and molecular motions has offered opportunities for the application of the method to interface problems. The study of organic-inorganic interfaces using molecular dynamics was mainly carried out in the fields of biological and chemical engineering since the early 1990's (Galema et al. 1994; Sprous et al. 1999) but typically
methods and capabilities, application can now be extended to structural mechanics and engineering problems. An example of organic-inorganic interface in structural engineering is the layered bonded material systems. Deterioration and debonding of interfaces in a multi-layer material system is of concern since such failures at local regions might lead to a system or structural failure. One example is the possible premature failure of reinforced concrete (RC) structural elements strengthened by fiber reinforced polymer (FRP) after prolonged exposure to moisture affecting the FRP/concrete interface. In practice, FRP-strengthening system for a RC beam is typically designed such that failure occurs in the form of either steel reinforcement yielding followed by concrete crushing, or FRP rupture, providing early warning when the load capacity is exceeded (ACI440.2R-08 2008). However, when the interface becomes weak, failure can occur in the form of delamination in a tri-layer material system formed by the FRP, epoxy adhesive (organic), and the concrete material (inorganic) at various critical locations along the beam soffit, leading to a significantly lower load capacity of the FRP-retrofitted system. Fig. 1.1 shows possible debonding configurations in a FRP-retrofitted reinforced concrete beam.
Shear Flexural
reinforcement reinforcement
Cn nretjever
S
delaina*ionFRP
debonding t. Plate end debonding 2. Flexure-dominated debonding
3. Flexure-shear debonding
Fig 1.1 Typical failure modes of FRP-retrofitted reinforced concrete beam (Bnyik6zturk et al. 2004)
When a strengthened RC beam is loaded to failure, cracks can initiate and propagate in different interfaces and material locations depending on loading configuration, and mechanical properties of the constituent materials and the interfaces. In general, crack can either propagate in bulk materials (material decohesion) or along the interfaces (interface separation). Reported empirical and analytical formulae available to predict interfacial fracture behavior include crack kinking by energy release rate (Hutchinson and Suo 1992; Nishioka et al. 2003), crack kinking by maximum hoop stress (Yuuki and Xu 1992), and crack kinking by zero complex stress intensity factor,
Krl (Akisanya and Fleck 1992).
However, these criteria may not fully explain the interface fracture behavior involving complex material interaction when the interface is under moisture attack. Knowledge on the debonding behavior of FRP-concrete bonded systems under the effect of moisture is crucial in predicting the service-life and improving the safety of civil structures strengthened using this technique. Interface fracture tests were conducted on tri-layer specimens consisting of carbon FRP, epoxy adhesive, and
concrete (Au and BUyuk6ztnrk 2006a; Au and BiynkOztnrk 2006b; Lau and Buyuk6ztnirk 2010). The specimens were loaded under displacement control in peel and shear loading configurations separately. Effect of moisture on bond strength was studied by conditioning specimens in various moisture levels at room and elevated temperatures. It was found that the presence of moisture may significantly decrease fracture toughness of the tri-layer material system. Furthermore, for both peel and shear loadings, while the dry specimens failed by concrete delamination, in all cases the wet specimens failed by epoxy/concrete interface separation. Using material properties (Young's modulus and Poisson's ratio) from material characterization test program, the crack kinking criterion could well predict crack propagation observed in the dry specimens. However, these criteria failed to explain the decrease in strength and shift in failure mode observed in wet specimens, in which interaction at the material level between water, epoxy, and concrete may have occurred in the bulk material and at the interface. The two possible explanations may be that, first, there may be a toughened epoxy-penetrated concrete layer in the vicinity of the interface under moist environment (Fig. 1.2a). As a result, the initial crack at the interface between concrete and epoxy may not propagate into concrete due to this toughened top concrete layer staying at the interface instead. Second, the adhesive force at the interface may be weakened due to interaction between epoxy and water (Fig. 1.2b). The initial crack, therefore, may stay at the interface which requires less energy for crack propagation. There is a need to study the debonding mechanism of the interface under the presence of water molecules using a more fundamental approach. Atomistic modeling approach employing molecular dynamics simulation may be used as a basis for a fundamental study.
(a)
(b)
Pymer network
H.P molecule Bond destroyed by
,Omolecules
Intact bond
betweenEpx
& substrate
susubsrat
Fig 1.2 (a) Plasticization of epoxy-penetrated concrete layer, (b) weakening of bond between epoxy
and concrete
the molecular behavior of different substances (Allen and Tildesley 1989; Rapaport 1997; Fermeglia et al. 2003; Shevade et al. 2003; Fermeglia et al. 2004; Gardebien et al. 2004; Minisini and Tsobnang 2005). The modeling process involves several key steps, namely,
(1) construction of the atomistic geometry; (2) definition of atomic interaction; (3)
governing equations for the system; (4) initialization and energy minimization; (5) conditions of simulation; (6) integration scheme and (7) calculation of concerned properties. These steps are incorporated in the flowchart of the numerical approach
shown in Fig. 1.3.
The first step in molecular dynamics simulation is an accurate construction of the atomistic geometry which refers to a clear definition of the atomic location, the element type (i.e. the atomic mass and associated chemical properties) and the partial charge of each atom, the bond connectivity among all atoms and the boundary conditions. This information is required for evaluating the inter-atomic interactions that describe the chemical properties. With this approach, determination of the system energy is critical throughout the simulation process, and force fields (potentials) play an important role in the accuracy of the computer modeling studies by proper description of the interaction among atoms (Lewis and Catlow 1985). There are a number of force fields available in the literature for different types of interactions among atoms (Allen and Tildesley 1989; Rapaport 1997; Buehler 2008). The choice of force field is left to the discretion of the user, based purely on the knowledge of nature of forces acting between atoms for the specific material. The potential should be chosen in such a way that it mimics the nature of atomic interactions in a realistic or appropriate way, given a particular application of the model. There are different kinds of chemical bonds that exist in different substances for holding the material together; namely, ionic bonds, covalent bonds, metallic bonds, hydrogen bonds and van der Waals bonds. Each type of bond has varied strengths.
Setup to Calulate forces
model Analyze data
Define Initial Update atomic
atomic position position and Output results
and velocity velIt
I
I~
i
I
Define yes no
forcefield y t<t.
|
I
.I
I
Initialization Simulation
I
Post-processingL - - - - . L L
Fig 1.3 Numerical approach of molecular dynamics simulation
Molecular dynamics methods rely on Newton's second law of classical mechanics, which is given by
Fi= miai (1.1)
where Fi is the force acting on an atom, mi is the mass of the atom, and ai is the acceleration of the atom. The total potential energy of the system is determined by summing up the potential energy associated with all bonded and non-bonded interactions. The total potential energy (U) is expressed as U = Ubond + Unonbond, where Uond refers to the potential energy of the bonded atoms and Unonbond refers to the potential energy of the non-bonded atoms. The force (Fi) acting between a pair of atoms is determined by evaluating the negative gradient of the potential energy with respect to the separation distance (rij). This is given by Fi = -&U/arij. The net force acting on an
atom 'i' is calculated by summing up the interactions between atom 'i' and the surrounding atoms 'j'. Once the net force is known, the acceleration of the individual atom can be determined using Eq. (1.1) as the atomic mass has been defined previously during the construction of the atomistic model. Finally, velocities and positions can be obtained by numerical integration of the equations of motion, given that their initial values are known.
Before conducting the computational experiment, initialization and energy minimization should be carried out. Similar to the process of solving a partial differential equation in continuum mechanics, for example, initial conditions are necessary for a defined solution. Initial positions of all the atoms are defined by the coordinates of the corresponding atoms in the simulation cell. Here, simulation cell refers to a space in which simulation takes place. The total potential energy of the system (U) can be calculated as U is a function of the current atomic positions. The entire system is then subjected to a minimization of potential energy by varying the atomic position. The new atomic positions after energy minimization is used in the subsequent computational experiment as these positions refer to the most stable structure in the concerned domain. It should be mentioned that the energy minimization is carried out under absolute zero temperature which means the kinetic energy is zero as well.
After the stages of initialization and energy minimization, the constraints of the simulation are defined. The purpose of applying these constraints is to control the simulation process such that the computational experiment can be accurately performed; this is similar to the concept of applying boundary conditions in a finite element analysis. Here, the concept of "ensemble" is introduced, which is a probability measure on the set of all possible microscopic configurations that are consistent with the macroscopic state of the system. The microscopic state of a system is defined by the atomic positions and momenta which constitute the coordinates in a multidimensional imaginary space called "phase space". For a system of N particles, this space has 6N dimensions as each particle is associated with three position variables and three momentum variables. A single point in phase space represents the state of a system. A molecular dynamics simulation generates a collection of points in phase space as a
computation, it is necessary to fix the type of ensemble that the system is desired to perform during the computation experiment, just like when finite element analysis is being performed the boundary conditions need to be defined at the beginning of the analysis. There are three commonly used ensembles in molecular dynamics: (1) micro-canonical (NVE), where the number of atoms (N), the volume (V) and the energy (E) of the system are kept constant; (2) canonical (NVT) where, the number of atoms (N), the volume (V) and the temperature (T) of the system are constant; (3) Gibb's ensemble (NPT), where, the number of atoms (N), the pressure (P) and the temperature (T) of the system are maintained constant. Depending on the type of ensemble used, a thermostat or barostat need to be chosen for the molecular dynamics simulations. Generally, thermostats are intended to control the temperature of the system. Some of the popular barostats used to control the pressure of the system (NPT) are Berendsen and Nose-Hoover barostat (Allen and Tildesley 1989; Rapaport 1997). It should be mentioned that macroscopic quantities are always related to their associated microscopic quantities. For instance, temperature (T) is a macroscopic quantity and its associated microscopic quantity is the atomic velocity (v). Their relationship can be established by considering the kinetic energy stored in the system macroscopically and microscopically, and given
by the following equation:
3kBT = I mv,2 (1.2)
2 N, 2
where kB is the Boltzmann constant and mi is the mass of the ih atom. The left hand side of Eq. (1.2) describes the kinetic energy of the system from a macroscopic point of view using the quantity T, while the right hand side of Eq. (1.2) describes the kinetic energy of the system from a microscopic point of view using the quantity v.
As mentioned earlier, the fundamental equation governing the molecular motion is the Newton's second law. In the simulation process, integration of this governing equation must be carried out. There are several numerical algorithms for integrating Eq.
(1.1) using finite difference methods. A relatively simple algorithm called Verlet
algorithm is discussed in this thesis. Besides Verlet algotithm, the velocity-Verlet algorithm and the leapfrog-Verlet or the r-RESPA integration schemes are also widely used for implementation. The Verlet algorithm is one of the commonly used methods in molecular dynamics simulation and is described as,
r,(to + At)= 2r,(to)-r,(to - At)+a,(to)At2 (1.3)
where ri(to) is the position vector at time to, ri(to-At) is the position vector at time to-At, and ai(to) is the acceleration vector at time to. This representation assumes that the atomic positions, velocities and accelerations can be approximated by a Taylor series expansion and uses the positions and accelerations at time to, and the positions from previous time step at time to-At to calculate the new positions at the next time step at time to+At. Hence, once the initial conditions in terms of atomic position in the system, as well as a well-defined force field which is used for evaluating the acceleration vector,
are obtained the subsequent motion can be calculated by this algorithm.
In order to reduce the computation time, a cut off radius (rct) is usually specified in the simulation to limit the number of interactions associated with individual atoms.
A list of neighboring atoms is generated for each atom in the system so that only the
interactions with those listed in the neighbor list are accounted for the force calculation. This avoids the time consuming step of calculating all possible interactions between an atom and the rest in the system for each time step.
Based on Eq. (1.3), the atomic displacements for all atoms can be calculated from
a pre-set time step which is usually 1 fs (1xO-1 5 s), and the atomic velocities can be
calculated accordingly. After computing the atomic displacements, velocities and accelerations for all atoms under a desirable ensemble, the material properties can be determined and interpreted through post-processing of the calculated quantities. Usually an existing post-processing program, such as the visualization tool in Visual Molecular Dynamics (VMD) ((Humphrey et al. 1996)), is used. Interpreting the molecular dynamics results usually means performing time averages of physical properties. Post-processing using appropriate theoretical models are required in order to evaluate some of the material properties from the molecular dynamics simulation result, such as the adhesive energy of a bonded system. Fig. 1.3 shows the various steps involved in a typical molecular dynamics algorithm.
1.1.3 Multiscale modeling
There are several examples where mechanical properties from molecular simulations match reasonably well with those measured experimentally at larger scales (see, for example case studies discussed by (Buehler 2008)). However, deformation mechanisms at the interface can be complicated and can change across different length scales. Besides the change of deformation mechanisms, the disparity in time- and length-scales also leads to the discrepancies between molecular dynamics simulation and the experimental results. Hence, there is a need to connect the atomistic level to macroscale such that a prediction on mechanical properties using a bottom-up approach becomes feasible.
Multiscale modeling in physics usually refers to the calculation of material properties or system behaviors on one level using information or models from different levels. On each level particular approaches are used for describing the concerned system. In general, the following levels can be distinguished, namely:
* level of quantum mechanical models which includes the information about electrons,
" level of molecular dynamics models which includes the information about
individual atoms,
" level of nano or mesoscale which includes the information about groups of atoms
Each level addresses a phenomenon over a specific length scale and time scale. Multiscale modeling is particularly important in integrated computational materials science and engineering since this modeling approach is capable in predicting the material properties or system behavior based on knowledge of the atomistic structure and properties of elementary processes, which are fundamentally governed by physics and chemistry.
1.2 Research Objective
The objective of this research is to develop an in-depth mechanistic understanding on the moisture affected debonding mechanism between epoxy and silica under various length scales, with the extensibility of understanding the general adhesion problem between organic and inorganic materials so as to form the basis for designing a mechanically strong interface in applications such as those found in medical field including artificial bone and tissue, as well as civil infrastructure application.
1.3 Research Approach
From the review of prior studies on strengthening and retrofitting of reinforced concrete systems using FRP composites, it can be seen that while FRP-bonded concrete system has been extensively studied, the structural performance of FRP-bonded concrete system when subjected to moisture ingress at the interface remains largely uncertain and unanswered. In particular, little is known regarding the durability of concrete/epoxy interface which has been shown as a critical region under the effect of moisture. Prior research has demonstrated that moisture effect significantly leads to the degradation in concrete composite system. In order to understand the origin of this deterioration, a fundamental understanding of the physics and chemistry at the vicinity of the interface is required. In view of the limitation of the conventional fracture mechanics concept which is unable to predict the behavior when chemical effects are involved, molecular dynamics simulation is used in this research which is capable in describing the interaction between the material system and the surrounding (water molecules in this case).
Both computational and experimental approaches are used for a comprehensive investigation on the debonding at epoxy-silica interface under the effect of moisture. Molecular dynamics simulation is used for studying the interaction among various materials (epoxy, silica and water). The result from the molecular dynamics simulation can be interpreted in a larger length scale through an appropriate multiscale modeling, which can then be compared with the experimental result. In this research, two different experimental approaches in characterizing the interfacial fracture toughness will be presented. The pros and cons of these two approaches will be described in
detail in Chapters 4 and 5.
This research is motivated from the interfacial durability concerns of the strengthened and retrofitted concrete structures. It is anticipated that this work can
yield much needed scientific knowledge and quantitative information; and through the studies on the epoxy-silica interface, it can provide the essential knowledge as a basis for understanding the adhesion between general organic and inorganic materials that can be beneficial to many engineering related application including the fabrication of Micro-Electro-Mechanical System (MEMS) and medical devices which have a direct impact on human wellbeing.
1.4 Thesis Organization
The thesis consists of seven subsequent chapters.
Chapter 1 presents a review on the debonding of bi-layer material system, with a focus on FRP-bonded concrete system and concrete/epoxy interface. A general
background on molecular dynamics simulations and multiscale modeling approach is described which form the basis of my Ph.D. research.
Chapter 2 describes the application of molecular dynamics simulation in structural engineering problems. The durability study of epoxy-silica system is used as an example for demonstration.
Chapter 3 presents the derivation of the intrinsic strength at epoxy-silica interface through the reconstruction of the free energy landscape and the worm-like-chain based fracture model.
Chapter 4 presents the experimental approach in characterizing the fracture toughness at epoxy-silica interface using nanoindentation.
Chapter 5 presents the experimental approach in characterizing the fracture toughness at epoxy-silica interface using superlayer approach.
Chapter 6 presents the multiscale analysis which links the result from molecular dynamics simulation to continuum through the implementation of cohesive zone model in the finite element analysis.
Chapter 7 summarizes the thesis and draws conclusions from the work. Areas for future investigation are also presented.
Chapter
2Molecular Dynamics Simulations
for Structural Engineering Problem
2.1 Molecular Dynamics Simulation of Epoxy-Silica Interface
One of the challenges in molecular dynamics simulation is to construct an atomistic model which can accurately describe the system. A known chemical formula for the concerned material is necessary in order to create a realistic atomistic model. Concrete is a heterogeneous material which is primarily composed of hydrated cement and aggregate. However, among all the constituent materials in concrete, silica, which has a well-defined chemical formula, constitutes a large proportion as aggregate, usually more than 40 percent by weight of the solid ingredients. By investigating the silica-epoxy interface in an atomistic scale, it is expected that the structural behavior of concrete-epoxy interface can also be interpreted. Note that the chemical formula for hydrated cement has also been provided in a recent study on cement chemistry (Pellenq
et al. 2009).
Fig 2.1 (a) Unit cell of SiO2, (b) Atomistic model of SiO2substrate
In our study, the atomistic model consists of crystalline silica (SiO2) and a single chain of epoxy. Fig. 2.1 shows the atomistic model of the crystalline silica used in molecular dynamics simulation. A silica block was constructed from a unit cell of crystalline silica shown in Fig. 2.1(a). By repeating the unit cell in x-, y-, and z-directions, a bulk silica crystal can be obtained as shown in Fig. 2.1(b). The bulk silica crystal is then cleaved in such a way that the normal vector of the cleaved surface (to be in contact with epoxy) is at [001] direction. All the atoms in the crystalline silica are covalently bonded by a harmonic bond potential. Non-periodic boundary conditions are applied on the SiO2 substrate which means that hydrogen atoms are used for bond
termination at the free surface of the SiO2 substrate as shown in Fig. 2.1b. The entire SiO2 substrate has dimensions a = 9.421A, b = 36.84 A, c = 3.881
A,
with a = 90, 8 = 90, y = 90* and consists of 2540 atoms. The epoxy employed in this thesis is diglycidylether of bisphenol A (DGEBA) and its molecular structure is shown in Fig. 2.2. For simplification, there is no hardener included in the atomistic model. Only one chain of
DGEBA, with five repeating units (n=5 as shown in Fig. 2.2), is used in this model. In
the case describing a wet environment, a water box is created which embraced the SiO2
-DGEBA system entirely. Fig. 2.3 shows the models for both dry (Fig. 2.3a) and wet (Fig. 2.3b) cases. Partial charges of all atoms in the simulation cell are calculated by the
charge equilibrium (QEq) method (Rappe and Goddard 1991).
Fig 2.3 (a) Simulation model for dry case, (b) Simulation model for wet case
Interaction between dissimilar molecular entities such as polymer and silica is formulated through the definition of force field. This is similar to the concept of constitutive model used in FEM to formulate the material behavior. For different atoms, the corresponding parameters adopted in the chosen force field are obtained either by experimental methods such as nuclear magnetic resonance (NMR) spectroscopy or from rigorous ab initio quantum mechanics calculations. Some of the commonly used force fields are Amber (Weiner et al. 1984; Weiner et al. 1986), DREIDING (Sotomayor and Schulten 2007), CHARMM (Brooks et al. 1983; Momany and Rone 1992), consistent force field (CFF91) (Hagler and Ewig 1994; Hwang et al. 1994; Maple et al. 1994) and consistent valence force field (CVFF) (Dauber-Osguthorpe et al. 1988; Maple et al. 1988). These force fields were optimized and well tested for simulating different proteins and
applicable. Meanwhile, efforts have been made to parameterize the CVFF for inorganic materials including silica as well as the interface between silica and epoxy. Therefore, CVFF is applied for studying the interaction between silica and epoxy under both dry and wet condition.
The total potential function in CVFF is represented by the superposition of valance and non-bonded interactions. The valance terms are the bonded interactions consisting of bond stretch, bond angle bending, dihedral angle torsion terms, while non-bonded interactions consist of Van der Waals and electrostatic terms. Fig. 2.4
shows the potential terms adopted in the CVFF.
Bond Stretch Bond Angle Bending
Dihedral Angle Torsion
Fig 2.4 Major potential terms in the CVFF used here, applied to describe the silica substrate, epoxy chain and water
In this simulation, the CVFF potential energy function given by (Maple et al. 1988) is used. This is a reduced form of CVFF potential function using harmonic form for bond stretching term, which is useful for simulating structures consisting of organic and inorganic phases (Ritschla et al. 2002). In this reduced form, the CVFF potential function is described as,
E=>JKb(b -b) 2
+EKO(-0 ")2 + KO(1+ s cos n#)
b 0
r r 6 + qq (2.1)
where Kb, KO, K are force constants, bo, 0o and s are equilibrium bond length, equilibrium bond angle and dihedral angle, respectively; b and 9 are bond length and bond angle, rij is the distance between the ith and jth particles with charges qi and qj, respectively. The terms q and rij* determine the minimum and zero values of the van der Waals terms, respectively. The CVFF has been parameterized against a wide range of experimental observables for amino acids, water, and a variety of other functional groups, as well as some inorganic materials including silica (details and parameters described in (Maple et al. 1988)). The parameters of the force field used in this thesis are included in the Appendix A. In this thesis, the CVFF water potential is adopted, a three-site model with internal geometry corresponding to the gas-phase experimental structure (Lau et al. 1994). Flexibility of water molecules is modeled through the use of
harmonic bond stretching and angle bending potentials. With the exception of the hydrogen atom size, the non-bonded parameters are comparable to those of simple point charge (SPC) model. An important aspect of choosing an interaction function for the epoxy-silica system including explicit water molecules is the consistency between different parts of the interatomic function, for example the epoxy-silica, epoxy-solvent, silica-solvent and solvent-solvent terms. When combining a water model with a force field used in the epoxy-silica system, the definition of the solvent-related interaction requires special attention. In most cases, this interaction is defined using the so-called combination rules (Gunsteren et al. 1994). If epoxy-silica system and solvent force fields are of different types, the application of combination rules may lead to an imbalance between epoxy-silica, epoxy-solvent, silica-solvent, and solvent-solvent interactions.
Initiation and energy minimization of the simulation cell containing silica and epoxy (and water in the wet condition) were then performed. After constructing the atomistic models for both dry and wet cases with the clear definition of the model geometry and the interaction among atoms, the following computation experiments were carried out under NVT ensemble at 300 K in an existing molecular dynamics code called LAMMPS (Plimpton 1995). A sample script of atom definition in LAMMPS can be found in Appendix B.
Computational peel and shear tests on the silica-epoxy system were performed through steered molecular dynamics (SMD) by systematically varying the pulling velocity over four orders of magnitude, ranging from 2 to 1000 m/s. The basic idea of
SMD is to apply an external force to one or a group of atoms, while keeping another
group of atoms fixed and study the behavior of the molecule. Essentially, the SMD approach applies a moving spring force under constant velocity (i.e. the force is not constant). The SMD approach mimics an atomic force microscope (AFM) experiment. In our simulation, only the silica substrate is fixed. All atoms in water and silica are allowed to move freely. The end carbon atom in the epoxy was connected to a virtual spring in the entire process of SMD. The pulling direction to this carbon atom is normal away from the silica-epoxy interface under peeling condition and parallel with the interface under shear loading. Fig. 2.5 describes the peel and shear computational experiments schematically.
constait velocity (V)
As discussed previously, a suitable model is required in quantifying certain mechanical property. Here, the applicability of the model as done previously for investigating the adhesion between protein structures is extended (Ackbarow et al.
2007). It is based on the conventional Bell model (Bell 1978) which was developed and
applied to the study on cell adhesion at larger scales. Similar to earlier work (Ackbarow et al. 2007) here Bell's approach is applied so that simulation at various pulling speeds can be used to gain information on the free energy landscape of the bi-material system, postulating a phenomenological theory in explaining the competing process due to the mechanical induced stabilities. Through the Bell analysis, the energy barrier Eb and the distance between the equilibrated state and the transition state xi (see Fig. 2.6) can be found. In the modified Bell model (Ackbarow et al. 2007), a relationship between the pulling speed and the bond associated properties can be written as:
V=vo ex (2.2)
where
f
is the external applied force, kB is the Boltzmann constant, T is the temperature, with vo as the natural bond breaking speed, which is defined asVO = aoXb - exp { (2.3)
Substituting Eq. (2.3) into Eq. (2.2) and rearranging the equation with f as the subject,
f
=B nv - kB 0 = A -Inv+B (2.4)Xb) Xb
where A = ksT/x and B = kBT-Invo/xb. Eq. (2.4) predicts that the applied force depends logarithmically on the pulling speed in a non-equilibrated system. It should be mentioned that the maximum force recorded through the whole simulation process under the constant velocity was taken as the value of f for the Bell analysis. By plotting
f against ln(v), the Eb and xb for this system can be quantified through the slope of
y-intercept of the curve. The resulting value of Eb represents the adhesive energy between silica and epoxy in an atomistic scale.
f-xb
Eb
Xb
The maximum forcef is plotted as a function of the pulling speed in Fig. 2.7a and Fig. 2.7b for the peel case under dry and wet conditions, respectively. Fig. 2.7c and Fig.
2.7d show the maximum force
f
for the shear case as a function of the pulling speed under dry and wet conditions, respectively. It should be mentioned that v* is for the normalization purpose which equals 1 m/s. By fitting the extended Bell theory to the molecular dynamics results of the peel case, Eb = 9.10 kcal/mol and xb = 0.69 A for thedry condition are obtained. In the wet case, Eb = 7.74 kcal/mol and x, = 0.16 A. Similar
values are found for the shear case. For the dry case, the obtained values are Eb = 7.06
kcal/mol and xb = 0.48
A.
In the wet case, Eb = 5.99 kcal/mol and xb = 0.11A.
These results are summarized in Fig. 2.8. The decrease in the adhesive energy Eb from 9.10 to7.74 kcal/mol in the peel case and from 7.06 to 5.99 kcal/mol in the shear case, indicates
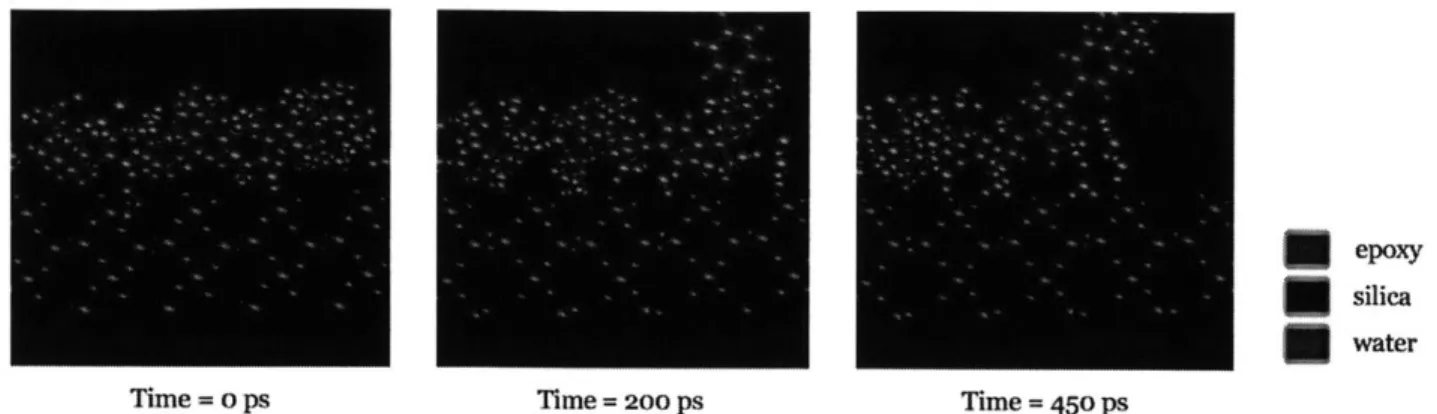
that the adhesive strength between silica and epoxy is weakened in the presence of water with 14.9% reduction in the peel case and 15.2% reduction in the shear case. A close examination of the molecular dynamics simulation process under wet condition shows that some water molecules can seep into the gap between silica and epoxy as shown in Fig. 2.9. Hence, the interaction between silica and epoxy is interfered by the presence of these water molecules, causing a change in the epoxy-silica interface from a bonded stage to a detached stage, which results in a reduction of energy barrier. The trend of deterioration is consistent with the results from meso-scale fracture based studies of the concrete-epoxy specimens (Lau and Biy k6ztirk 2010) and FRP-bonded concrete specimens (Au and Biyfik6ztirk 2006b). In these papers, it is reported that there is a substantial decrease in the interfacial fracture toughness of concrete-epoxy system under prolonged moisture, which is accompanied with a shift of failure mode from material decohesion to interface separation. Both the experimental and simulation works show the reduction in the energy required for debonding in the presence of water. The molecular dynamics result validates our hypothesis that the adhesive strength of the interface is weakened due to interaction between epoxy and water and provides an atomistic-based view on the mechanical properties of the interface.
(a) (b) 0-.
z
900 Soo 700 600 500 400 300 200 100 0 4000 3500 3000 2500 2000 1500 1000 500 0 y = 54.46x + 56o.12 R2 = 0.9171 0 1 2 3 4 5 ln(u/,*) y = 88.X + 525.51 R2 = o.7964 y = 239.O8x + 2,213.68 R2= 0.8288 0 1 2 3 4 5 ha(v/u*) y = 34180X + 2,181.11 R2 = o.8922 0 2 3 m(aV/v-j ln(v/v9)Fig 2.7 Maximum force as a function of varying pulling speed under (a) peel and dry conditions,
(b) peel and wet conditions, (c) shear and dry conditions, and (d) shear and wet conditions.
Fig 2.8 Summary of the difference between peel and shear loading cases under both dry and wet conditions. This result implies that adhesion between silica and epoxy is weakened by about
15% in the presence of water.
Peel Shear (d) ZO. (C) 0-%
z
4500 4000 3500 3000 2500 2000 1500 1000 500 0 1200 1000 800 6oo 400 200 0 0 1 2 3 4 5 5 10 9. ~%7 6--n3 2 0epoxy
silica water
Time = o ps Time= 200 ps Time = 450 Ps
Fig 2.9 Snapshots of the MD simulation in wet condition
2.2 Summary Comments
Research on molecular dynamics simulation contributes to our understanding of the interaction between structural materials and environment at an atomistic scale providing a bottom-up approach to structural engineering. Especially, molecular dynamics is useful for studying the fracture related problems which can be intrinsically described in this length scale. The work reported in this chapter has demonstrated that solution from molecular dynamics simulation can give us an insight on the failure mechanism of layered material system under moisture effect. The bonded structural system consisting of silica and epoxy was investigated and it was found that the weakening of the adhesive strength between silica and epoxy can be quantified by the decrease of the energy barrier Eb. However, the results from standard molecular dynamics simulation only describe the considered system correctly on limited length and time scales. A bridging technique which links the nano-scale and macro-scale together is required. Research work in this area is still at infant stage, and in particular applying the method to important problems in the field that often span many structural scales. It is anticipated that the long term impact of my Ph.D. work will be in extending our ability to perform structural engineering at the macro-scale, as related to the local phenomena that is modeled at the nano-scale. In the following chapter, adhesive strength of the interface will be quantified through the reconstruction of the free energy profile of the bonded system. It is believed that a better understanding on the debonding mechanism can be obtained through the free energy profile.