HAL Id: inserm-00742527
https://www.hal.inserm.fr/inserm-00742527
Submitted on 16 Oct 2012
HAL is a multi-disciplinary open access
archive for the deposit and dissemination of
sci-entific research documents, whether they are
pub-lished or not. The documents may come from
teaching and research institutions in France or
abroad, or from public or private research centers.
L’archive ouverte pluridisciplinaire HAL, est
destinée au dépôt et à la diffusion de documents
scientifiques de niveau recherche, publiés ou non,
émanant des établissements d’enseignement et de
recherche français ou étrangers, des laboratoires
publics ou privés.
Plasma and exhaled breath condensate nitrite-nitrate
level in relation to environmental exposures in adults in
the EGEA study.
Marta Rava, Raphäelle Varraso, Brigitte Decoster, Hélène Huyvaert, Nicole
Le Moual, Bénédicte Jacquemin, Nino Künzli, Francine Kauffmann, Farid
Zerimech, Régis Matran, et al.
To cite this version:
Marta Rava, Raphäelle Varraso, Brigitte Decoster, Hélène Huyvaert, Nicole Le Moual, et al.. Plasma
and exhaled breath condensate nitrite-nitrate level in relation to environmental exposures in adults
in the EGEA study..
Nitric Oxide: Biology and Chemistry, Elsevier, 2012, 27 (3), pp.169-75.
�10.1016/j.niox.2012.06.007�. �inserm-00742527�
Nitric oxide 2012, in press
Plasma and exhaled breath condensate nitrite-nitrate level in relation
to environmental exposures in adults in the EGEA study
Marta Rava
a,b, Raphäelle Varraso
a,b, Brigitte Decoster
c, Hélène Huyvaert
c, Nicole Le Moual
a,b, Bénédicte Jacquemin
a,b,
Nino Künzli
d,e, Francine Kauffmann
a,b, Farid Zerimech
f,
Régis Matran
c,f, Rachel Nadif
a,ba Respiratory and Environmental epidemiology, CESP Centre for research in Epidemiology and Population health, U1018, Inserm,
F-94807, 16, avenue Paul Vaillant Couturier, 94807 Villejuif, France
b Université Paris Sud 11, UMRS 1018, F-94807, avenue Paul Vaillant Couturier, 94807 Villejuif, France
c Université Lille Nord de France, Faculté de Médecine - pôle Recherche Département de Physiologie, 1, place de Verdun, 59045 Lille
Cédex, France
d Swiss Tropical and Public Health Institute, Socinstr. 57, P.O. Box, 4002 Basel Switzerland e University of Basel, Petersplatz 1, CH-4003 Basel, Switzerland
f CHU, Bd Pr Leclercq 59037, Lille, France
E-mail address for co-authors:
Raphäelle Varraso: raphaelle.varraso@inserm.fr, Brigitte Decoster: bdecoster@univ-lille2.fr, Hélène
Huyvaert: huyvaert.helene@voila.fr, Nicole Le Moual:
nicole.lemoual@inserm.fr, Bénédicte Jacquemin:
benedicte.jacquemin@inserm.fr, Nino Künzli: nino.kuenzli@unibas.ch, Francine Kauffmann:
francine.kauffmann@inserm.fr, Farid Zerimech:
Farid.ZERIMECH@CHRU-LILLE.FR, Régis Matran:
regis.matran@CHRU-LILLE.FR, Rachel Nadif: Rachel.nadif@inserm.fr
Corresponding author: Marta Rava
Address: Epidémiologie respiratoire et
environnementale, CESP/UMRS 1018 Inserm - UPS11
16, avenue Paul Vaillant Couturier, 94807 Villejuif
Fax: 33 (0) 145 59 51 69, phone: 33 (0) 145 59 53 58
E-mail:
marta.rava@inserm.fr
List of abbreviations
CI, confidence interval; EBC, Exhaled breath
condensate; EGEA, Epidemiological study on Genetics
and Environment of Asthma; FeNO, fraction of
exhaled nitric oxide; NO, Nitric Oxide; NO
2-, Nitrite;
NO
3-, Nitrate; NO
2, Nitrogen dioxide; O
3, Ozone; PM
10,Particulate Matter with aerodynamic diameter ≤10µm;
Q, quartile
Abstract
This study evaluated the associations between biological markers in the nitrate-nitrite-NO pathway and four environmental exposures among subjects examined in the second survey (2003-2007) of the French Epidemiological study on Genetics and Environment of Asthma (EGEA). Total nitrite and nitrate (NO2−/NO3−)levels were measured both in
plasma and in exhaled breath condensate (EBC) in 949 adults. Smoking, diet and exposure to chlorine products were assessed using standardized questionnaires. Exposure to air pollutants was estimated by using geostatistical models. All estimates were obtained with generalized estimating equations for linear regression models. Median levels of NO2−/NO3− were
36.3µM (1st-3rd
quartile: 25.7, 51.1) in plasma and 2.0 µmol/mg proteins (1st-3rd quartile 0.9, 3.9) in EBC. After adjustment for
asthma, age, sex and menopausal status, plasma NO2−/NO3−
level increased with leafy vegetable consumption (above versus below median=0.04 (95%CI: 0.001, 0.07)) and decreased in smokers (versus non/ex-smokers=-0.08 (95%CI: -0.11,-0.04). EBC NO2−/NO3−level decreased in smokers
(-0.08 (95%CI: -0.16, -0.001)) and with exposure to ambient O3
concentration (above versus below median=-0.10 (95%CI:-0.17, -0.03)). Cured meat, chlorine products, PM10 and NO2
concentrations were not associated with NO2−/NO3− levels.
Results suggest that potential modifiable environmental and behavioral risk factors may modify NO2−/NO3− levels in plasma
and EBC according to the route of exposure.
Keywords: Air pollutants, Biological markers, Chlorine, Diet, Nitrate, Nitrites, Tobacco smoke
1. INTRODUCTION
Known biological markers involved in the nitrosative pathway, also called the "nitrate-nitrite-nitric oxide" pathway, are nitric oxide (NO), nitrites (NO2−) and nitrates (NO3−), which are
indirect stable indicators of NO synthesis. These biological markers play a key role in several physiological functions ranging from neuromodulation to regulation of vascular tone [1], and are involved in local host defense, gut mucosal integrity and also in cardiovascular [2] and airway diseases [3]. Pharmacological and dietary interventions on prevention and treatment of diseases are now under study [4]. Until now, epidemiological studies have been mainly conducted on the fraction of exhaled NO (FeNO). Diet is the most important source of both NO2− (mostly from cured meats) and NO3−
(mostly from leafy vegetables) [5]. Formation of NO2− and NO3−
can also take place after inhalation of exogenous compounds like oxidants from cigarette smoke [6; 7], nitrogen dioxide (NO2) and ozone (O3) from air pollution [8], and chlorine from
cleaning agents [9] .
The negative association between exposure to tobacco smoke and FeNO is well known [10], while the association between FeNO with other environmental exposures has been explored more in children [11; 12] than in adults [13]. However, few epidemiological and clinical studies have focused on the associations between environmental exposures and NO2−/NO3−. In the occupational setting, Gube et al [14]
reported that welders had high NO3− concentrations, and
Ghasemi et al [15] found increasing serum NO2−/NO3− levels in
smokers compared to non- and ex-smokers.
In biological fluids, the half-life of nitric oxide (NO) is extremely short owing to its rapid oxidation to nitrites (NO2−) and nitrates
(NO3−) [16].Total NO2−/NO3− levels are usually measured in
blood (plasma or serum) but can also be measured in exhaled breath condensate (EBC). Interest in the analysis of EBC constituents has increased in the last ten years, because EBC is viewed as a promising tool for non-invasive evaluation of lung diseases [17]. As plasma and EBC are two distinct body constituents, we hypothesized that direct or indirect environmental sources of NO2− and NO3− might have
differential effects on NO2−/NO3− levels in plasma and EBC.
Production of NO2−/NO3− in plasma is more complex than in
EBC. In the latter, ionized NO3− and NO2− (not volatile) may be
produced from NO after reaction with oxygen [18] or from activated immune cells present in the lining of the lungs [19]. In plasma, NO2−/NO3− production derives from several sources,
such as bacteria, enzymatic production and dietary sources [16]. To clarify the role of environmental exposures on levels of biological markers in the nitrosative pathway, associations between smoking, dietary habits, ambient air pollution, and chlorine products with total NO2−/NO3− level both in plasma and
EBC were evaluated in adults from the Epidemiological study on the Genetics and Environment of Asthma (EGEA).
2. MATERIALS AND METHODS 2.1. Study population
Data used for the analyses were collected in the framework of the 12-year follow-up of the EGEA study (http://cesp.vjf.inserm.fr/egeanet/). The EGEA study has been
described elsewhere [20; 21]. Briefly, it combines a case-control study with a family study of asthma cases (children or adults) conducted between 1991 and 1995 in 2047 subjects from five French cities. A follow-up of the initial cohort was conducted between 2003 and 2007 [22]. Among the alive cohort (n=2002), 92% (n=1845) completed a short self-administered questionnaire and among them 1601 had a complete examination. The present project includes those who were adults at the second survey (≥ 16 years old, n=1570 adults) with available measurement of total NO2−/NO3− levels
both in plasma and EBC (n=949). Subjects included in the analyses were more exposed to O3 and less to NO2 than those
not included in the analyses (n=621), and the two groups were similar for age, sex, asthma status and for the other environmental exposures considered. Asthmatics were defined by a positive answer to either “have you ever had attacks of breathlessness at rest with wheezing” or, “have you ever had asthma attacks?” or if they were recruited as asthma cases at the initial survey. Ethical approval was obtained from the relevant institutional review board committees (Cochin Port-Royal Hospital and Necker-Enfants Malades Hospital, Paris) and written consent was signed by all participants.
2.2. Biological measurements
EBC was collected with an RTube (TM) according to standardized methods. Briefly, the RTube (TM) was rinsed with deionized water and dried thoroughly. Subjects breathed orally at tidal volumes into a mouthpiece attached to a cold condenser (-20°C). The patient was seated comfortably with a headrest. All headrests and back seatseats were tilted slightly to avoid any saliva contamination during breathing maneuvers. Breathing was quiet and regular. After 15 minutes, EBC collection was immediately separated in aliquots and stored at -80·C according to standardized procedures (http://www.afaq.org/certification=262711141114). Plasma aliquots were stored from 1.7 to 5.3 years and EBC samples from 1.8 to 5.4 years until analysis.
Total NO2−/NO3− levels were measured in plasma and EBC by
the Griess reaction [23]. Briefly, NO3− was reduced to NO2− by
adding NO3− reductase (25 mU/ml) and NADPH 20 mM at
room temperature. After 3 hours, samples were deproteinized by adding a solution of ZNSO4 30% and centrifuged. Griess
reagent (0.1% naphthalethylene-dimine and 1 sulfanilamide in 5% H3PO4) was added to supernatants. The optical density at
560 nm was measured using a microplaque reader. NO2−
levels were calculated by comparison with optical density 560 of standard sodium NO2− solutions. All measurements were
done in duplicate. Analytical intra-run imprecision was below 3%. Measurements with a coefficient of variation >15% and extreme outliers (n=7) were excluded from the analyses. Protein concentration in EBC was determined according to Smith [24]. Total NO2−/NO3− level levels were expressed as µM
in plasma and as µmol/mg of proteins in EBC [25].
In 116 out of 120 subjects chosen at random, NO2− levels were
measured by the Griess reaction before and after adding NO3−
reductase. NO3− levels were obtained as the difference
between total NO2−/NO3− and NO2− levels.
2.3. Environmental exposures 2.3.1. Smoking status.
’Current smokers’ were individuals who reported currently smoking at the time of the study and for at least one year, while ’ex-smokers’ were those who stopped smoking for at least four weeks. Subjects were grouped as: ’no/ex-smokers’ and ’current smokers’. Daily tobacco consumption was evaluated considering 1 cigarette, 1 cigarillo and 1 cigar as equal to 1, 2 and 5g respectively.
2.3.2. Dietary assessment.
Dietary consumption of cured meat and leafy vegetables was obtained by using a food frequency questionnaire designed to assess average food intake during the previous 12 months. This questionnaire was set up based on a validated French dietary questionnaire [26]. Participants indicated their average frequency of consumption for 118 items including meat and vegetables over the past year in terms of the specified serving size by checking one of eight frequency categories ranging
from ’never or <1 time/month’ to ’>= 4 times/day’. Standard portion sizes were listed with each food. The selected frequency category for each food item was converted to a daily intake. Cured meat consumption was defined as the sum of the intake for sausage (portion size, 1 piece) and dried sausage (portion size, 2 slices). Leafy vegetable consumption was defined as the sum of the intake for salad, raw or cooked endives, raw or cooked watercress, or cooked spinach. Those vegetables were considered because of the high content of nitrate. Intake of cured meats and leafy vegetables was divided into two categories defined by the median and was also used as continuous variable.
2.3.3. Air pollution.
Yearly estimates of ambient air pollution concentrations were assigned at each participant’s home address in 2004 for O3,
PM10, and NO2. Estimates were developed by the French
Institute of Environment using a geo-statistical interpolation model (cokriging-like integrating land cover and specific cofactors for each pollutant such as altitude (O3), inventory of
nitrogen oxides emissions, road network and population density (NO2), and inventory of black smoke emissions
(PM10)). Interpolation was performed for annual mean
concentrations obtained from background monitoring stations on a 4km x 4km grid covering the whole of France [27]. Air pollution concentrations were divided into two categories defined as above /below the median and were also analyzed as continuous variables.
2.3.4. Exposure to chlorine products.
Subjects were defined as exposed to chlorine products if they used detergents containing chlorine at work or at home. Occupational exposure to chlorine products was defined as exposure to bleach/chlorine at work during disinfecting or cleaning tasks in the last job. The use of chlorine products was evaluated on the basis of an expert assessment or by self-report when no expert evaluation was available. In the EGEA survey, the validity of self-reported exposure to bleach/chlorine was good (Cohen’s Kappa coefficient: 0.82, sensitivity: 87%, specificity: 95%) [28]. Information about domestic exposure to cleaning agents was collected through a specific questionnaire previously used in the European Community Respiratory Health Survey [29]. A subject was considered as exposed at home if he/she declared using bleach/chlorine weekly. 2.4. Statistical analysis
Total NO2−/NO3−levels were log10-transformed as a result of
their skewed distribution. Differences among groups were tested using Student’s t-test, the Mann-Whitney U test or the Chi-square test when appropriate. Heterogeneity among asthmatics and non-asthmatics adjusted on age was tested using a linear regression model for continuous variables and the Cochran-Mantel-Haenszel test of conditional independence for categorical variables. The Spearman correlation coefficient was used to estimate correlations between environmental exposures. Even though some of the variables were dichotomous, the Spearman correlation was judged an appropriate index because dichotomous variables are a special case of ordinal variables. In addition, the use of Spearman correlations allowed the results to be presented in a consistent format. The association between environmental exposures and total NO2−/NO3− levels was estimated with
linear regression models. Parameter estimates were obtained by using generalized estimating equations, with an exchangeable working correlation to account for the potential clustering within the families (SAS MIXED procedure). Estimates were first adjusted for asthma. Since plasma NO2−/NO3− levels were higher in menopausal women (see
section 3), the analyses were also adjusted for age and a 3-class variable based on sex and menopausal status (men, premenopausal women and postmenopausal women). Interactions between environmental exposures and sex, age or asthma were studied when appropriate by including an interaction term in the linear model. The environmental exposures that showed an association with P<0.1 with total plasma or EBC NO2−/NO3− level were included in the final
model with asthma, age, and menopausal status. As a sensitivity analysis, the analyses were repeated by considering
only non-asthmatics. The level of statistical significance was set at α=0.05. Two-sided P-values were reported for all association estimates. All analyses were conducted using SAS software, version 9.2 (Cary, NC, USA).
3. RESULTS
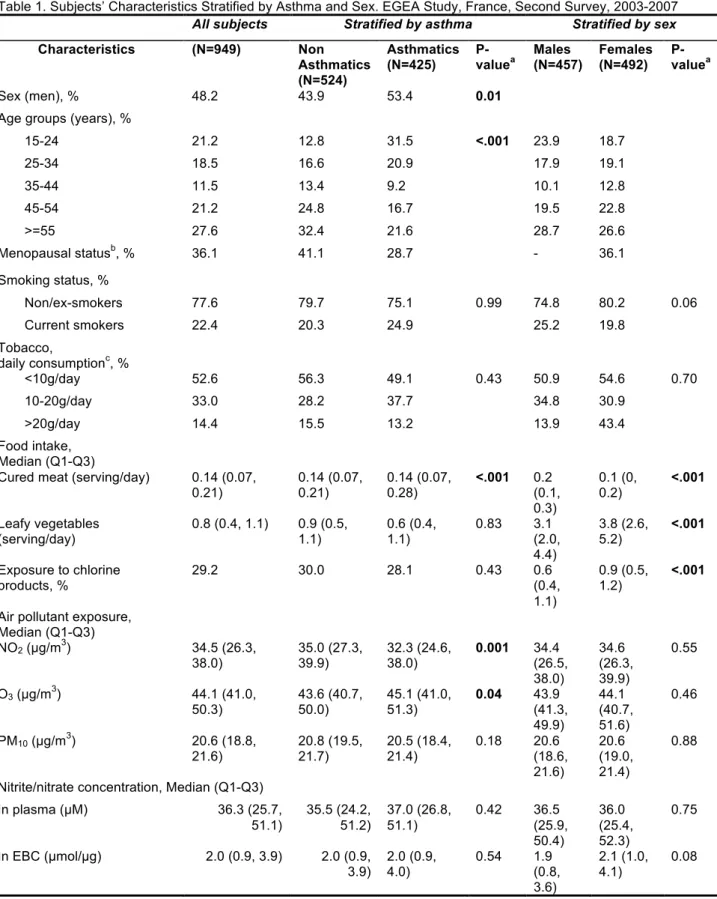
Characteristics of the 949 adults according to their asthma status and sex are summarized in Table 1. EBC NO2−/NO3−
levels did not vary with storage time and plasma NO2−/NO3−
slightly decreased with storage time (Beta for linear regression model=-0.03, P=0.03).
Analysis of variations according to sex and 10-year age classes was first performed (see Figure A.1). It showed that women older than 45 years had higher total plasma NO2−/NO3−
levels (P-value for interaction between age and sex: 0.02). Menopausal status was significantly related to higher plasma NO2−/NO3− levels (median (1st -3rd quartile (Q)): 34 (24-47) µM
vs. 39 (28-59) µM; P<0.001). Men were more frequently smokers than women (Table 1). Cured meat consumption was higher in asthmatics than in non-asthmatics, and in males than in females. Women consumed more leafy vegetables and were more exposed to chlorine products than men. Asthmatics lived in areas with lower NO2 and PM10 and higher O3 ambient
concentrations than non- asthmatics. Neither plasma nor EBC total NO2−/NO3− levels were associated with asthma status or
with sex. No association was observed between NO2−/NO3−
levels measured in plasma and EBC (Pearson r=0.03, P=0.30).
Correlations between the four environmental exposures are shown in Table A.1. Current smokers consumed more cured meat than non/ex-smokers. Leafy vegetable consumption was positively associated with exposure to chlorine products. NO2
and PM10 concentrations were negatively correlated. Age was
negatively associated with smoking habits and cured meat consumption and positively related with leafy vegetable consumption, exposure to chlorine products, ambient concentrations of O3 and PM10.
3.1. Total plasma NO2−/NO3− levels and environmental
exposures
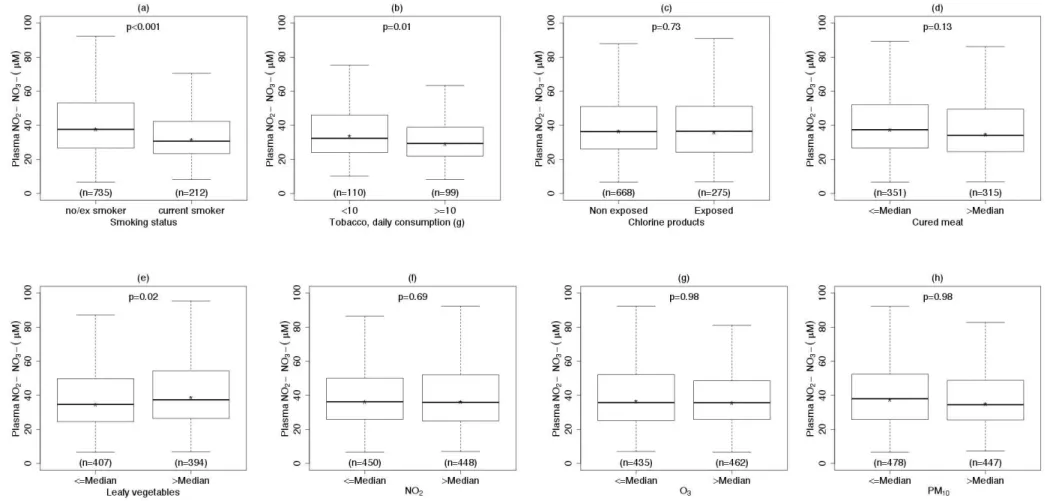
Total plasma NO2−/NO3− levels were lower in smokers than in
non/ex-smokers and were negatively associated with daily grams of tobacco smoked (see Table 2, Figure A.2). Excluding the ex-smokers that quitted smoking since less than a month (n=9) did not change the results. Higher levels of total NO2−/NO3− were observed in subjects who consumed high
amounts of leafy vegetables (see Table 2, Figure A.2). In the subsample of 116 subjects in whom NO3− and NO2− levels
were measured separately, NO3− median levels increased from
17.8 to 25.8 µM for low to high consumers of leafy vegetables (P=0.4). No statistically significant association was observed between total plasma NO2−/NO3− levels and cured meat
consumption, chlorine products and ambient air pollutant concentrations (see Table 2 and Figure A.2). After adjustment for asthma, age, sex, and menopausal status, associations were confirmed between plasma NO2−/NO3− and smoking
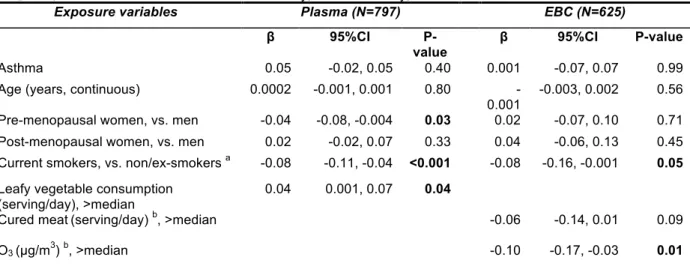
habits and daily grams of tobacco smoked, measured both as categorical and as continuous variables (results not shown). The association with leafy vegetable consumption measured as categorical variable was borderline significant (Table 2). When included in the same model, smoking status and leafy vegetables remained significantly associated with plasma NO2−/NO3− levels (see Table 4). Similar results were observed
among non-asthmatics only and when storage time was included as covariate in the models (results not shown). 3.2. Total EBC NO2−/NO3− levels and environmental
exposures
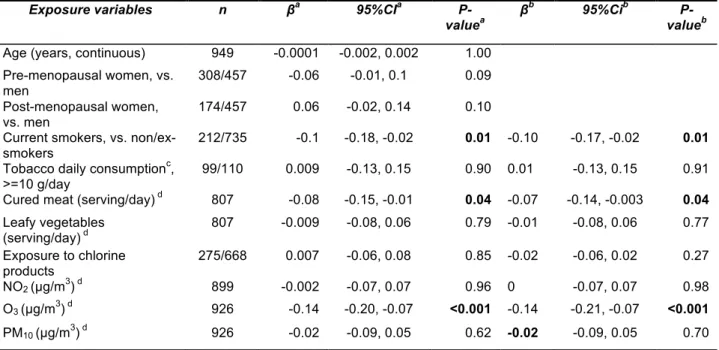
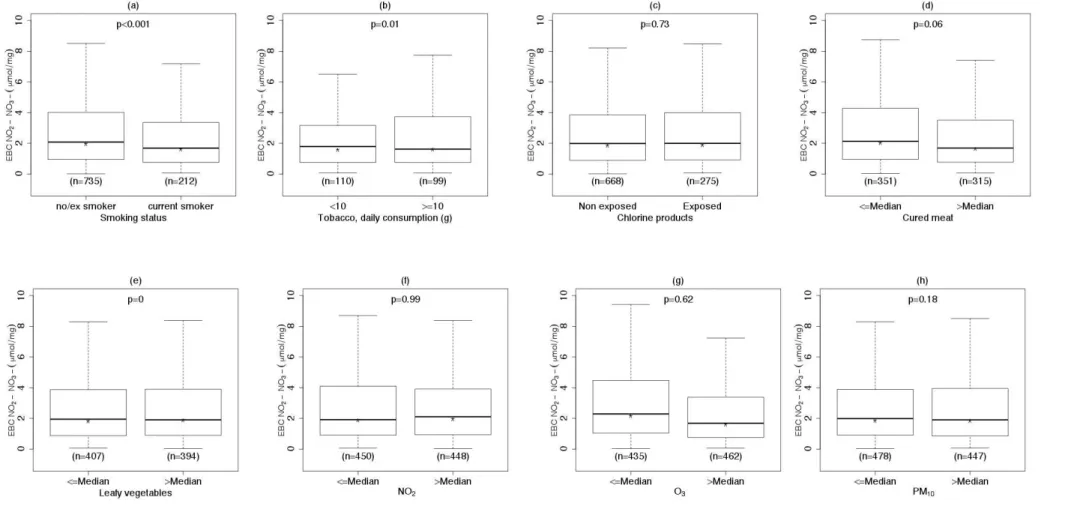
Total EBC NO2−/NO3− levels were lower in current smokers
than in non/ex-smokers, were negatively associated with cured meat consumption and with exposure to O3 and were not
associated with chlorine products, leafy vegetable consumption and NO2 concentration (Table 3 and Figure A.3).
After adjustment for asthma, age, sex and menopausal status, the associations with smoking status, cured meat consumption and exposure to O3 were statistically significant (see Table 3).
When smoking status, cured meat consumption and exposure to O3 were included in the same model, the negative
associations with EBC NO2−/NO3− level remained statistically
significant for smoking status and exposure to O3 (see Table
4). When air pollution concentration of PM10 and O3 were
considered as continuous variables, both slopes were negative and statistically significant, and remained significant after adjustment for asthma, age, sex and menopausal status (results not shown). Total levels of EBC NO2−/NO3− decreased
with high concentration levels of PM10: the median NO2−/NO3−
levels across quartiles of PM10 concentration were 1.9
µmol/mg (Q1- Q3: 0.9, 3.6), 2.0 µmol/mg (Q1-Q3: 0.92, 4.1), 2.5 µmol/mg (Q1-Q3: 1.2, 5.1) and 1.4 µmol/mg (Q1-Q3: 0.7, 2.9). Similar results were observed among non-asthmatics only (results not shown). Including storage time as a covariate in the regression model did not change the associations between smoking and leafy vegetable consumption with NO2−/NO3− level in EBC (results not shown).
4. DISCUSSION
The present study focused for the first time on the associations between four environmental exposures and total NO2−/NO3−
levels measured both in plasma and in EBC among nearly 1000 adults. Total plasma NO2−/NO3− levels were higher in
menopausal women, increased with leafy vegetable consumption, and decreased in current smokers. A similar association with smoking was observed in EBC. Lower levels of total EBC NO2−/NO3− were found in association with
increasing annual ambient concentration concentrations of O3.
The major assets of the study are the sample size, the standardization of the sample collection, the measurements of relevant biological markers and the availability of four different environmental exposures. Measurements of total NO2−/NO3−
levels both in plasma and EBC were consistent with the standard reference values proposed by Ghasemi et al [30] for plasma, and with levels measured in several clinical studies for EBC [31]. The major limitations are the cross-sectional nature of the data and the retrospective ascertainment of exposure to environmental sources. Estimation of ambient NO2
concentrations was not very precise because the air pollution model used (4km x4km) was more appropriate for secondary or long-range pollutants with a relatively homogeneous distribution over longer distances, such as O3 and PM10.
In our study, plasma levels of NO2−/NO3− increased with age
only in women and were higher in menopausal women. Similar findings were observed by Ghasemi et al [32], where the highest upper NO2−/NO3−limits were seen in subjects older
than 50 years (N=1983).
It was hard to disentangle the effect of age and menopause on plasma NO2−/NO3− levels. Watanabe et al [33] observed that
NO2−/NO3− levels increased with age in 118 women, but did not
in 145 men. This result and ours may suggest a role of menopause on plasma NO2−/NO3−levels. Higashino et al [34]
recently suggested that increasing plasma NO2−/NO3− levels in
menopausal women may be due to estrogen deficiency-induced iNOs expression in the vessels of older women, iNOs being one of the three NO synthase isoforms that endogenously produce NO [35]. Unlike plasma, age, menopausal status and sex seem to have no effect on NO2−/NO3− levels in EBC. Similarly, Cruz et al. [36] showed
that neither nitrite nor nitrate measured in EBC varied with age in 75 healthy non-smokers aged 18 to 80 years, and Chladkova et al. [37] found no effect of age on nitrite and nitrate concentrations in EBC of 50 healthy subjects aged 6– 59 years. Overall, these results suggest specificities of NO metabolism in EBC and in plasma.
We found that plasma NO2−/NO3− levels increased with
consumption of leafy vegetables but not of cured meat. Our results regarding leafy vegetables are in agreement with the findings of Lundberg and Govoni [38], who found that inorganic nitrate ingestion led to increased levels of NO2- and NO3- in the
plasma of 9 healthy volunteers. More recently, Zand et al [39] showed that NO dietary supplement twice daily for 30 days increased both levels of NO2- and NO3- in the plasma in 23
patients as compared to 7 controls. The potential beneficial effect of dietary NO3- on health is currently a topic of increasing
interest [40; 41]. Using a randomized crossover study design, Kapil et al [42] showed that nitrate supplementation or vegetable intake (beetroot juice) in the previous 24 hours were associated with a dose-dependent increase in plasma NO2
-and NO3- levels, with a consequent decrease in blood pressure
in 30 healthy volunteers. Previously, inhibition of platelet aggregation and restored endothelial function were observed 3 hours after ingestion of beetroot juice in 14 healthy volunteers [43]. Overall, these results suggest that leafy vegetable consumption may exert its beneficial effect on health partly through an increase in plasma NO2- and NO3- levels.
In our study, we found that exposure to tobacco smoke was negatively associated with both plasma and EBC NO2−/NO3−
levels. These findings are not in agreement with those of Ghasemi et al [15], who reported an increase in serum NO2−/NO3− levels in current smokers compared with non- or
passive smokers in 333 healthy men. Plasma NO2−/NO3−
levels of 35 cigarette smokers were increased when compared to 35 controls in the paper by Padmavathi et al. [44]. A transient increase in NO2−/NO3− levels was also shown by
Balint [7] in EBC after experimental exposure to tobacco smoke. The different covariates taken into account in the multivariate model by Ghasemi et al (body mass index, total cholesterol, triglycerides, 2-h post load glucose, creatinine, systolic blood pressure) may explain the difference with our results. Furthermore, besides differences in the techniques used for EBC collection or analyses, differences in the definition of smokers and in the number of cigarette smoked per day may explain discrepancies between studies.
In the EGEA study, we previously found that both active and passive smoking decreased FeNO levels [22], as observed in other epidemiological studies [10]. The negative association between smoking and FeNO levels is explained by the high concentration of NO in tobacco smoke, which exerts negative feedback on its synthesis [45], and by the downregulation of NO synthase activity in respiratory tract cells [46]. Since NO2−/NO3− and FeNO are both biological markers of the same
pathway, their negative association with smoking may be explained by the same mechanism. The lower plasma and EBC NO2−/NO3− levels observed in smokers compared to ex-
or non-smokers and the negative association with daily tobacco consumption observed in plasma also suggest that the same negative feedback may partly be involved in both compartments. We observed for the first time a decrease in EBC NO2−/NO3− levels according to exposure to O3,
categorized as above/below annual mean. This decrease was of similar magnitude to the decrease in NO2−/NO3− level
observed in current versus non- and ex-smokers. Epidemiological observations on the associations of ambient air pollution with biomarkers in body fluids are still lacking. To our knowledge, there is no other epidemiological study on the effects of air pollution on NO2−/NO3− levels. We did not
evidence any associations of ambient exposure to PM10 or NO2
with plasma or EBC NO2−/NO3− levels, a finding partly at
variance with the results of Shah et al [47] who reported a significant decrease in plasma NO3 levels after acute
controlled exposure to ultrafine carbon particles in 16 subjects. We could have expected an association of ambient NO2
concentrations on NO2−/NO3− levels in body fluids, but it
should be noted that the available estimate of ambient NO2
concentrations in our study was not very precise. Of interest in our study was the availability of EBC measures to evaluate the potential effects of inhaled exposures. Consistent with our findings, a decrease of FeNO levels in exhaled air, a related marker of the same NO pathway, was observed by Liu et al. after acute exposure to O3 in 182 asthmatic children [48]. The
mechanism(s) by which O3 may influence biological markers in
the NO pathway might be an inhibition of NOS activity [49] or through oxidative stress.
Further research is needed on the chronic effects of ambient air pollution on body fluids, particularly EBC, to better understand the associations with respiratory and cardiovascular effects. Overall, the specificities of NO metabolism in plasma and EBC may partly explain our results. They are consistent with the hypotheses of Villanueva et al. [50], for whom such compartmentalized production of NO better explains its different functions and roles in pathophysiology.
5. CONCLUSION
In conclusion, we report for the first time that environmental and behavioral risk factors may modify NO2−/NO3− levels. Our
results suggest specificities of NO metabolism in EBC and in plasma and highlight the importance of studying the same biological marker in different compartments. These findings could have implications for several diseases for which oxidative and nitrosative stresses are involved in their physiopathological pathways. Further studies are needed especially in the general population to better understand which environmental and social factors are related to which biomarkers. This would provide insights into the underlying biological mechanisms of diseases.
ACKNOWLEDGMENTS
The authors thank all those who participated in the study and in the various aspects of the examinations and all those who supervised the study in all centers. The authors are grateful to the three CIC-Inserm units of Necker, Grenoble and Marseille which supported the study and where subjects were examined. They are also grateful to the three biobanks in Lille (CIC-Inserm), Evry (Centre National de Genotypage) and Annemasse (Etablissement francais du sang) where biological samples are stored. They are indebted to all the individuals who participated, without whom the study would not have been possible.
EGEA cooperative group Coordination: F Kauffmann; V Siroux (epidemiology); F Demenais (genetics); I Pin (clinical aspects); R Nadif (biology). Respiratory epidemiology: Inserm U 700, Paris M Korobaeff (Egea1), F Neukirch (Egea1); Inserm U 707, Paris: I Annesi-Maesano; Inserm CESP/U 1018, Villejuif: F Kauffmann, N Le Moual, R Nadif, MP Oryszczyn; Inserm U 823, Grenoble: V Siroux. Genetics: Inserm U 393, Paris : J Feingold ; Inserm U 946, Paris : E Bouzigon , F Demenais, MH Dizier; CNG, Evry : I Gut (now CNAG), M Lathrop (now CEPH/Mc Gill). Clinical centers: Grenoble: I Pin, C Pison; Lyon: D Ecochard (Egea1), F Gormand, Y Pacheco; Marseille: D Charpin (Egea1), D Vervloet; Montpellier: J Bousquet; Paris Cochin: A Lockhart (Egea1), R Matran (now in Lille); Paris Necker: E Paty, P Scheinmann; Paris-Trousseau: A Grimfeld, J Just. Data and quality management: Inserm ex-U155 (Egea1): J Hochez; Inserm CESP/U 1018, Villejuif: N Le Moual, Inserm ex-U780: C Ravault; Inserm ex-U794: N Chateigner; Grenoble: J Ferran.
FUNDING
This research is funded in part by Paris, PHRC-Grenoble, ANR 05-SEST-020-02/05-9-97, ANR-06-CEBS, ANR-CES-2009, Region Nord Pas-de-Calais, Merck Sharp & Dohme (MSD), the GA2LEN project, Global Allergy and Asthma European Network.
References
[1] B.r.S. Rocha, B. Gago, C. Pereira, R.M. Barbosa, S. Bartesaghi, J.O. Lundberg, R. Radi, and J.Â. Laranjinha, Dietary Nitrite in Nitric Oxide Biology: A Redox Interplay with Implications for Pathophysiology and Therapeutics. Curr Drug Targets (2011) -.
[2] J.O. Lundberg, M.T. Gladwin, A. Ahluwalia, N. Benjamin, N.S. Bryan, A. Butler, P. Cabrales, A. Fago, M. Feelisch, P.C. Ford, B.A. Freeman, M. Frenneaux, J. Friedman, M. Kelm, C.G. Kevil, D.B. Kim-Shapiro, A.V. Kozlov, J.J.R. Lancaster, D.J. Lefer, K. McColl, K. McCurry, R.P. Patel, J. Petersson, T. Rassaf, V.P. Reutov, G.B. Richter-Addo, A. Schechter, S. Shiva, K. Tsuchiya, E.E. van Faassen, A.J. Webb, B.S. Zuckerbraun, J.L. Zweier, and E. Weitzberg, Nitrate and nitrite in biology, nutrition and therapeutics. Nat Chem Biol 5 (2009) 865-9.
[3] F.L.M. Ricciardolo, A.D. Stefano, F. Sabatini, and G. Folkerts, Reactive nitrogen species in the respiratory tract. Eur J Pharmacol 533 (2006) 240-252.
[4] J.O. Lundberg, and E. Weitzberg, Biology of nitrogen oxides in the gastrointestinal tract. Gut (2012).
[5] C. Menard, F. Heraud, J.L. Volatier, and J.C. Leblanc, Assessment of dietary exposure of nitrate and nitrite in France. Food Addit Contam Part A Chem Anal Control Expo Risk Assess 25 (2008) 971-988.
[6] W.A. Pryor, and K. Stone, Oxidants in cigarette smoke. Radicals, hydrogen peroxide, peroxynitrate, and peroxynitrite. Ann N Y Acad Sci 686 (1993) 12-27; discussion 27-8.
[7] B. Balint, L.E. Donnelly, T. Hanazawa, S.A. Kharitonov, and P.J. Barnes, Increased nitric oxide metabolites in exhaled breath condensate after exposure to tobacco smoke. Thorax 56 (2001) 456.
[8] J.A. Bernstein, N. Alexis, C. Barnes, I.L. Bernstein, J.A. Bernstein, A. Nel, D. Peden, D. Diaz-Sanchez, S.M. Tarlo, and P.B. Williams, Health effects of air pollution. J Allergy Clin Immunol 114 (2004) 1116-23.
[9] J.G. Martin, H.R. Campbell, H. Iijima, D. Gautrin, J.L. Malo, D.H. Eidelman, Q. Hamid, and K. Maghni, Chlorine-induced injury to the airways in mice. Am J Respir Crit Care Med 168 (2003) 568-74.
[10] S. Karrasch, K. Ernst, J. Behr, J. Heinrich, R.M. Huber, D. Nowak, H.E. Wichmann, S.E. Baumeister, C. Meisinger, K.H. Ladwig, R. Holle, R.A. Jorres, and H. Schulz, Exhaled nitric oxide and influencing factors in a random population sample. Respir Med 105 (2011) 713-8.
[11] K. Berhane, Y. Zhang, W.S. Linn, E.B. Rappaport, T.M. Bastain, M.T. Salam, T. Islam, F. Lurmann, and F.D. Gilliland, The effect of ambient air pollution on exhaled nitric oxide in the Children's Health Study. Eur Respir J 37 (2000) 1029-1036.
[12] M.S. Perzanowski, A. Divjan, R.B. Mellins, S.M. Canfield, M.J. Rosa, G.L. Chew, A. Rundle, I.F. Goldstein, and J.S. Jacobson, Exhaled NO among inner-city children in New York City. J Asthma 47 (2010) 1015-1021.
[13] A.K.M. Fell, N. H, M. Skogstad, K.-C. Nordby, W. Eduard, M.V. Svendsen, R. Ovstebø, A.M.S. Trøseid, and J. Kongerud, A cross-shift study of lung function, exhaled nitric oxide and inflammatory markers in blood in Norwegian cement production workers. Occup Environ Med (2011) -.
[14] M. Gube, J. Ebel, P. Brand, T. Göen, K. Holzinger, U. Reisgen, and T. Kraus, Biological effect markers in exhaled breath condensate and biomonitoring in welders: impact of smoking and protection equipment. Int Arch Occup Environ Health 83 (2010) 803-11.
[15] A. Ghasemi, L. Syedmoradi, A.A. Momenan, S. Zahediasl, and F. Azizi, The influence of cigarette and qalyan (hookah) smoking on serum nitric oxide metabolite concentration. Scand J Clin Lab Invest 70 (2010) 116-121. [16] J.O. Lundberg, and E. Weitzberg, NO-synthase
independent NO generation in mammals. Biochem Biophys Res Commun 396 (2010) 39-45.
[17] J. Hunt, Exhaled breath condensate: an evolving tool for noninvasive evaluation of lung disease. J Allergy Clin Immunol 110 (2002) 28-34.
[18] J. Hunt, Exhaled breath condensate: an overview. Immunol Allergy Clin North Am 27 (2007) 587-96; v. [19] A.M. Fitzpatrick, L.A. Brown, F. Holguin, and W.G.
Teague, Levels of nitric oxide oxidation products are increased in the epithelial lining fluid of children with persistent asthma. J Allergy Clin Immunol 124 (2009) 990-6 e1-9.
[20] F. Kauffmann, and M.H. Dizier, EGEA (Epidemiological study on the Genetics and Environment of Asthma, bronchial hyperresponsiveness and atopy)--design issues. EGEA Co-operative Group. Clin Exp Allergy 25 Suppl 2 (1995) 19-22.
[21] F. Kauffmann, M.H. Dizier, I. Pin, E. Paty, F. Gormand, D. Vervloet, J. Bousquet, F. Neukirch, I. Annesi, M.P. Oryszczyn, M. Lathrop, F. Demenais, A. Lockhart, and J. Feingold, Epidemiological study of the genetics and environment of asthma, bronchial hyperresponsiveness, and atopy: phenotype issues. Am J Respir Crit Care Med 156 (1997) S123-S129.
[22] R. Nadif, R. Matran, J. Maccario, M. Bechet, N. Le Moual, P. Scheinmann, J. Bousquet, F. Kauffmann, and I. Pin, Passive and active smoking and exhaled nitric oxide levels
according to asthma and atopy in adults. Ann Allergy Asthma Immunol 104 (2010) 385-93.
[23] H. Moshage, B. Kok, J.R. Huizenga, and P.L. Jansen, Nitrite and nitrate determinations in plasma: a critical evaluation. Clin Chem 41 (1995) 892-6.
[24] P.K. Smith, Measurement of protein using bicinchoninic acid, 1989, pp. -.
[25] R. Nadif, B. Decoster, H. Huyvaert, G. Briand, N. Le Moual, I. Pin, V. Siroux, R. Varraso, F. Kauffmann, F. Zerimech, and others, Total Nitrate/Nitrite Levels In Plasma And Exhaled Breath Condensate: Associations With Age And Smoking According To Asthma Among 1159 Adults From The EGEA Study. Am J Respir Crit Care Med 181 (2010) -A3109.
[26] C. Bonifacj, M. Gerber, J. Scali, and J.P. Daures, Comparison of dietary assessment methods in a southern French population: use of weighed records, estimated-diet records and a food-frequency questionnaire. Eur J Clin Nutr 51 (1997) 217-231.
[27] E. Rage, V. Siroux, N. Künzli, I. Pin, F. Kauffmann, E.S. on the Genetics, and E. of Asthma, Air pollution and asthma severity in adults. Occup Environ Med 66 (2009) 182-188.
[28] C. Donnay, M.A. Denis, R. Magis, J. Fevotte, N. Massin, O. Dumas, I. Pin, D. Choudat, F. Kauffmann, and N.L. Moual, Under-estimation of self-reported occupational exposure by questionnaire in hospital workers. Occup Environ Med 68 (2011) 611-617.
[29] J.P. Zock, E. Plana, D. Jarvis, J.M. Anto, H. Kromhout, S.M. Kennedy, N. Kunzli, S. Villani, M. Olivieri, K. Toren, K. Radon, J. Sunyer, A. Dahlman-Hoglund, D. Norback, and M. Kogevinas, The use of household cleaning sprays and adult asthma: an international longitudinal study. Am J Respir Crit Care Med 176 (2007) 735-41.
[30] A. Ghasemi, S. Zahediasl, and F. Azizi, Reference values for serum nitric oxide metabolites in an adult population. Clin Biochem 43 (2010) 89-94.
[31] J. Liu, A. Sandrini, M.C. Thurston, D.H. Yates, and P.S. Thomas, Nitric oxide and exhaled breath nitrite/nitrates in chronic obstructive pulmonary disease patients. Respiration 74 (2007) 617-623.
[32] A. Ghasemi, S.Z. Asl, Y. Mehrabi, N. Saadat, and F. Azizi, Serum nitric oxide metabolite levels in a general healthy population: relation to sex and age. Life Sci 83 (2008) 326-331.
[33] T. Watanabe, M. Akishita, K. Toba, K. Kozaki, M. Eto, N. Sugimoto, T. Kiuchi, M. Hashimoto, W. Shirakawa, and Y. Ouchi, Influence of sex and age on serum nitrite/nitrate concentration in healthy subjects. Clin Chim Acta 301 (2000) 169-79.
[34] H. Higashino, H. Miya, H. Mukai, and Y. Miya, Serum nitric oxide metabolite (NO(x)) levels in hypertensive patients at rest: a comparison of age, gender, blood pressure and complications using normotensive controls. Clin Exp Pharmacol Physiol 34 (2007) 725-731.
[35] W.K. Alderton, C.E. Cooper, and R.G. Knowles, Nitric oxide synthases: structure, function and inhibition. Biochem J 357 (2001) 593-615.
[36] M.J. Cruz, S. Sanchez-Vidaurre, P.V. Romero, F. Morell, and X. Munoz, Impact of age on pH, 8-isoprostane, and nitrogen oxides in exhaled breath condensate. Chest 135 (2009) 462-7.
[37] J. Chladkova, I. Krcmova, J. Chladek, P. Cap, S. Micuda, and Y. Hanzalkova, Validation of nitrite and nitrate measurements in exhaled breath condensate. Respiration 73 (2006) 173-9.
[38] J.O. Lundberg, and M. Govoni, Inorganic nitrate is a possible source for systemic generation of nitric oxide. Free Radic Biol Med 37 (2004) 395-400.
[39] J. Zand, F. Lanza, H.K. Garg, and N.S. Bryan, All-natural nitrite and nitrate containing dietary supplement promotes nitric oxide production and reduces triglycerides in humans. Nutr Res 31 (2011) 262-9.
[40] J.J. Sindelar, and A.L. Milkowski, Human safety controversies surrounding nitrate and nitrite in the diet. Nitric Oxide (2012).
[41] F.J. Larsen, T.A. Schiffer, S. Borniquel, K. Sahlin, B.r. Ekblom, J.O. Lundberg, and E. Weitzberg, Dietary
inorganic nitrate improves mitochondrial efficiency in humans. Cell Metab 13 (2011) 149-159.
[42] V. Kapil, A.B. Milsom, M. Okorie, S. Maleki-Toyserkani, F. Akram, F. Rehman, S. Arghandawi, V. Pearl, N. Benjamin, S. Loukogeorgakis, R. Macallister, A.J. Hobbs, A.J. Webb, and A. Ahluwalia, Inorganic nitrate supplementation lowers blood pressure in humans: role for nitrite-derived NO. Hypertension 56 (2010) 274-81.
[43] A.J. Webb, N. Patel, S. Loukogeorgakis, M. Okorie, Z. Aboud, S. Misra, R. Rashid, P. Miall, J. Deanfield, N. Benjamin, R. MacAllister, A.J. Hobbs, and A. Ahluwalia, Acute blood pressure lowering, vasoprotective, and antiplatelet properties of dietary nitrate via bioconversion to nitrite. Hypertension 51 (2008) 784-90.
[44] P. Padmavathi, V.D. Reddy, G. Kavitha, M. Paramahamsa, and N. Varadacharyulu, Chronic cigarette smoking alters erythrocyte membrane lipid composition and properties in male human volunteers. Nitric Oxide 23 (2010) 181-6.
[45] G.M. Buga, J.M. Griscavage, N.E. Rogers, and L.J. Ignarro, Negative feedback regulation of endothelial cell function by nitric oxide. Circ Res 73 (1993) 808-12.
[46] S.A. Kharitonov, R.A. Robbins, D. Yates, V. Keatings, and P.J. Barnes, Acute and chronic effects of cigarette smoking on exhaled nitric oxide. Am J Respir Crit Care Med 152 (1995) 609-12.
[47] A.P. Shah, A.P. Pietropaoli, L.M. Frasier, D.M. Speers, D.C. Chalupa, J.M. Delehanty, L.-S. Huang, M.J. Utell, and M.W. Frampton, Effect of inhaled carbon ultrafine particles on reactive hyperemia in healthy human subjects. Environ Health Perspect 116 (2008) 375-380.
[48] L. Liu, R. Poon, L. Chen, A.-M. Frescura, P. Montuschi, G. Ciabattoni, A. Wheeler, and R. Dales, Acute effects of air pollution on pulmonary function, airway inflammation, and oxidative stress in asthmatic children. Environ Health Perspect 117 (2009) 668-674.
[49] H. Inoue, H. Aizawa, H. Nakano, K. Matsumoto, K. Kuwano, J.A. Nadel, and N. Hara, Nitric oxide synthase inhibitors attenuate ozone-induced airway inflammation in guinea pigs. Possible role of interleukin-8. Am J Respir Crit Care Med 161 (2000) 249-256.
[50] C. Villanueva, and C. Giulivi, Subcellular and cellular locations of nitric oxide synthase isoforms as determinants of health and disease. Free Radic Biol Med 49 (2010) 307-316.
Table 1. Subjects’ Characteristics Stratified by Asthma and Sex. EGEA Study, France, Second Survey, 2003-2007
All subjects
Stratified by asthma
Stratified by sex
Characteristics
(N=949)
Non
Asthmatics
(N=524)
Asthmatics
(N=425)
P-
value
aMales
(N=457)
Females
(N=492)
P-
value
aSex (men), %
48.2
43.9
53.4
0.01
Age groups (years), %
15-24
21.2
12.8
31.5
<.001
23.9
18.7
25-34
18.5
16.6
20.9
17.9
19.1
35-44
11.5
13.4
9.2
10.1
12.8
45-54
21.2
24.8
16.7
19.5
22.8
>=55
27.6
32.4
21.6
28.7
26.6
Menopausal status
b, %
36.1
41.1
28.7
-
36.1
Smoking status, %
Non/ex-smokers
77.6
79.7
75.1
0.99
74.8
80.2
0.06
Current smokers
22.4
20.3
24.9
25.2
19.8
Tobacco,
daily consumption
c, %
<10g/day
52.6
56.3
49.1
0.43
50.9
54.6
0.70
10-20g/day
33.0
28.2
37.7
34.8
30.9
>20g/day
14.4
15.5
13.2
13.9
43.4
Food intake,
Median (Q1-Q3)
Cured meat (serving/day)
0.14 (0.07,
0.21)
0.14 (0.07,
0.21)
0.14 (0.07,
0.28)
<.001
0.2
(0.1,
0.3)
0.1 (0,
0.2)
<.001
Leafy vegetables
(serving/day)
0.8 (0.4, 1.1)
0.9 (0.5,
1.1)
0.6 (0.4,
1.1)
0.83
3.1
(2.0,
4.4)
3.8 (2.6,
5.2)
<.001
Exposure to chlorine
products, %
29.2
30.0
28.1
0.43
0.6
(0.4,
1.1)
0.9 (0.5,
1.2)
<.001
Air pollutant exposure,
Median (Q1-Q3)
NO
2(µg/m
3)
34.5 (26.3,
38.0)
35.0 (27.3,
39.9)
32.3 (24.6,
38.0)
0.001
34.4
(26.5,
38.0)
34.6
(26.3,
39.9)
0.55
O
3(µg/m
3)
44.1 (41.0,
50.3)
43.6 (40.7,
50.0)
45.1 (41.0,
51.3)
0.04
43.9
(41.3,
49.9)
44.1
(40.7,
51.6)
0.46
PM
10(µg/m
3)
20.6 (18.8,
21.6)
20.8 (19.5,
21.7)
20.5 (18.4,
21.4)
0.18
20.6
(18.6,
21.6)
20.6
(19.0,
21.4)
0.88
Nitrite/nitrate concentration, Median (Q1-Q3)
In plasma (µM)
36.3 (25.7,
51.1)
35.5 (24.2,
51.2)
37.0 (26.8,
51.1)
0.42
36.5
(25.9,
50.4)
36.0
(25.4,
52.3)
0.75
In EBC (µmol/µg)
2.0 (0.9, 3.9)
2.0 (0.9,
3.9)
2.0 (0.9,
4.0)
0.54
1.9
(0.8,
3.6)
2.1 (1.0,
4.1)
0.08
Abbreviations: CI, Confidence Interval; NO
2, Nitrogen Dioxide; O
3, Ozone; PM
10, Particulate Matter; Q, quartile.
aExcept for age group, all p values were adjusted for age (considering age continuously)
b
Among females (N=492)
cAmong current smokers (N=209)
Table 2. Association between Plasma Total NO
2−/NO
3−Level and Environmental Exposures. EGEA Study, France,
Second Survey, 2003-2007
n
β
a95%CI
aP-value
aβ
b95%Ci
bP-value
bAge (years, continuous)
949
0.002
0.001, 0.003
0.001
Pre-menopausal women, vs. men
308/457
-0.03
-0.06, 0.002
0.07
Post-menopausal women, vs. men 174/457
0.05
0.007, 0.09
0.02
Current smokers, vs.
non/ex-smokers
212/735
-0.08
-0.12, -0.05
<0.001
-0.07
-0.10, -0.03
<0.001
Tobacco daily consumption
c, >=10
g/day
99/110
-0.07
-0.13, -0.02
0.01
-0.07
-0.13, -0.02
0.004
Cured meat (serving/day)
d807
-0.03
-0.06, 0.01
0.11
-0.03
-0.06, 0.01
0.17
Leafy vegetables (serving/day)
d807
0.04
0.01, 0.07
0.02
0.03
-0.003, 0.07
0.07
Exposure to chlorine products
275/668
-0.01
-0.04, 0.03
0.73
-0.02
-0.06, 0.02
0.28
NO
2(µg/m
3)
d899
-0.01
-0.04, 0.03
0.68 -0.004
-0.04, 0.03
0.85
O
3(µg/m
3)
d926 -0.001
-0.03, 0.03
0.96
-0.01
-0.05, 0.03
0.60
PM
10(µg/m
3)
d926
-0.02
-0.05, 0.02
0.34
-0.02
-0.05, 0.02
0.29
Abbreviations: CI, Confidence Interval; NO
2, Nitrogen Dioxide; O
3, Ozone; PM
10, Particulate Matter;
aEstimates for the association between total NO
2−
/NO
3−and each exposure adjusted for asthma
bEstimates for the association between total NO
2−
/NO
3−and each exposure adjusted for asthma, age and menopausal
status;
c
Among current smokers (N=209)
d
Continuous exposures included as dichotomous variables (above/below median)
Table 3. Association between EBC Total NO
2−/NO
3−Level and Environmental Exposures. EGEA Study, Second Survey,
2003-2007
Exposure variables
n
β
a95%CI
aP-value
aβ
b95%Ci
bP-value
bAge (years, continuous)
949
-0.0001
-0.002, 0.002
1.00
Pre-menopausal women, vs.
men
308/457
-0.06
-0.01, 0.1
0.09
Post-menopausal women,
vs. men
174/457
0.06
-0.02, 0.14
0.10
Current smokers, vs.
non/ex-smokers
212/735
-0.1
-0.18, -0.02
0.01 -0.10
-0.17, -0.02
0.01
Tobacco daily consumption
c,
>=10 g/day
99/110
0.009
-0.13, 0.15
0.90 0.01
-0.13, 0.15
0.91
Cured meat (serving/day)
d807
-0.08
-0.15, -0.01
0.04 -0.07
-0.14, -0.003
0.04
Leafy vegetables
(serving/day)
d807
-0.009
-0.08, 0.06
0.79 -0.01
-0.08, 0.06
0.77
Exposure to chlorine
products
275/668
0.007
-0.06, 0.08
0.85 -0.02
-0.06, 0.02
0.27
NO
2(µg/m
3)
d899
-0.002
-0.07, 0.07
0.96 0
-0.07, 0.07
0.98
O
3(µg/m
3)
d926
-0.14
-0.20, -0.07
<0.001 -0.14
-0.21, -0.07
<0.001
PM
10(µg/m
3)
d926
-0.02
-0.09, 0.05
0.62 -0.02
-0.09, 0.05
0.70
Abbreviations: CI, Confidence Interval; NO
2, Nitrogen Dioxide; O
3, Ozone; PM
10, Particulate Matter;
aEstimates for the association between total NO
2−
/NO
3−and each exposure adjusted for asthma
bEstimates for the association between total NO
2−
/NO
3−and each exposure adjusted for asthma, age and menopausal
status;
c
Among current smokers (N=209)
Table 4. Multivariate Regression Model for the Association between Selected Environmental Exposures and Total
NO
2−/NO
3−Levels in Plasma and EBC. EGEA Study, Second Survey, 2003-2007
Exposure variables
Plasma (N=797)
EBC (N=625)
β
95%CI
P-value
β
95%CI
P-value
Asthma
0.05
-0.02, 0.05
0.40
0.001
-0.07, 0.07
0.99
Age (years, continuous)
0.0002
-0.001, 0.001
0.80
-0.001
-0.003, 0.002
0.56
Pre-menopausal women, vs. men
-0.04
-0.08, -0.004
0.03
0.02
-0.07, 0.10
0.71
Post-menopausal women, vs. men
0.02
-0.02, 0.07
0.33
0.04
-0.06, 0.13
0.45
Current smokers, vs. non/ex-smokers
a-0.08
-0.11, -0.04 <0.001
-0.08
-0.16, -0.001
0.05
Leafy vegetable consumption
(serving/day), >median
0.04
0.001, 0.07
0.04
Cured meat
(serving/day)
b, >median
-0.06
-0.14, 0.01
0.09
O
3(µg/m
3)
b, >median
-0.10
-0.17, -0.03
0.01
Abbreviations: CI, Confidence Interval; NO
2, Nitrogen Dioxide; O
3, Ozone; EBC, Exhaled Breath Condensate
aincluded only in the multivariate model for NO
2−