HAL Id: hal-00300888
https://hal.archives-ouvertes.fr/hal-00300888
Submitted on 3 Feb 2003HAL is a multi-disciplinary open access
archive for the deposit and dissemination of sci-entific research documents, whether they are pub-lished or not. The documents may come from teaching and research institutions in France or abroad, or from public or private research centers.
L’archive ouverte pluridisciplinaire HAL, est destinée au dépôt et à la diffusion de documents scientifiques de niveau recherche, publiés ou non, émanant des établissements d’enseignement et de recherche français ou étrangers, des laboratoires publics ou privés.
Lidar and in situ observations of continental and
Saharan aerosol: closure analysis of particles optical and
physical properties
G. P. Gobbi, F. Barnaba, R. van Dingenen, J. P. Putaud, M. Mircea, M. C.
Facchini
To cite this version:
G. P. Gobbi, F. Barnaba, R. van Dingenen, J. P. Putaud, M. Mircea, et al.. Lidar and in situ observations of continental and Saharan aerosol: closure analysis of particles optical and physical properties. Atmospheric Chemistry and Physics Discussions, European Geosciences Union, 2003, 3 (1), pp.445-477. �hal-00300888�
ACPD
3, 445–477, 2003
Lidar and in situ observations of continental and Saharan aerosol G. P. Gobbi et al. Title Page Abstract Introduction Conclusions References Tables Figures J I J I Back Close
Full Screen / Esc
Print Version Interactive Discussion
c
EGU 2003
Atmos. Chem. Phys. Discuss., 3, 445–477, 2003 www.atmos-chem-phys.org/acpd/3/445/
c
European Geosciences Union 2003
Atmospheric Chemistry and Physics Discussions
Lidar and in situ observations of
continental and Saharan aerosol: closure
analysis of particles optical and physical
properties
G. P. Gobbi1, F. Barnaba1, R. Van Dingenen2, J. P. Putaud2, M. Mircea3, and M. C. Facchini3
1
Istituto di Scienze dell’Atmosfera e del Clima-CNR, Roma, Italy
2
European Commission Joint Research Centre, Ispra, Italy
3
Istituto di Scienze dell’Atmosfera e del Clima-CNR, Bologna, Italy
Received: 29 October 2002 – Accepted: 14 January 2003 – Published: 3 February 2003 Correspondence to: G. P. Gobbi (g.gobbi@isac.cnr.it)
ACPD
3, 445–477, 2003
Lidar and in situ observations of continental and Saharan aerosol G. P. Gobbi et al. Title Page Abstract Introduction Conclusions References Tables Figures J I J I Back Close
Full Screen / Esc
Print Version Interactive Discussion
c
EGU 2003
Abstract
Single wavelength polarization lidar observations collected at Mt. Cimone (44.2◦N, 10.7◦E, 1870 m a.s.l.) during the June 2000 MINATROC campaign are analyzed to derive tropospheric profiles of aerosol extinction, depolarization, surface area and vol-ume. Lidar retrievals for the 2170–2245 m level are compared to the same variables as
5
computed from in situ measurements of particles size distributions, performed at the mountain top Station (2165 m a.s.l.) by a differential mobility analyzer (DMA) and an optical particle counter (OPC). A sensitivity analysis of this closure experiment shows that mean relative differences between the backscatter coefficients obtained by the two techniques undergo a 30% decrease when hygroscopic growth to ambient humidity is
10
considered for the DMA dataset, otherwise representative of dry aerosols. Minimiza-tion of differences between lidar and size distribution-derived backscatter coefficients allowed to find values of the “best” refractive index, specific to each measurement. These results show the refractive index to increase for air masses proceeding from ei-ther continental Europe or Africa with respect to Mediterranean air. Lidar depolarization
15
was observed to minimize mainly in airmasses proceeding from Western Europe, thus indicating a spherical, i.e. liquid nature for such aerosols. This analysis shows aver-age relative differences between lidar and in-situ observations of 10% for backscatter, 37% for extinction and 44% for surface area and volume. These values are within the expected combined errors of the lidar and in situ retrievals. However, average
20
differences strongly decrease during the Saharan dust transport event, when a lidar signal inversion model considering non-spherical scatterers is employed. The closure obtained between particle counter and lidar-derived aerosol surface area and volume constitutes a validation of the technique providing the latter estimates on the basis of single-wavelength lidar observations.
ACPD
3, 445–477, 2003
Lidar and in situ observations of continental and Saharan aerosol G. P. Gobbi et al. Title Page Abstract Introduction Conclusions References Tables Figures J I J I Back Close
Full Screen / Esc
Print Version Interactive Discussion
c
EGU 2003
1. Introduction
Atmospheric aerosols play a crucial role in determining the Earth radiation balance via two different mechanisms: 1) scattering and absorbing both solar and thermal ra-diation, 2) acting as cloud condensation nuclei. The radiative forcing anthropogenic aerosols enact via these two mechanisms (in particular the second one) is currently
5
evaluated to be opposite in sign but of the same order and in some regions even larger than the forcing due to current greenhouse gases (e.g. Ramanathan et al., 2001). Also through mechanism (2), in particular by increasing the number of sus-pended cloud droplets, anthropogenic contribution to aerosol concentrations can inhibit precipitation, therefore modifying the hydrological cycle (Rosenfeld et al., 1999).
Fur-10
thermore, aerosols provide airborne reactive surfaces for the heterogeneous chemistry processes leading to changes in atmospheric composition (e. g. Jacob, 2000, Balka-nski et al., this issue). Understanding of these processes is still considered to be very low (e.g. Houghton et al., 2001). An improved global picture of atmospheric aerosols and related processes is therefore needed to better address some of the fundamental
15
mechanisms controlling the Earth climate.
In situ observations play a key role in building the picture of airborne particulate matter. This is because the microphysical and chemical properties of aerosol parti-cles necessary to invert remote sensing (satellite, lidar, sunphotometer) retrievals are mainly determined by means of these techniques (e.g. Raes et al., 2000). While
cur-20
rent satellite passive radiometry experiments start providing global (land and ocean) column contents (e.g. Kaufman et al., 2002), lidars (laser radars) remain best suited at retrieving vertical profiles of atmospheric aerosols. In fact, in the near future elastic backscatter lidars will be flown onboard space platforms by both NASA (Calipso) and ESA (Earthcare). A quantitative retrieval of aerosol properties by these lidars requires
25
the use of specific algorithms and assumptions. These might lead to rather large er-rors if erroneously applied (e.g. Karyampudi et al., 1999; Gobbi et al., 2002). Relevant results need then to be validated against in situ or complementary observations.
ACPD
3, 445–477, 2003
Lidar and in situ observations of continental and Saharan aerosol G. P. Gobbi et al. Title Page Abstract Introduction Conclusions References Tables Figures J I J I Back Close
Full Screen / Esc
Print Version Interactive Discussion
c
EGU 2003
In this paper we shall compare and discuss lidar and in situ particle size distribution measurements simultaneously collected during an experimental campaign character-ized by both continental and Saharan aerosol conditions. The instrumental set up and measurement schemes will be described in Sect. 2. In Sect. 3 we shall present and discuss the evolution of the vertical profiles of aerosol extinction, depolarization,
sur-5
face area and volume retrieved by the single-wavelength, polarization lidar system. Finally, in Sect. 4 we shall compare lidar retrievals of aerosol surface area, volume, backscatter and extinction for the 2170–2245 m level to equivalent retrievals computed from observations in situ particle counters carried-out at that altitude. The latter anal-ysis will provide both the best refractive index of the observed aerosols and a closure
10
experiment between lidar and particle counter-derived surface area and volume obser-vations.
2. Methods
The European Union (EU) Mineral dust and Tropospheric Chemistry (MINATROC) campaign was carried out at the Mt. Cimone Station (44.2◦N, 10.7◦E, 2165 m a.s.l.)
15
between 1 June and 5 July 2000 (Balkanski et al., this issue). In addition to atmospheric chemistry measurements, aerosol observations were carried out by means of particle sizing instrumentation, by impactors, by optical nephelometer and aethalometer and by the Vehicle-mounted Lidar System (VELIS). For the purposes of our analysis, we shall combine particle size distribution and composition results, together with the VELIS lidar
20
measurements. We start with providing an outline of the observational methods. 2.1. The VELIS lidar
VELIS is a compact, mobile polarization lidar designed to provide day and night-time profiles of atmospheric aerosols starting 150 m from the system and up to the lower stratosphere. VELIS has been developed at the Institute for Sciences of the
ACPD
3, 445–477, 2003
Lidar and in situ observations of continental and Saharan aerosol G. P. Gobbi et al. Title Page Abstract Introduction Conclusions References Tables Figures J I J I Back Close
Full Screen / Esc
Print Version Interactive Discussion
c
EGU 2003
sphere and Climate (ISAC) of the Italian Research Council (CNR) in Rome (Gobbi et al., 2000). The lidar emitter is based on a frequency doubled (532 nm) Nd:YAG laser, generating plane-polarized, 100 mJ pulses at 15 Hz. A two-receiver configuration is employed to cope with the high dynamic range of the returning signal: a 10 cm tele-scope for the near range (150–2000 m from the system) and a 25 cm one for the far
5
range (1.5–20 km). Below 150 m the signal is corrected to account for the incomplete geometrical superposition between the laser beam and the telescope field of view at these levels.
The atmospheric backscatter signal is detected by photomultipliers and digitized by photon counting devices. Relative to the polarized laser emission, each receiver
de-10
tects both parallel, S//, and perpendicular, S⊥, polarization signals. Here S represents the backscatter signal generated by atmospheric molecules Sm and aerosols Sa (S = Sm + Sa), after subtraction of the background noise. Since non-spherical particles
introduce some degree of depolarization in the light they backscatter while spherical particles do not, the linear depolarization ratio D = S⊥/S// allows to discriminate
liq-15
uid (spherical) from solid (non-spherical) particles (e.g. Gobbi, 1998). Aerosol-induced depolarization Da= Sa⊥/Sa//(that is the ratio between the aerosol-generated orthogo-nal sigorthogo-nals) represents a further step in studying the solid versus liquid aerosol phases (e.g. Gobbi et al., 2000).
The lidar signal of a specific altitude z, is generated by the backscatter of
atmo-20
spheric molecules and aerosols present at that level and extinguished (by the same constituents) on its way back to the receiver. Assuming that molecular density pro-files are known (via either radiosonde or model data), the lidar equation, relating the signal to its atmospheric causes, then contains the two unknowns βaand σa, i.e. the aerosol backscatter and extinction coefficients, respectively (e.g. Measures, 1984). A
25
relationship between aerosol extinction and backscatter is then needed to solve this equation (e.g. Klett, 1985). Our analysis of the VELIS observations is performed by employing model-derived relationships σa = f (βa) specific to the aerosol types being observed (e.g. Barnaba and Gobbi, 2001). The lidar equation is therefore solved by
ACPD
3, 445–477, 2003
Lidar and in situ observations of continental and Saharan aerosol G. P. Gobbi et al. Title Page Abstract Introduction Conclusions References Tables Figures J I J I Back Close
Full Screen / Esc
Print Version Interactive Discussion
c
EGU 2003
means of an iteration-convergence procedure: 1) The lidar trace is calibrated against a model atmosphere at an aerosol-free level; 2) the aerosol backscatter βa at each measurement point is determined; 3) the aerosol extinction σa at each measurement point is obtained from the model on the basis of the aerosol backscatter βacomputed at step 2; 4) at each measurement point the signal is corrected for both the aerosol
5
and molecular extinction encountered below that point; 5) steps 1–4 are iterated until convergence is reached.
To analyze VELIS data collected during the Mt. Cimone campaign, σa = f (βa) re-lationships for continental aerosols (Barnaba and Gobbi, 2002) and for Saharan dust (Barnaba and Gobbi, 2001) have been employed. This is justified by the dominating
10
aerosol types being identified on the basis of backtrajectories as mainly continental in the period 1 June – 2 July and as Saharan dust in the period 3–5 July (e.g. Van Din-genen et al., this issue). Once backscatter profiles are retrieved, the backscatter ratio
R = (βa+ βm)/βm can be computed. This parameter is very useful in determining the relative contributions of molecules and aerosols to the total atmospheric backscatter.
15
Aerosol surface area, Sa, and volume, Va, profiles are estimated by relationships (Sa = f (βa) and Va = f (βa)) relating these parameters to backscatter coefficients and provided by the same aerosol models. In the case of Saharan dust, the functional rela-tionships σa = f (βa) and Sa = f (βa) computed for non-spherical particles representa-tive of mineral dust will be employed (Gobbi et al., 2002). Since the volume-backscatter
20
relationship Va = f (βa) is not available for non-spherical dust particles (Barnaba and Gobbi, 2001), volume estimates will be performed on the basis of the spherical (Mie) model for both continental and Saharan aerosols. In Sect. 4 we shall discuss in depth the relevant results and the effects of non-sphericity on retrieved aerosol optical and physical properties.
25
During the campaign, VELIS was located at Pian Cavallaro (1870 m a.s.l.), about 300 m below and 300 m apart from the Mt. Cimone Station (2165 m a.s.l.) where the aerosol in situ observations were performed. VELIS collected aerosol profiles in the period 2 June – 4 July 2000. Both day and night-time observations employed in this
ACPD
3, 445–477, 2003
Lidar and in situ observations of continental and Saharan aerosol G. P. Gobbi et al. Title Page Abstract Introduction Conclusions References Tables Figures J I J I Back Close
Full Screen / Esc
Print Version Interactive Discussion
c
EGU 2003
paper are the result of 5-min averages, at 75 m vertical resolution. 2.2. The particle sizing instrumentation
Instrumentation for the in-situ particle size distribution measurements deployed by the European Commission Joint Research Center (JRC) is described in detail by Van Din-genen et al., this issue. Aerosol number size distributions in the 6–600 nm dry size
5
range were measured by a custom-built Vienna type DMA (length 28 cm), using a TSI CPC model 3010 as particle counter. It is important to note that these size distribu-tions were obtained in dry sheath air condidistribu-tions, hence particles are reduced to their dry size when measured. Number size distributions in the size range 0.3–10 µm were measured with an optical particle counter (OPC, GRIMM model 1.108). The optical
ar-10
rangement inside the instrument is such that the scattered light is detected at an angle of 90±30◦.
Unlike the DMA sampling, the aerosol entering the OPC was not dried. The OPC sizing is based on a calibration with latex spheres, performed by the manufacturer. Siz-ing of non-spherical dust particles implies uncertainties which are difficult to quantify.
15
Mishchenko et al. (1997) calculated ratios for non-spherical to spherical phase func-tions for scattering angles from 60◦ to 120◦ to be in the range 0.8 to 1.8, at 90◦ the ratio being near 1.2. Overall, some overestimation might affect the size retrieval in the presence of non-spherical particles.
3. Lidar profiles during MINATROC
20
An overview of the lidar retrievals collected during the Mt. Cimone campaign is given in Fig. 1. Here are reported the contour plots of the 532 nm extinction coefficient σa (Fig. 1a), depolarization ratio D (Fig. 1b), surface area (Fig. 1c) and volume (Fig. 1d), respectively. These plots allow to see both the maximum height reached by aerosols and the presence of a daily cycle. The latter is nicely evidenced in the depolarization
25
ACPD
3, 445–477, 2003
Lidar and in situ observations of continental and Saharan aerosol G. P. Gobbi et al. Title Page Abstract Introduction Conclusions References Tables Figures J I J I Back Close
Full Screen / Esc
Print Version Interactive Discussion
c
EGU 2003
record of Fig. 1b. In general, both features were determined by the daily inflation of the planetary boundary layer (PBL) and aerosols are observed to reach maximum heights of approximately 3 km in the second half of the day. Several different conditions are noticed to be superimposed to this general behavior, markedly in the periods 4–11 June, 28 June and 2–5 July (days 32–35), when aerosols were detected up to 5–8 km
5
altitudes. In these cases backtrajectories (Van Dingenen, personal communication, 2002) together with high depolarization values reveal that these airmasses proceeded from Africa and contained dust. Most of the PBL aerosol presented some depolariza-tion, i.e. it contained some non-spherical particles. However, a marked decrease in depolarization is observed in the period 24–31 June, mainly characterized by
trans-10
port from Western Europe. We shall further discuss these issues in Sect. 4. Amongst the episodes of Saharan dust transport detected by VELIS, the only one that clearly reached down to the station was observed at the beginning of July 2000. In fact, in the period 6–9 June, when dust was observed aloft, aerosol extinction was compara-ble and depolarization was even higher than during the period 3–4 July. However, the
15
depolarization plot of the June events (Fig. 1b) clearly shows the features of PBL and Saharan aerosols to remain separated, with most of the dust confined to levels above 3 km, i.e. higher than the Mt. Cimone Station. This is consistent with in situ OPC mea-surements, which did not indicate any significant increase in coarse particles at that time. Conversely, a progressive lowering of the dust layer clearly starts on 2 July (day
20
32). In fact, the arrival of mineral particles at the station was detected in the afternoon of 3 July, well in agreement with the descent of the 8% depolarization contour at that level. This dust event reached up to about 8 km altitude with maximum backscatter ratio of the order of R = 5. However, maximum values of depolarization were of the order of D= 15%, i.e. much lower than the typical dry dust depolarization of D = 45%
25
(e.g. Gobbi et al., 2000), as observed between 3 and 5 km on 6 June. This behavior is possibly explained by the combined presence of a rather large soluble fraction (of the order of 50%, Putaud et al., this issue) and RH levels larger than 50% which could sustain the condensation of a liquid aerosol phase. As a matter of fact, cloud
conden-ACPD
3, 445–477, 2003
Lidar and in situ observations of continental and Saharan aerosol G. P. Gobbi et al. Title Page Abstract Introduction Conclusions References Tables Figures J I J I Back Close
Full Screen / Esc
Print Version Interactive Discussion
c
EGU 2003
sation occurred between 3 and 5 km altitude during the whole night between 3 and 4 July.
Plots of aerosol surface area and volume (Figs. 1c and 1d) depict a behavior similar to the one of extinction (Fig. 1a). These results show maximum values in both aerosol surface area and volume to be associated with dust events, with concentrations of
5
the order of 500 µm2cm−3 and 30 µm3cm−3, respectively. Considering that volume is underestimated in the presence of non-spherical particles, these results indicate the dust events crossing over Mt. Cimone (that is at about 2500 km from the source) to be characterized by contents of at least 10–30 µm3cm−3 (that converts to approximately 25–75 µg m−3) extending all the way up to 6 km altitude. In the following section, we
10
shall address in detail all these aerosol properties by comparing lidar observations and in situ aerosol samplings of air masses located at the Mt. Cimone Station level.
4. Lidar-particle counters comparisons at the Mt. Cimone Station level
In this comparison we employ lidar retrievals for the 75 m height bin spanning the re-gion 2170–2245 m a.s.l. together with size distributions observed by the DMA and OPC
15
instruments at the Station level (2165 m a.s.l.) within 30 min from the lidar measure-ment. Size distributions are employed to compute aerosol surface area and volume, plus backscatter and extinction coefficients at the lidar wavelength of 532 nm. These optical properties have been computed by means of a Mie scattering code at fourteen different values of the refractive index m = 1.30–0.0i, 1.33–0.0i, 1.35–0.0i, 1.4–0.0i,
20
1.40–5×10⁻³i, 1.45–0.0i, 1.45–5×10⁻³i, 1.45–0.01i, 1.50–0.0i, 1.50–5× 10⁻³i, 1.50– 0.01i, 1.55–0.0i, 1.55–5× 10⁻³i, and 1.55–0.01i. These values have been selected to represent the full variability range of aerosol composition from pure water droplets (m = 1.33–0.0i) to mineral dust grains m = 1.55–0.01i (e.g. d’Almeida et al., 1991). The boundary value m= 1.30–0.0i has been included to check for results outside the
ex-25
pected range. Use of the Mie theory implies considering particles as spherical. While such an assumption is rather good in the case of hygroscopic aerosols, it might lead
ACPD
3, 445–477, 2003
Lidar and in situ observations of continental and Saharan aerosol G. P. Gobbi et al. Title Page Abstract Introduction Conclusions References Tables Figures J I J I Back Close
Full Screen / Esc
Print Version Interactive Discussion
c
EGU 2003
to a strong overestimation of backscatter and to a slight underestimation of extinction in the case of non-spherical particles as soot or mineral dust (Mishchenko et al., 1997; Gobbi et al., 2002). As mentioned, we shall use a non-spherical scattering model to invert lidar traces of Saharan dust but a spherical scattering model for continental aerosols. Nevertheless, we shall use lidar depolarization information to flag possible
5
sources of inconsistencies by indicating when non-spherical particles are affecting the signal.
4.1. RH-correction of observed particle size
Since DMA size distributions are provided for dry particles, physical and optical proper-ties computed using these size distributions should be converted to ambient conditions
10
to allow for comparison with lidar data. To account for such an effect, we have used a semi-empirical hygroscopic growth model parameterized by using the K ¨ohler the-ory and size-resolved measurements (from impactor filters) of chemical composition of the aerosol (Putaud et al., this issue). The hygroscopic growth model considered in the present study relates the wet aerosol diameter Dwet at a given ambient
rela-15
tive humidity RH to the dry aerosol diameter Ddry by means of an expression of the form: Dwet = Ddrya exp(b∗RH), where RH is expressed in % and a, b are constants
depending on the particle size and chemical composition. Analysis of the chemical composition of aerosols, in particular for water soluble inorganic and organic species, shows important changes in both the percentage and the ionic composition from one
20
air mass to the other, as well as from one size range to another within the same air mass. Therefore, for each air mass type (e.g. Sect. 4.3) we have determined di ffer-ent constants a and b for each Berner impactor stage by fitting the mean wet aerosol diameter computed by the K ¨ohler theory as a function of relative humidity. At a given relative humidity, the mean wet aerosol diameter of a given impactor stage then
rep-25
resents the mean of the wet diameters computed by means of the K ¨ohler theory from the DMA dry diameter measurements enclosed in that stage. In the present calcula-tions, the aerosol in the DMA size range was assumed to be internally mixed (e.g. Van
ACPD
3, 445–477, 2003
Lidar and in situ observations of continental and Saharan aerosol G. P. Gobbi et al. Title Page Abstract Introduction Conclusions References Tables Figures J I J I Back Close
Full Screen / Esc
Print Version Interactive Discussion
c
EGU 2003
Dingenen et al., this issue), with mean chemical composition corresponding to the one observed in the relevant impactor stage and for the specific air mass. The variation of the surface tension with concentration of moles of carbon (Facchini et al., 1999) was also considered.
All size distribution-derived physical quantities (i.e. surface area, volume,
backscat-5
ter and extinction coefficients) have been computed for both RH-corrected and non corrected size distributions. Results of these computations and their comparisons with lidar retrievals obtained at the most 30 min apart from the size distribution measure-ment are discussed hereafter.
4.2. Backscatter and extinction: sensitivity to RH and refractive index
10
Minimum and maximum backscatter coefficients obtained from Mie calculations are reported in Fig. 2a for non corrected data and in Fig. 2b for RH-corrected data, re-spectively. Both figures show backscatter coefficients to approximately double when switching from lower (m= 1.33–0.0i) to maximum value (m = 1.55–0.0i) of the refrac-tive index. Lidar-measured backscatter coefficients are also plotted in these figures
15
as black dots. Comparison of Figs. 2a and 2b clearly shows that the best agreement between lidar and size distribution-derived aerosol backscatter is achieved when the
RH-correction is applied. In this case most of the lidar observations fall within the
backscatter range determined by refractive index variability. This result is quantified by the analysis of average, module relative differences:
20
d βa/βa= N−1X
i=1, N(|βVELISi − βJRCi|/βJRCi) (1)
obtained for the different values of the refractive index (N = 148 being the number of considered measurements). In this analysis a minimum of d βa/βa= 0.40 is found for m= 1.45–0.0i in the case of RH-corrected data, while non-corrected data present a
minimum d βa/βa= 0.60, for m = 1.55–0.0i. 25
Values of d βa/βa are representative of the combined average relative error of the two measurements. In this respect, even though levels of d βa/βa = 40% can appear
ACPD
3, 445–477, 2003
Lidar and in situ observations of continental and Saharan aerosol G. P. Gobbi et al. Title Page Abstract Introduction Conclusions References Tables Figures J I J I Back Close
Full Screen / Esc
Print Version Interactive Discussion
c
EGU 2003
quite large, we should consider that this is the agreement to be expect when employing a single refractive index (m= 1.45–0.0i) for the whole campaign. Next to that minimum value, relative differences of 41–42% were observed for m = 1.40–0.0i, and m = 1.45– 0.005i, differences of 43–46% for m = 1.45–0.01i and all the m = 1.50-Xi indices (with X indicating all the considered imaginary parts). Finally, values d βa/βa > 48% char-5
acterized the remaining values of m. In Sect. 4.3, for each measurement we shall minimize the differences dβi(m) with respect to m to provide an estimate of the refrac-tive index specific to the relevant aerosol type.
The behavior of the extinction coefficient σa as retrieved by the lidar measurement and from the RH-corrected JRC size distributions is presented in Fig. 2c. In this case,
10
a minimum average difference of dσa/σa = 0.52 is found when employing for the
whole campaign refractive index values of either m=1.40-Xi, or m = 1.45-Xi. A similar value (d σa/σa = 0.54) is found for refractive index values of m = 1.50-Xi. Finally, d σa/σa = 0.57 is found for all the m = 1.55-Xi indices. These results indicate that
extinction retrievals are consistent with backscatter ones, but less sensitive to a precise
15
choice of the refractive index. In Sect. 4.3 we shall see how the minimization procedure carried-out to retrieve a time-dependent value of m will also improve the quality of the extinction estimates.
As a campaign average, approximately 20% of all aerosol backscatter and extinc-tion coefficients computed from the RH-corrected size distributions were generated by
20
particles smaller than 0.15 µm in radius. Only a few percent of βa and σa was due to particles larger than 1 µm in the case of continental aerosols. Conversely, in the case of Saharan dust (whose grains were mainly larger than 1 µm) this fraction in-creased to approximately 20% for extinction and 40% for backscatter. These results reveal two noteworthy points: 1) the importance of resolving aerosol size distributions
25
below 0.15 µm (a typical lower threshold of optical particle counters) when evaluating aerosol optical properties, and 2) the error (overestimate) intrinsic to the Mie-computed backscatter in the case of non-spherical particles can be rather large and tending to compensate the possible lack of information about smaller sizes mentioned at point
ACPD
3, 445–477, 2003
Lidar and in situ observations of continental and Saharan aerosol G. P. Gobbi et al. Title Page Abstract Introduction Conclusions References Tables Figures J I J I Back Close
Full Screen / Esc
Print Version Interactive Discussion
c
EGU 2003
(1).
4.3. Airmass origin in relation to depolarization and refractive index
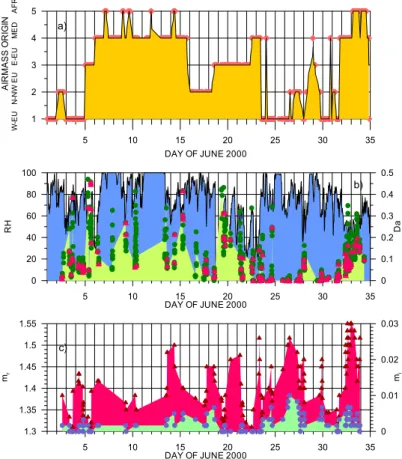
To improve the interpretation of results we plotted in Fig. 3a the origin of the air-masses arriving at the top of Mt. Cimone (2165 m a.s.l.), as obtained by 10-day, three-dimensional backtrajectories computed by the FLEXTRA model (Stohl and Wakowa,
5
1995). They were classified into five categories according to the geographical area overpassed when approaching Mt. Cimone. The backtrajectory information has been parameterized by indicating with 1 air from West Europe, with 2 air from North-NW Eu-rope, with 3 air from Eastern EuEu-rope, with 4 air from the Mediterranean basin and with 5 air from Africa. This plot shows that airmasses originated from the
Mediterranean-10
African regions in the periods 6–15 June and 2–5 July 2000. The remaining periods were characterized by air mainly proceeding from Eastern Europe (5 June and 19–22 June) and Western Europe (3–4 June, 24–26 and 30). In Fig. 3b we plot the behavior of relative humidity (RH) as measured at the Station level (Bonasoni, personal commu-nication, 2001), together with the aerosol depolarization ratio Da, observed by VELIS
15
at that level.
Analysis of these plots shows lower values of depolarization to be mainly linked to airmassess arriving from Western and N-NW Europe, an effect particularly evident in the period 2–5 and 25–31 June. Conversely, air from E-Europe is characterized by rel-atively high values of depolarization, as well as air proceeding from the
Mediterranean-20
African regions. Over the whole campaign (for conditions of RH < 90%) aerosol de-polarization (Da) follows the anticorrelated behavior with respect to RH expected for hygroscopic particles, with an average slope d Da/d RH% ≈ −0.1/30. However, the
low depolarization events of 4 June, 25–27 June and 2 July show d Da/d RH% ≈ 0.0,
confirming these aerosols were in the liquid phase down to RH values as low as 40%. If
25
these events are not included, an average slope d Da/d RH% ≈ −0.1/20 characterizes
the remaining observations.
Saharan dust is commonly considered to be hydrophobic. This property is nicely 457
ACPD
3, 445–477, 2003
Lidar and in situ observations of continental and Saharan aerosol G. P. Gobbi et al. Title Page Abstract Introduction Conclusions References Tables Figures J I J I Back Close
Full Screen / Esc
Print Version Interactive Discussion
c
EGU 2003
portrayed by the airborne observations of aerosol extinction coefficients carried-out in dry (RH= 10–30%) and wet (RH = 80–90%) conditions by Gasso’ et al. (2000). These measurements show the marine PBL aerosol extinction to grow by a factor of 2–3, when switching from the dry to the wet conditions. Conversely, the extinction coefficient of Saharan dust shows no meaningful increase when subject to the same change in
5
RH. Nevertheless, at the Mt. Cimone Station level we kept observing low aerosol
depolarization (average Da < 20%) and an anticorrelation of d Da/d RH% ≈ −0.1/40
(for RH = 40–70%) even in the Saharan aerosol conditions of 3–4 July. As opposed to this behavior, after 12:00 UT of 3 July lidar depolarization was observed to reach the typical dry dust value of Da= 45% at levels above 2.8 km, i.e. in the region less affected
10
by intrusions of PBL aerosols. At the same time, in situ observations at 2165 m reveal the soluble fraction of these airmasses to be larger than the campaign average and to peak at noon of 3 July, when PBL convection reaches its maximum (Putaud et al., this issue). All this evidence strongly supports the presence of a soluble aerosol fraction, externally mixing with the Saharan dust particles at the Mt. Cimone Station level. It is
15
worth noticing that the same conclusion is independently reached by Putaud et al. (this issue) on the basis of chemical analysis of the sub and super-micron aerosol modes.
To estimate the time-dependent aerosol refractive index, we determined the m value (amongst the fourteen ones reported above) minimizing the d βa
i/βai ratio for each i-th
lidar-in situ comparison. Three-point running averages of the real and imaginary parts
20
of the refractive index as retrieved by this procedure are reported in Fig. 3c. This plot shows that until 13 June, i.e. the period during which air mainly proceeded from the Mediterranean region, both real and imaginary part of the retrieved refractive index are rather low (m <1.45–0.002i). The aerosol refractive index then grows during the sec-ond part of the campaign, peaking in both its real and imaginary parts (m= 1.5–0.01i)
25
for the liquid, non-depolarizing particles from Western and NW Europe (26–27 June) and only in the real part (m= 1.5–0.0i) for the solid aerosols (possibly non-absorbing mineral dust) from Eastern Europe (19–21 June). On 3 July, when maximum depo-larization (Da ≤ 30%) was reached, i.e. at its driest condition, the Saharan aerosol
ACPD
3, 445–477, 2003
Lidar and in situ observations of continental and Saharan aerosol G. P. Gobbi et al. Title Page Abstract Introduction Conclusions References Tables Figures J I J I Back Close
Full Screen / Esc
Print Version Interactive Discussion
c
EGU 2003
presented a mean refractive index of m = 1.50–0.003i. As mentioned, depolariza-tion values lower than the ones typical for dry dust (Da = 45%) indicate that part of the backscatter was generated by spherical (liquid) particles. This possibly explains retrieved m values lower than the one expected for mineral dust.
The inferred values of aerosol refractive index well match the long term climatology
5
collected by the photometer network AERONET and described in Dubovik et al. (2002). This analysis also showed the refractive index to be quite well correlated with the non-soluble and refractory aerosol fraction (dust plus non-volatile organic carbon) observed at Mt. Cimone Station (Van Dingenen et al., this issue). Overall, the analysis carried out at the Station level (2165 m a.s.l.) showed: 1) Western Europe aerosols to be more
10
liquid and absorbing than Eastern European ones; 2) Saharan dust to be possibly ex-ternally mixed with soluble aerosols; and 3) depolarization Daand relative humidity RH to be generally anticorrelated, with the exception of the W-European pollution aerosols, which presented no solubility effects (dDa/d RH% ≈ 0.0 for 40% < RH < 90%).
4.4. Error analysis
15
Our previous analysis can be summarized as follows: from the VELIS lidar we have measured βVELIS and estimated σVELIS, SVELIS, and VVELIS. The in-situ size distribu-tion measurements yielded measured SJRC, VJRC, whereas application of a Mie code to these size distribution (with “tunable” refractive indices) provided a set of estimates of βJRC and σJRC. Then, backscatter differences for each backscatter measurement
20
pair (βVELIS, βJRC) recorded within 30 min have been minimized to determine the as-sociated best refractive index m. To evaluate the effects of such a minimization, mean values of the relevant relative differences (βVELIS−βJRC)/βJRCand (σVELIS−σJRC)/σJRC have been computed accordingly with Eq. (1). The same mean differences have been computed for the lidar and in situ retrievals of aerosol volume and surface area, though
25
these values do not depend on the minimization procedure. Three different time inter-vals have been considered for this analysis: 1) the whole campaign period 2 June – 4 July (148 data points); 2) the period 2 June – 2 July (116 data points) and 3) the
ACPD
3, 445–477, 2003
Lidar and in situ observations of continental and Saharan aerosol G. P. Gobbi et al. Title Page Abstract Introduction Conclusions References Tables Figures J I J I Back Close
Full Screen / Esc
Print Version Interactive Discussion
c
EGU 2003
haran dust period 2–4 July (32 data points). Relevant results are reported in Table 1 in terms of both average module relative differences (as defined in Eq. 1) and of average bias, i.e. sign-conserving relative differences.
Minimization with respect to m, led to a decrease in average backscatter differences
d βa/βa from 0.40 (e.g. Sect. 4.2) to 0.10 for the whole campaign period, and to
5
d βa/βa = 0.04 in dust conditions. Systematic differences in these two periods also
change from −0.03 to +0.03, respectively (e.g. Table 1). As a matter of fact, both computations (Mishchenko et al., 1997) and observations (Gobbi et al., 2002) indicate backscatter from dust-like particles to be 0.4–0.7 times the one computed by the Mie theory for spheres of equivalent surface area. Therefore, we would have expected the
10
Mie computations applied to the JRC size distributions to overestimate βa during the dust event, leading to larger cumulative error. Conversely, we observe a better agree-ment in this period than during the “continental” one (2 June – 2 July). This can be explained as due to a combination of at least two effects: 1) lidar-observed backscatter was partly due to spherical particles (this is supported by the definitely low
depolariza-15
tion values), therefore it was higher than the pure non-spherical case; 2) In situ particle counters underestimated number concentrations of larger particles, then leading to smaller Mie backscatter coefficients. This problem often affects optical particle coun-ters and was possibly encountered in the JRC measurements (e.g. Putaud et al., this issue). Conversely, the presence of a negative bias (−0.05) during the “continental”
20
2 June – 2 July period (e.g. Table 1) indicates that to match these lidar retrievals we would have needed to consider unrealistic values of m < 1.30–0.0i in computing size distribution-derived βa. This systematically lower lidar backscatter is likely to be due to the frequent presence of non-spherical particles in continental aerosol conditions, as indicated by the depolarization record of Fig. 3b.
25
Since during the dust period retrieved values of m never went outside the considered variability range (1.3–1.55) we take the relevant backscatter differences (dβa/βa =
0.04) as the error intrinsic to the discretization of refractive indices employed in the analysis (being infinite the set of considered m values we would necessarily have
ACPD
3, 445–477, 2003
Lidar and in situ observations of continental and Saharan aerosol G. P. Gobbi et al. Title Page Abstract Introduction Conclusions References Tables Figures J I J I Back Close
Full Screen / Esc
Print Version Interactive Discussion
c
EGU 2003 d βa/βa = 0.0). We then assume the balance to the average relative difference
ob-served during the continental aerosol period (i.e. 0.12–0.04= 0.08) as the indetermi-nation characterizing the DMA+OPC size distribution-derived optical parameters βJRC and σJRC. This is to be compared to the typical error of VELIS-retrieved backscatter,
d βVELIS/βVELIS= 0.03 − 0.05. 5
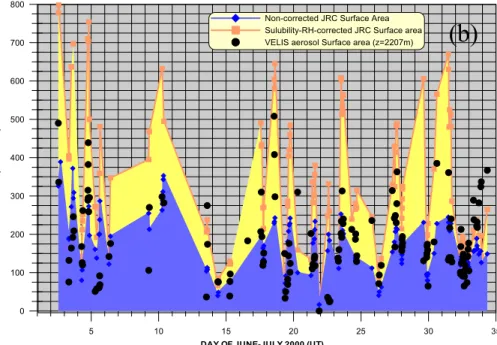
The time evolution of aerosol extinction σa, surface area Sa and volume Va as es-timated from lidar and obtained from in situ measurements (both RH-corrected and non corrected data) is reported in Figs. 4a, 4b and 4c, respectively. Similarly to the case of βa, these figures show that RH-corrected data provide a better agreement between lidar and in situ data. In the case of extinction, the same minimization
pro-10
cess carried-out for backscatter leads to average differences dσa/σa = 0.37 for the
whole period (e.g. Table 1). In the analysis using a fixed “best” refractive index this value was d σa/σa = 0.52. Again, the agreement is better during the Saharan dust
event (d σa/σa = 0.17) and poorer in the “continental” period (dσa/σa = 0.42). The
systematic difference observed during the latter (−0.40) sharply decreases to 0.01 in
15
dust conditions. This behavior shows again a better performance of the non-spherical (dust) model with respect to the spherical (continental aerosol) one. However, consid-ering that the average relative error expected in the lidar estimation of σais of the order of 0.3+ dβVELIS/βVELIS (Barnaba and Gobbi, 2001; Barnaba and Gobbi, 2002), even the largest average absolute differences reported above fall within the combined error
20
bars of the VELIS and JRC measurements.
Surface area and volume average differences for the whole campaign decrease from
d Sa/Sa= 0.46 and dVa/Va= 0.53 in the non RH-corrected record down to a common
value of 0.44 for RH-corrected data. Again, the agreement is much better (almost by a factor of two) during the dust event than before (e.g. Table 1). It is interesting to
no-25
tice that while for surface area (extinction) systematic differences we switch from −0.43 (−0.40) in continental aerosol conditions to −0.01 (+0.01) in dust conditions, in the case of volume the change is much smaller (from −0.45 to −0.20). This result clearly shows the effects of missing a non-spherical aerosol model to retrieve dust particles
ACPD
3, 445–477, 2003
Lidar and in situ observations of continental and Saharan aerosol G. P. Gobbi et al. Title Page Abstract Introduction Conclusions References Tables Figures J I J I Back Close
Full Screen / Esc
Print Version Interactive Discussion
c
EGU 2003
volume. Nonetheless, the expected average uncertainty for these lidar-retrieved sur-face area and volume estimates is of the order of 0.40+ dβVELIS/βVELIS(Barnaba and Gobbi, 2001; Barnaba and Gobbi, 2002), that is, the average cumulative differences of the surface area and volume observations discussed here are well within the two mea-surements cumulative error bars. In particular, during the dust event these differences
5
are a 50% smaller than the expected error bars.
Overall, the error analysis just discussed shows that in the continental aerosol period (2 June – 2 July) all average differences are larger than during the dust event (2–4 July), i.e. when a non-spherical scattering model was employed in the lidar analysis (e.g. Table 1). Furthermore, size distribution-derived backscatter was systematically
10
larger than lidar-measured one in continental aerosol conditions. We expect this effect to be linked to the non-spherical shape often characterizing continental aerosols. To check for the possible influence of particles non-sphericity on the continental aerosol results we then analyzed the behavior of the cumulative errors with respect to aerosol depolarization. For the time interval 2 June – 2 July, we found an increase of 0.1 in
15
d βa/βa, a growth of 0.25 in d Va/Vaand an increase of 0.35 in d Sa/Sa when passing from Da = 0.0 to Da = 0.5, that is, from spherical to fully non-spherical conditions. Conversely, during the dust period no depolarization-dependent change was observed for both d βa/βa and d Sa/Sa, while d Va/Va (obtained as mentioned by a Mie-based aerosol model) showed an increase of 0.35 over the same depolarization interval.
20
Together with the systematic differences reported in Table 1, these results clearly indicate that the Mie computations performed to compute aerosol optical properties from observed size distributions tend to overestimate backscatter when in the presence of non-spherical particles. In the same fashion, the lower backscatter observed by lidar in the presence of non-spherical aerosols leads to lower estimates of extinction,
25
surface area and volume when a spherical scattering model is employed to retrieve these parameters (as it was the case here for continental aerosols). To our knowledge, no parameterization of non-spherical continental aerosol βa versus βa relationship is currently available in the literature and we have to accept the larger margin of error
ACPD
3, 445–477, 2003
Lidar and in situ observations of continental and Saharan aerosol G. P. Gobbi et al. Title Page Abstract Introduction Conclusions References Tables Figures J I J I Back Close
Full Screen / Esc
Print Version Interactive Discussion
c
EGU 2003
specific to these cases.
5. Conclusions
Aerosol extinction, depolarization, surface area and volume profiles obtained by lidar during the MINATROC campaign at Mt. Cimone (1 June – 5 July 2000) have been presented. These observations consistently show the presence of a daily, PBL-related
5
aerosol cycle reaching approximately 3 km altitude. Transport of Saharan dust was also observed to occur in several occasions, reaching up to 8 km altitude. However, lidar depolarization profiles indicate that during the month of June the dust did not reach down to the Mt. Cimone Station level (2165 m a.s.l.), where the campaign in situ sampling took place. Conversely, a dust event first observed on 2 July is shown to
10
extend down to the station level by the afternoon of 3 July, when it also started being detected by the instrumentation deployed there.
To perform a closure analysis, aerosol size distributions observed at the Mt. Ci-mone Station by DMA and OPC instruments have been employed to compute aerosol backscatter and extinction coefficients plus surface area and volume. These values
15
have then been compared to retrievals of the same variables as obtained by the VELIS lidar in the corresponding height interval 2170–2245 m. Minimization of differences in backscatter coefficients obtained for fourteen values of the refractive index (mreal rang-ing from 1.3 to 1.55 and mimaginaryfrom 0.0 to 0.01), provided for each measurement a “best” value of m for the relevant aerosol. When using such a refractive index, average
20
differences (for the whole campaign) between lidar and in situ-retrieved backscatter and extinction coefficients are of 10% and 37%, respectively. In the case of surface area and volume, average differences are of the order of 44%. All these differences are well compatible with the combined standard error associated to the aerosol model employed in the inversion of the lidar equation and to the estimate of such parameters
25
from particle sizing techniques.
It was also noticed that all average differences strongly reduced during the July dust 463
ACPD
3, 445–477, 2003
Lidar and in situ observations of continental and Saharan aerosol G. P. Gobbi et al. Title Page Abstract Introduction Conclusions References Tables Figures J I J I Back Close
Full Screen / Esc
Print Version Interactive Discussion
c
EGU 2003
event, a case for which a non-spherical scattering model was available to invert the lidar signal. Conversely, in continental aerosol conditions average differences were ob-served to increase with depolarization, i.e. with increasing particles non-sphericity. These results confirm how sensitive to particles shape the quantitative retrieval of aerosol properties by means of optical methods can be. In this context,
depolariza-5
tion measurements represent an extremely useful tool for recognizing which aerosol shape (that is thermodynamic phase) is being observed and what inversion model to adopt.
By exploiting air mass back-trajectories, the analysis carried out at the Station level showed that: 1) Western Europe aerosols were more liquid and light-absorbing than
10
Eastern European ones; 2) The aerosol soluble fraction of the African air mass sam-pled at the Station level on 3 July was larger than the campaign average and possibly externally mixed with the Saharan dust; and 3) the link between depolarization Daand relative humidity RH was in general anticorrelated, with the exclusion of the liquid W-Europe aerosols, that revealed no increase in Daeven starting from low (40%) values
15
of RH.
On the whole, the analysis presented here provides a good (within the inversion model error bars) in situ validation of the single wavelength lidar estimates of aerosol extinction, surface area and volume. If considered together with the validation of lidar-retrieved optical depth observations (Gobbi et al., 2002; Barnaba and Gobbi, 2002),
20
these results show the great potential elastic backscatter, polarization-sensitive lidars have for reducing the current lack in knowledge affecting the altitude-dependent prop-erties of atmospheric aerosols.
Acknowledgement. This work has been carried out under the European Union Contract
EVK2-CT-1999-00003 “MINATROC”. We wish to thank P. Bonasoni and F. P. Calzolari for the
invalu-25
ACPD
3, 445–477, 2003
Lidar and in situ observations of continental and Saharan aerosol G. P. Gobbi et al. Title Page Abstract Introduction Conclusions References Tables Figures J I J I Back Close
Full Screen / Esc
Print Version Interactive Discussion
c
EGU 2003
References
Barnaba, F. and Gobbi, G. P.: Lidar estimation of tropospheric aerosol extinction, surface area and volume: Maritime and desert-dust cases, J. Geophys. Res., 106, 3005–3018, 2001. Barnaba, F. and Gobbi, G. P.: Modeling the aerosol extinction versus backscatter relationship
in a mixed maritime-continental atmosphere: Lidar application and validation, personal
com-5
munication, 2002.
D’Almeida, G. A., Koepke, P., and Shettle, E. P.: Atmospheric Aerosols, A. Deepack, Hampton, VA, 1991.
Dubovik, O., Holben, B., Eck, T. F., Smirnov, A., Kaufman, Y. J., King, M. D., Tanre’, D., and Slutsker, I.: Variability of absorption and optical properties of key aerosol types observed in
10
worldwide locations, J. Atmos. Sci., 59, 590–608, 2002.
Facchini, M. C., Mircea, M., Fuzzi S., and Charlson, R. J.: Cloud albedo enhancement by surface-active organic solutes in growing droplets, Nature, 401, 257–259, 1999.
Gasso’, S., Hegg, D. A., Covert, D. S., Collins, D., Noone, K. J., Ostrom, E., Schmid, B., Russell, P. B., Livingston, J. M., Durkee, P. A., and Jonsson, H.: Influence of humidity on the aerosol
15
scattering coefficient and its effect on the upwelling radiance during ACE 2, Tellus, 52B, 546–567, 2000.
Gobbi, G. P.: Polarization lidar returns from aerosols and thin clouds: a framework for the analysis. Appl. Opt., 37, 5505–5508, 1998.
Gobbi, G. P., Barnaba, F., Giorgi, R., and Santacasa, A.: Altitude-resolved properties of a
20
Saharan dust event over the Mediterranean, Atmos. Environ., 34, 5119–5127, 2000.
Gobbi, G. P., Barnaba, F., Blumthaler, M., Labow, G., and Herman, J. R.: Observed effects of particle non-sphericity on the retrieval of marine and desert dust aerosol optical depth by lidar, Atmos. Res., 61, 1–14, 2002.
Houghton, J. T., Ding, Y., Griggs, D. J., Noguer, M., van der Linden, P. J., and Xiaosu, D.(Eds.):
25
Climate Change 2001: The scientific basis, Cambridge University Press, 2001.
Jacob, D. J.: Heterogeneous chemistry and tropospheric ozone, Atmos. Env., 34, 2131–2159, 2000.
Karyampudi, V. M., Palm, S. P., Reagen, J. A., Fang, H., Grant, W. B., Hoff, R. M., Moulin, C., Pierce, H. F., Torres, O., Browell, E. V., and Melfi, S. H.: Validation of the Saharan dust
30
plume conceptual model using lidar, Meteosat and ECMWF data, Bull. Am. Met. Soc., 80, 1045–1075, 1999.
ACPD
3, 445–477, 2003
Lidar and in situ observations of continental and Saharan aerosol G. P. Gobbi et al. Title Page Abstract Introduction Conclusions References Tables Figures J I J I Back Close
Full Screen / Esc
Print Version Interactive Discussion
c
EGU 2003
Kaufman, Y. J., Tanre’, D., and Boucher, O.: A satellite view of aerosols in the climate system, Nature, 419, 215–223, 2002.
Klett, J. D.: Lidar inversion with variable backscatter/extinction ratios, Appl. Opt., 24, 1638– 1643, 1985.
Measures, R. M.: Laser Remote Sensing, J. Wiley, New York, 1984.
5
Mishchenko, M. I., Travis, L. D., Kahn, R. A., West, R. A.: Modeling phase functions for dustlike tropospheric aerosols using a shape mixture of randomly oriented polydisperse spheroids. J. Geophys. Res., 102, 16831–16847, 1997.
Raes F., Van Dingenen, R., Vignati, E., Wilson, J., Putaud, J. P., Seinfeld, J. H., and Adams, P.: Formation and cycling of aerosol in the global troposphere, Atmos. Environ., 34, 4215–4240,
10
2000.
Ramanathan, V., Crutzen, P. J., Kiehl, J. T., and Rosenfeld, D.: Aerosols, climate and the hydrological cycle, Science, 294, 2119–2124, 2001.
Rosenfeld, D.: TRMM observed first direct evidence of smoke from forest fires inhibiting rainfall, Geophys. Res. Lett., 26, 3105–3108, 1999.
15
Stohl, A. and Wotawa, G.: A method for computing single trajectories representing boundary layer transport, Atmos. Environ., 29, 3235–3239, 1995.
ACPD
3, 445–477, 2003
Lidar and in situ observations of continental and Saharan aerosol G. P. Gobbi et al. Title Page Abstract Introduction Conclusions References Tables Figures J I J I Back Close
Full Screen / Esc
Print Version Interactive Discussion
c
EGU 2003
Table 1. Absolute values of average relative differences (in parentheses the sign-conserving
relative values, e.g. Eq. 1) between lidar and size distribution-derived aerosol properties. Backscatter and extinction coefficient differences are obtained after minimization of dβa with respect to refractive index
Time Period d βa/ βa d σa/ σa d Sa/ Sa d Va/ Va Npts. 2 June –4 July 0.10 (−0.03) 0.37 (−0.32) 0.44 (−0.34) 0.44 (−0.39) 148 2 June – 2 July 0.12 (−0.05) 0.42 (−0.40) 0.49 (−0.43) 0.50 (−0.45) 116 2 July – 4 July 0.12 (−0.05) 0.17 (0.01) 0.25 (−0.01) 0.23 (−0.20) 32
ACPD
3, 445–477, 2003
Lidar and in situ observations of continental and Saharan aerosol G. P. Gobbi et al. Title Page Abstract Introduction Conclusions References Tables Figures J I J I Back Close
Full Screen / Esc
Print Version Interactive Discussion c EGU 2003 (a) (b) Figure 1 3 4 5 6 7 8 9 10 11 12 13 14 15 16 17 18 19 20 21 22 23 24 25 26 27 28 29 30 31 32 33 34 DAY OF JUNE- JULY 2000 (UT)
2 3 4 5 6 7 8 Z (km) 0.020 0.040 0.070 0.100 0.200 Aer o sol Exti ncti on (km -1 ) 3 4 5 6 7 8 9 10 11 12 13 14 15 16 17 18 19 20 21 22 23 24 25 26 27 28 29 30 31 32 33 34 DAY OF JUNE- JULY 2000 (UT)
2 3 4 5 6 7 8 Z (km) 5% 8% 10% 15% 20% 40% D epolarization
Fig. 1. Contour plots of lidar-derived aerosol properties observed during the Mt. Cimone
MI-NATROC campaign:(a) 532 nm extinction coefficient σa,(b) Depolarization ratio D, (c) Surface
area Sa,(d) Volume Va.
ACPD
3, 445–477, 2003
Lidar and in situ observations of continental and Saharan aerosol G. P. Gobbi et al. Title Page Abstract Introduction Conclusions References Tables Figures J I J I Back Close
Full Screen / Esc
Print Version Interactive Discussion c EGU 2003 (a) (b) Figure 1 Minart1f1.ppt 3 4 5 6 7 8 9 10 11 12 13 14 15 16 17 18 19 20 21 22 23 24 25 26 27 28 29 30 31 32 33 34 DAY OF JUNE- JULY 2000 (UT)
2 3 4 5 6 7 8 Z (km) 0.020 0.040 0.070 0.100 0.200 Aer o sol Exti ncti on (km -1 ) 3 4 5 6 7 8 9 10 11 12 13 14 15 16 17 18 19 20 21 22 23 24 25 26 27 28 29 30 31 32 33 34
DAY OF JUNE- JULY 2000 (UT)
2 3 4 5 6 7 8 Z (km) 5% 8% 10% 15% 20% 40% D epolarization Fig. 1. Continued. 469
ACPD
3, 445–477, 2003
Lidar and in situ observations of continental and Saharan aerosol G. P. Gobbi et al. Title Page Abstract Introduction Conclusions References Tables Figures J I J I Back Close
Full Screen / Esc
Print Version Interactive Discussion c EGU 2003 (c) (d) Figure 1 3 4 5 6 7 8 9 10 11 12 13 14 15 16 17 18 19 20 21 22 23 24 25 26 27 28 29 30 31 32 33 34 DAY OF JUNE- JULY 2000 (UT)
2 3 4 5 6 7 8 Z (km ) 5E-007 1E-006 2E-006 3E-006 4E-006 5E-006 Aero sol S u rfac e Ar ea (c m 2 /cm 3 ) 3 4 5 6 7 8 9 10 11 12 13 14 15 16 17 18 19 20 21 22 23 24 25 26 27 28 29 30 31 32 33 34 DAY OF JUNE- JULY 2000 (UT)
2 3 4 5 6 7 8 Z (km) 3.0E-012 5.0E-012 1.0E-011 1.5E-011 2.0E-011 3.0E-011 A e ros o l Volu me (c m 3 /cm 3) Fig. 1. Continued. 470
ACPD
3, 445–477, 2003
Lidar and in situ observations of continental and Saharan aerosol G. P. Gobbi et al. Title Page Abstract Introduction Conclusions References Tables Figures J I J I Back Close
Full Screen / Esc
Print Version Interactive Discussion c EGU 2003 (c) (d) Figure 1 3 4 5 6 7 8 9 10 11 12 13 14 15 16 17 18 19 20 21 22 23 24 25 26 27 28 29 30 31 32 33 34 DAY OF JUNE- JULY 2000 (UT)
2 3 4 5 6 7 8 Z (km ) 5E-007 1E-006 2E-006 3E-006 4E-006 5E-006 Aero sol S u rfac e Ar ea (c m 2 /cm 3 ) 3 4 5 6 7 8 9 10 11 12 13 14 15 16 17 18 19 20 21 22 23 24 25 26 27 28 29 30 31 32 33 34 DAY OF JUNE- JULY 2000 (UT)
2 3 4 5 6 7 8 Z (km) 3.0E-012 5.0E-012 1.0E-011 1.5E-011 2.0E-011 3.0E-011 A e ros o l Volu me (c m 3 /cm 3) Fig. 1. Continued. 471
ACPD
3, 445–477, 2003
Lidar and in situ observations of continental and Saharan aerosol G. P. Gobbi et al. Title Page Abstract Introduction Conclusions References Tables Figures J I J I Back Close
Full Screen / Esc
Print Version Interactive Discussion
c
EGU 2003
5 10 15 20 25 30 35
DAY OF JUNE-JULY 2000 (UT)
0 1E-008 2E-008 3E-008 4E-008 5E-008 6E-008 7E-008 8E-008 Ba ( c m -1 s r-1 ) RH-Corrected JRC data m=1.33-0.0i m=1.55-0.0i VELIS z=2207m 5 10 15 20 25 30 35
DAY OF JUNE-JULY 2000 (UT)
0 1E-008 2E-008 3E-008 4E-008 5E-008 6E-008 7E-008 Ba ( c m -1 s r-1 ) Non-Corrected JRC data m=1.33-0.0i m=1.55-0.0i VELIS z=2207m
(a)
(b)
Figure 2
Fig. 2. Lidar observed (black dots) and size distribution-derived backscatter coefficients for two
values of the refractive index:1) m= 1.33–0.0i (diamonds), 2) m = 1.55–0.0i (open squares). Results employing original DMA “dry” size distributions are presented in(a), while (b) considers
particles RH-dependent growth.
ACPD
3, 445–477, 2003
Lidar and in situ observations of continental and Saharan aerosol G. P. Gobbi et al. Title Page Abstract Introduction Conclusions References Tables Figures J I J I Back Close
Full Screen / Esc
Print Version Interactive Discussion
c
EGU 2003
5 10 15 20 25 30 35
DAY OF JUNE-JULY 2000 (UT)
0 1E-008 2E-008 3E-008 4E-008 5E-008 6E-008 7E-008 8E-008 Ba ( c m -1 s r-1 ) RH-Corrected JRC data m=1.33-0.0i m=1.55-0.0i VELIS z=2207m 5 10 15 20 25 30 35
DAY OF JUNE-JULY 2000 (UT)
0 1E-008 2E-008 3E-008 4E-008 5E-008 6E-008 7E-008 Ba ( c m -1 s r-1 ) Non-Corrected JRC data m=1.33-0.0i m=1.55-0.0i VELIS z=2207m
(a)
(b)
Figure 2
Minart1f2.ppt Fig. 2. Continued. 473ACPD
3, 445–477, 2003
Lidar and in situ observations of continental and Saharan aerosol G. P. Gobbi et al. Title Page Abstract Introduction Conclusions References Tables Figures J I J I Back Close
Full Screen / Esc
Print Version Interactive Discussion c EGU 2003 5 10 15 20 25 30 35 DAY OF JUNE 2000 0 20 40 60 80 100 RH 0 0.1 0.2 0.3 0.4 0.5 Da 5 10 15 20 25 30 35 DAY OF JUNE 2000 1 2 3 4 5 A IR M A S S OR IG IN W -EU N -N W EU E-EU M E D AF R a) b) c) 5 10 15 20 25 30 35 DAY OF JUNE 2000 1.3 1.35 1.4 1.45 1.5 1.55 mr 0 0.01 0.02 0.03 mi Figure 3 Minart1f3.ppt
Fig. 3. (a) origin of air masses arriving at Mt. Cimone Station level during the MINATROC
campaign;(b) relative humidity RH (blue area) and aerosol depolarization Da(green dots rep-resent all lidar data, while red triangles show data within 30 min from is situ observations for
RH < 90%), and(c) three-point running averages of real (red triangles) and imaginary (blue
bullets) part of the aerosol refractive index, as inferred from minimization of lidar and size distribution-derived backscatter coefficients.
ACPD
3, 445–477, 2003
Lidar and in situ observations of continental and Saharan aerosol G. P. Gobbi et al. Title Page Abstract Introduction Conclusions References Tables Figures J I J I Back Close
Full Screen / Esc
Print Version Interactive Discussion
c
EGU 2003
5 10 15 20 25 30 35
DAY OF JUNE-JULY 2000 (UT)
0 0.1 0.2 0.3 0.4 0.5 E x t (k m -1 ) RH-Corrected JRC data X m=1.33-0.0i m=1.55-0.0i VELIS z=2207m 5 10 15 20 25 30 35
DAY OF JUNE-JULY 2000 (UT)
0 100 200 300 400 500 600 700 800 Sa ( u m 2 c m -3 )
Non-corrected JRC Surface Area Sulubility-RH-corrected JRC Surface area VELIS aerosol Surface area (z=2207m)
5 10 15 20 25 30 35
DAY OF JUNE-JULY 2000 (UT)
0 10 20 30 40 50 Va ( u m 3 c m -3 ) Non-corrected JRC Volume Sulubility-RH-corrected JRC Volume VELIS aerosol volume (z=2207m)
Figure 4
(a)
(b)
(c)
Fig. 4. Comparison of lidar (black dots) and size distribution-derived parameters as observed
at the level of the Mt. Cimone Station during the MINATROC campaign: (a) 532 nm aerosol
extinction σa(diamonds and squares represent results for m= 1.33–0.0i, and m = 1.55–0.0i, respectively),(b) aerosol surface area Sa, and(c) aerosol volume Va. In the case of Saand Va diamonds represent non corrected DMA data while squares consider particles after RH-dependent growth.
ACPD
3, 445–477, 2003
Lidar and in situ observations of continental and Saharan aerosol G. P. Gobbi et al. Title Page Abstract Introduction Conclusions References Tables Figures J I J I Back Close
Full Screen / Esc
Print Version Interactive Discussion
c
EGU 2003
5 10 15 20 25 30 35
DAY OF JUNE-JULY 2000 (UT)
0 0.1 0.2 0.3 0.4 0.5 E x t (k m -1 ) RH-Corrected JRC data X m=1.33-0.0i m=1.55-0.0i VELIS z=2207m 5 10 15 20 25 30 35
DAY OF JUNE-JULY 2000 (UT)
0 100 200 300 400 500 600 700 800 Sa ( u m 2 c m -3 )
Non-corrected JRC Surface Area Sulubility-RH-corrected JRC Surface area VELIS aerosol Surface area (z=2207m)
5 10 15 20 25 30 35
DAY OF JUNE-JULY 2000 (UT)
0 10 20 30 40 50 Va ( u m 3 c m -3 ) Non-corrected JRC Volume Sulubility-RH-corrected JRC Volume VELIS aerosol volume (z=2207m)
Figure 4
(a)
(b)
(c)
Fig. 4. Continued. 476ACPD
3, 445–477, 2003
Lidar and in situ observations of continental and Saharan aerosol G. P. Gobbi et al. Title Page Abstract Introduction Conclusions References Tables Figures J I J I Back Close
Full Screen / Esc
Print Version Interactive Discussion
c
EGU 2003
5 10 15 20 25 30 35
DAY OF JUNE-JULY 2000 (UT)
0 0.1 0.2 0.3 0.4 0.5 E x t (k m -1 ) RH-Corrected JRC data X m=1.33-0.0i m=1.55-0.0i VELIS z=2207m 5 10 15 20 25 30 35
DAY OF JUNE-JULY 2000 (UT)
0 100 200 300 400 500 600 700 800 Sa ( u m 2 c m -3 )
Non-corrected JRC Surface Area Sulubility-RH-corrected JRC Surface area VELIS aerosol Surface area (z=2207m)
5 10 15 20 25 30 35
DAY OF JUNE-JULY 2000 (UT)
0 10 20 30 40 50 Va ( u m 3 c m -3 ) Non-corrected JRC Volume Sulubility-RH-corrected JRC Volume VELIS aerosol volume (z=2207m)