HAL Id: inserm-00192829
https://www.hal.inserm.fr/inserm-00192829
Submitted on 29 Nov 2007
HAL is a multi-disciplinary open access
archive for the deposit and dissemination of sci-entific research documents, whether they are pub-lished or not. The documents may come from teaching and research institutions in France or abroad, or from public or private research centers.
L’archive ouverte pluridisciplinaire HAL, est destinée au dépôt et à la diffusion de documents scientifiques de niveau recherche, publiés ou non, émanant des établissements d’enseignement et de recherche français ou étrangers, des laboratoires publics ou privés.
3D Ultrasound Elastography for Early Detection of
Lesions. Evaluation on a Pressure Ulcer Mimicking
Phantom.
Jean-François Deprez, Guy Cloutier, Cedric Schmitt, Claudine Gehin, André
Dittmar, Olivier Basset, Elisabeth Brusseau
To cite this version:
Jean-François Deprez, Guy Cloutier, Cedric Schmitt, Claudine Gehin, André Dittmar, et al.. 3D Ultrasound Elastography for Early Detection of Lesions. Evaluation on a Pressure Ulcer Mim-icking Phantom.. Conference proceedings : .. Annual International Conference of the IEEE En-gineering in Medicine and Biology Society. IEEE EnEn-gineering in Medicine and Biology Society. Annual Conference, Institute of Electrical and Electronics Engineers (IEEE), 2007, 1, pp.79-82. �10.1109/IEMBS.2007.4352227�. �inserm-00192829�
Abstract— A pressure ulcer is a damaged tissue area induced
by an unrelieved pressure compressing the tissue during a prolonged period of immobility. The lack of information and studies on the development of this pathology makes its prevention difficult. However, it is both acknowledged that lesions initiate in the deep muscular tissues before they expand to the skin, and that lesions are harder than healthy tissues. Elastography is therefore an interesting tool for an early detection of the pathology. A 3D strain estimation algorithm is presented and evaluated on a PVA-cryogel phantom, mimicking a pressure ulcer at an early stage.
I. INTRODUCTION
ressure ulcers, also known as bedsores, are lesions of the skin and underlying tissues, caused by a high and prolonged pressure at the body interface. This pathology concerns any people with weakened sensitivity or limited mobility. But it mostly strikes elders and spinal cord injury patients. This disease is painful, handicapping and becomes a growing issue, as life expectancy increases in western countries. Yet, it has been neglected till now, and there is still little consensus about the pathological process that triggers the formation of bedsores.
It is now acknowledged that pressure ulcers appear after a prolonged period of immobility, during which the body interface lying on a support (either a bed or a wheelchair) undergoes a high and unrelieved pressure. During a short time, biological soft tissues can tolerate relatively high pressures. However, a weaker but continuous pressure can result in severe injuries and a pressure ulcer can therefore appear anywhere in the body as soon as it is subjected to a significant pressure. Nevertheless, thin layered tissues in regard to a bony prominence are privileged regions, as a high stress is focused on a small volume. This pattern is met for sacrum or heels. These are privileged regions and 80 % Manuscript received April 2, 2007. This work was supported in part by a grant of the Region Rhône-Alpes, France.
J.F. Deprez, O. Basset and E. Brusseau are with the laboratory CREATIS (Application & Research Center for Image and Signal Processing), INSA-Lyon, Université de Lyon, CNRS UMR 5220 & INSERM U630 (corresponding author mail: 7 avenue Jean Capelle, Villeurbanne, 69621 France; phone: 33 4 72 43 62 54; fax: 33 4 72 43 85 26; e-mail: deprez@creatis.insa-lyon.fr ).
G. Cloutier and C. Schmitt are with the Laboratory of Biorheology and Medical Ultrasonics of the University of Montreal Hospital, Canada (e-mail: guy.cloutier@umontreal.ca , cedric.schmitt@umontreal.ca ).
C. Gehin and A. Dittmar are with the Biomedical Microsensors Department of Institut des Nanotechnologies de Lyon of INSA (National Institute of Applied Sciences), France (e-mail: claudine.gehin@insa-lyon.fr
and andre.dittmar@insa-lyon.fr ).
of bedsores affect these two locations.
Above a threshold, compression results in local occlusions of blood capillaries. This shortage of blood supply, called ischemia, prevents the natural exchanges of oxygen and nutrients between the blood and body cells to occur. These ischemic conditions may lead to cell death and severe tissue damages. Besides, skin and muscle have different metabolisms: skin metabolism is anaerobic, while muscle has an aerobic metabolism, requiring much more oxygen [1]. Muscles are therefore more vulnerable to ischemia than the skin and surrounding fat tissues. Thus, lesions first initiate in the deep muscle tissue before expanding to the skin, making difficult their early detection. This explains why the sore is already at a severe stage when it appears on the skin surface.
In the literature, few studies are available on pressure ulcer mechanical properties. The main reference in this area is given by Gefen et al. [2], who showed that tissues damaged by pressure ulcer are harder than healthy tissues. By applying a prolonged compression on rat muscle tissues in vivo, they observed a significant increase of tissue elastic modulus with time and pressure level.
Because of this process of hardening of damaged areas and the deep origin of the ulcer, ultrasound elastography seems especially appropriate for the early detection of pressure ulcer formation.
Elastography is a promising technique, which aim is to provide information about the mechanical properties of soft biological tissues, by investigating their deformation under an external load. Pre- and post-compression ultrasonic (US) radio-frequency (RF) signals are first acquired. Then, changes within the signals induced by the stress are analyzed to compute a map of local strains.
Since static elastography has appeared in the early 90s [3], mainly 1D methods were developed. A few 2D methods have also been worked out [4]-[10]. These techniques are adapted to current clinical equipment since ultrasound scanners essentially provides 2D data. However they may lead to noisy elastograms if significant out-of plane motion occurs, since it represents a source of decorrelation between pre- and post-compression signals. To overcome this decorrelation problem, and with the development of 2D transducer arrays, we use in this study a 3D estimator, which computes the axial strain while considering lateral and azimuthal motions. This strain estimation model is further
3D Ultrasound Elastography for Early Detection of Lesions.
Evaluation on a Pressure Ulcer Mimicking Phantom.
Jean-François Deprez, Guy Cloutier, Cédric Schmitt,
Claudine Gehin, André Dittmar, Olivier Basset and Elisabeth Brusseau
P
HAL author manuscript inserm-00192829, version 1
HAL author manuscript
Conf Proc IEEE Eng Med Biol Soc 2007;1:79-82
This material is presented to ensure timely dissemination of scholarly and technical work. Copyright and all rights therein are retained by authors or by other copyright holders.
All persons copying this information are expected to adhere to the terms and constraints invoked by each author's copyright. In most cases, these works may not be reposted without the explicit permission of the copyright holder.
detailed in the following section. Pressure ulcer early detection is then investigated with the proposed method.
II. METHOD
The proposed 3D strain estimator is based on an adaptive and iterative constrained optimization process. For each elementary RF region R1 selected in the pre-compression
volume V1, its deformed version R2 is searched in the
post-compression volume V2 and the corresponding local strain is
then estimated. In the axial direction (see directions in fig. 1), R2 is considered as a time-delayed (parameter d) and
scaled (parameter α) replica of R1. Because lateral and
azimuthal resolutions are much coarser than the axial resolution, R2 is only considered to be a shifted version of R1
in these directions (parameters τ and ν). The axial delay d results from the accumulation of axial deformations of the regions located between the probe and the region of interest. After having compensated for this axial delay, three parameters remain to be calculated: the axial scaling factor
α, the lateral shift τ and the azimuthal shift ν. They are
estimated as the arguments that minimize an objective function f, defined as the opposite of the correlation coefficient between R1 and its deformed version R2
compensated for the three parameters. Since this objective function f may suffer from multiple local minima, and could therefore yield to incorrect estimations, strong constraints are introduced on the different arguments. An admissible set of values is thus defined.
A three step process is applied to compute the strains. First, an adaptive windowing of the region of study is used, followed by the joint estimation of the three parameters α, τ and ν. The strain map is finally computed.
A. Adaptive windowing of the region of study
The axial tissue compression yields also to lateral and out-of-plane motion in the region of interest, resulting in a transformation of the acoustical footprint of the pre-compression signal. To overcome the subsequent loss of correlation, an adaptive displacement of the 3D region of study is considered. It allows tracking the motion of the
scatterers due to the compression and enables to work on corresponding tissue regions, and therefore equivalent US data in both volumes. To cover the whole US volume V1, the
pre-compression region of study R1 is regularly moved by
constant steps of ∆ax, ∆lat, and ∆azim in the axial, lateral and
azimuthal directions, respectively. An adaptive displacement is considered for R2: its axial displacement results from the
accumulation of axial deformations of the regions located between the probe and the region of interest, and the lateral and azimuthal displacements are directly linked to those estimated over adjacent regions. uR1 and uR2, the positions of
R1 in V1 and R2 in V2, respectively, are then given by:
∑
∑
∑
− = − = − = + + ∆ = ∆ + ∆ + ∆ = 1 0 1 0 1 0 . . . ). 1 ( ) , , ( . . . . . . ) , , ( 2 1 q k k n k k m k k ax R azim lat ax R k j i q n m u k q j n i m q n m u G G G G G G ν τ α (1) where αk is the axial scaling factor at position uR1(m,n,q), τkthe lateral displacement and vk the azimuthal displacement,
estimated on step k. The axial time-delay (parameter d) is directly linked to the axial coordinate of uR2. Hence, with
such an initialization for the location of R2 in V2, the
parameter d is already determined, and the three parameters
α, τ and ν remain to be estimated, the two latter being of
small magnitude.
B. Joint estimation of the parameters α, τ and ν
A joint estimation of the parameters α, τ and ν is then performed. The region of interest R2 is searched within V2, as
an axially scaled, laterally and azimuthally shifted replica of
R1, noted R2(αx,y+τ,z+ν).This is done thanks to the
minimization of the objective function f, which computes the opposite of the normalized correlation coefficient between
R1 and R2, when R2 is compensated for the three searched
parameters: , ) , , ( min arg ] ˆ , ˆ , ˆ [ , , α τ ν ν τ α ν τ α f = (2) with: , )) , , ( ~ ( . )) , , ( ~ ( ) , , ( ~ ). , , ( ~ ) , , ( , , 2 2 , , 2 1 , , 1 2
∑
∑
∑
+ + + + − = z y x z y x z y x z y x R z y x R z y x R z y x R f ν τ α ν τ α ν τ α (3) where R~i(x,y,z)=Ri(x,y,z)−Ri(x,y,z) . (4) ) , , (x y zRi is the mean value of the region Ri. In
elastography, deformations are of small magnitude (a few %). The optimization is therefore submitted to a set of linear inequalities constraints, drastically limiting the occurrence of local minima:
. ,
, min max min max
max
min α α τ τ τ ν ν ν
α ≤ ≤ ≤ ≤ ≤ ≤ (5)
Reducing the parameter domain also saves calculation time. The algorithm is implemented as a descent method, following the scheme:
(
αk+1 τk+1 νk+1) (
= αk τk νk)
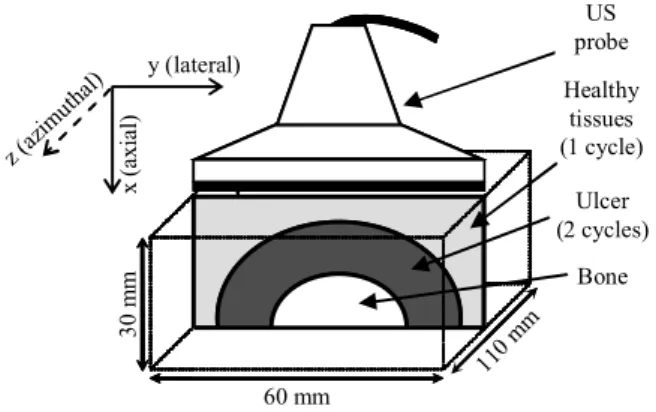
+ρk.Sk (6) Ulcer (2 cycles) Bone Healthy tissues (1 cycle) 60 mm 110 m m 30 m m y (lateral) x ( axi al ) z (az imuth al) US probeFig. 1. Phantom scheme.
where ρk is the descent step computed by a linear search, and
Sk is the descent direction.
The first iteration is chosen as the middle of the admissible set K={(α,τ,ν) | αmin ≤ α ≤ αmax, τmin ≤ τ ≤ τmax, νmin
≤ ν ≤ νmax}, and a sequence of admissible iterations is then
generated, until a stop criteria is met.
C. Strain computation
Strain maps are then computed thanks to the set of parameters calculated for the whole US volume. We focus here on the axial strain, which is directly linked to the estimated parameter αk according to the relation:
. 1 ˆ 1 ˆ , = − k k ax α ε (7)
III. EXPERIMENTAL RESULTS
A polyvinyl alcohol (PVA) cryogel phantom was designed to mimic a pressure ulcer at an early stage. Since PVA cryogel is a material whose acoustical properties are very close to those of soft biological tissues, it can easily be imaged with an ultrasound device. Moreover its stiffness increases with the number of freeze-thaw cycles applied. This typically allows encompassing the range of elasticity values commonly met in soft biological tissues [11].
As previously mentioned, pressure ulcers are found on sites where thin layered tissues are in regard to a bony prominence. Therefore, the phantom is designed as a parallelepiped of dimensions 30 mm x 60 mm x 110 mm, with three distinct areas: a bone, a region mimicking the pressure ulcer at an early stage and healthy tissues surrounding it. The geometry is further detailed in figure 1. The bone, taken from the forward limb of a dog, measured 10 mm in diameter. The pathological area underwent 2 freeze-thaw cycles, which is one more than the healthy region. This led to a harder material for the pressure ulcer mimicking area [12].
Acquisitions of RF US data were performed with an
Ultrasonix - Sonix RP device. The probe and sampling
frequencies were 7 MHz and 40 MHz, respectively. Each image was composed of 128 RF A-lines, with a line interdistance of 0.29 mm. A linear stepper motor was used to move the probe azimuthally and to acquire regularly spaced 2D scans (by steps of 0.2 mm). A first set of scans was performed with the phantom in a pre-compression state. The corresponding RF data volume was built by stacking the images. Then a flat plate was used to uniformly compress the phantom and achieve a global axial deformation of 2%, and the same protocol was once again applied to compute the post-compression volume.
The ability of our algorithm to detect the pathological area was evaluated on these data. The size of the region of interest R1 was 60 axial points x 3 RF lines x 3 azimuthal
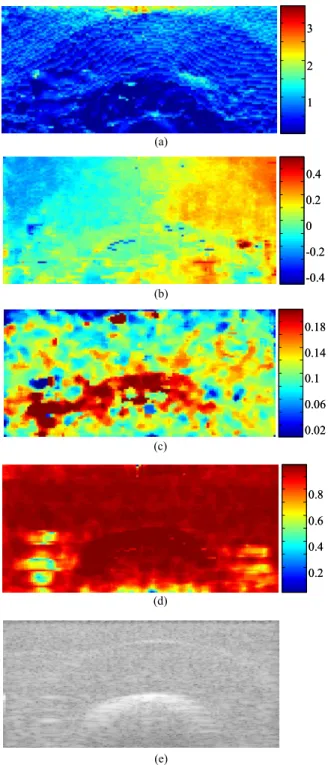
slides, and the overlap was 80 %, both axially and laterally (no azimuthal overlap). The results for an area centered on the middle of the phantom are presented in fig. 2. A B-mode image of the region is shown in fig. 2e. Even if the bone is visible because of its echogenicity, the echography does not exhibit any mechanical information. On the contrary, the axial strain map (fig. 2a) is of great help for distinction between the lesion, the healthy tissues and the bone. Due to
1 2 3 1 2 3 -0.4 -0.2 0 0.2 0.4 -0.4 -0.2 0 0.2 0.4 0.02 0.06 0.1 0.14 0.18 0.02 0.06 0.1 0.14 0.18 0.2 0.4 0.6 0.8 0.2 0.4 0.6 0.8 (a) (b) (c) (d) (e)
Fig. 2. Results for a volume centered on the middle of the phantom. (a) is the axial strain (%). (b) is the lateral displacement (mm). (c) is the azimuthal displacement (mm). (d) is the correlation coefficient map. (e) is a B-mode image.
the low compression level, strain values remain within a small range. However, the deformation of the bone is almost zero, while the mean axial strain of the pathological area is about half that of surrounding tissues (0.75% vs. 1.5%). Moreover, the boundary between the healthy region and the ulcer is recognizable, which could allow a diagnostic about the stage of the illness. The lateral displacement map (fig. 2b) displays this limit too, especially in the top corners of the image. Azimuthal displacement estimations are shown fig. 2c. Surprisingly, there are large displacements for tissues immediately surrounding the bone. This might be due to slippery conditions at the bone/cryogel interface and to a weak link between them when the phantom was built. Because of the poor resolution in the azimuthal direction, this map is also noisy. But it especially demonstrates the interest of considering the 3D motion of soft tissues. The objective function of our algorithm is based on the normalized correlation coefficient, that’s why it is also interesting to consider the correlation coefficient map (fig. 2d). Its mean value over the image reaches a satisfying level of 0.93, which means that the estimations can be trusted.
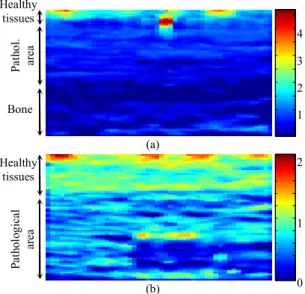
Since the algorithm is three-dimensional, these information (axial strain, lateral and azimuthal displacements) are available for the whole scanned volume. For clinical purpose, the desired parameter could be displayed like a movie (with the z axis corresponding to time), to see its evolution along the azimuth and to provide the physician with a better understanding of the imaged area. We chose here to present the axial strain along the z axis (perpendicular to the US scan) for two different positions (fig. 3). The axial strain for the middle slice (corresponding to the axe of the bone axis) is shown fig. 3a. Here again, the coarse resolution is a limitation. Yet, it is still possible to distinguish the 3 regions. Fig. 3b exhibits the axial strain for an off-centered slice. The bone is not visible at this position, but the healthy and pathological regions can clearly be
differentiated, since the deformation of healthy tissues is approximately twice the deformation of the diseased region.
IV. CONCLUSION
A 3D strain estimator has been described in this paper. Thanks to an optimized adaptive and iterative process, it enables accurate estimations of the axial strain distribution, while considering lateral and azimuthal motion. The strain estimation technique was evaluated on a PVA-cryogel phantom mimicking a pressure ulcer at an early stage. Results are very encouraging, both for the potential of our 3D elastographic method, and for the possibility of detecting this pathology at an early stage. Complementary tests on in
vitro and in vivo biological tissues are now planed.
REFERENCES
[1] G.T. Nola and L.M. Vistnes, “Differential response of skin and muscle in the experimental production of pressure sores,” Plast.
Reconstr. Surg., vol. 66, pp. 728-733, Nov. 1980.
[2] A. Gefen, N. Gefen, E. Linder-Ganz and S.S. Margulies, “In vivo muscle stiffening under bone compression promotes deep pressure sores”, Trans. of the ASME, vol. 127, pp. 512-524, June 2005. [3] J. Ophir, I. Céspedes, H. Ponnekanti, Y. Yazdi and X. Li,
“Elastography: a quantitative method for imaging the elasticity of biological tissues”, Ultrasonic Imaging, vol.13, pp. 111-134, Apr. 1991.
[4] M. O'Donnell, A.R. Skovoroda, B.M. Shapo and S.Y. Emelianov, “Internal displacement and strain imaging using ultrasonic speckle tracking”, IEEE Trans. Ultrasonics, Ferro. and Freq. Control, Vol. 41, no. 3, pp. 314-324, May 1994.
[5] P. Chaturvedi, M.F. Insana and T.J. Hall, “2D Companding for noise reduction in strain imaging”, IEEE Trans. Ultrasonics, Ferro. and
Freq. Control, vol. 45, no. 1, pp. 179-191, Jan. 1998.
[6] E. Konofagou and J. Ophir, “A new elastographic method for estimation and imaging of lateral displacements, lateral strains, corrected axial strains and Poisson's ratio in tissues”, Ultrasound in
Medicine and Biology, Vol. 24, pp. 1183-1199, Oct. 1998.
[7] X. Chen, M. J. Zohdy, S. Y. Emilianov and M. O'Donnell, “Lateral Speckle Tracking Using Synthetic Lateral Phase”, IEEE Trans.
Ultrasonics, Ferro. and Freq. Control, vol. 51, no. 5, pp. 540-550,
May 2004.
[8] R. L. Maurice, J. Ohayon, Y. Frétigny, M. Bertrand, G. Soulez and G. Cloutier, “Non-invasive vascular elastography: Theoretical framework”, IEEE Trans. Medical Imaging, Vol. 23, No 2, pp. 164-180, Feb. 2004.
[9] E. Brusseau, J. Kybic, J.F. Deprez and O. Basset, “2D locally regularized strain estimation algorithm: Theoretical developments and results on experimental data”, IEEE Trans. Medical Imaging, to be published, 2007.
[10] C. Schmitt, G. Soulez, R. L. Maurice, M.F. Giroux, and G. Cloutier, “Non-invasive vascular elastography: toward a complementary characterization tool of atherosclerosis in carotid arteries”, Ultrasound
in Medicine and Biology, to be published, 2007.
[11] J. Fromageau, J.L. Gennisson, C. Schmitt, R. L. Maurice, R. Mongrain, and G. Cloutier, “Estimation of polyvinyl alcohol cryogel mechanical properties with four ultrasound elastography methods and comparison with gold standard testings”, IEEE Trans. Ultrasonics,
Ferro. and Freq. Control, vol. 54, no. 3, pp. 498-509, Mar. 2007.
[12] J. Fromageau, E. Brusseau, D. Vray, G. Gimenez, and P. Delachartre, “Characterization of PVA cryogel for intravascular ultrasound elasticity imaging”, IEEE Trans. Ultrasonics, Ferro. and Freq.
Control, vol. 50, no. 10, pp. 1328-1324, Oct. 2003.
1 2 3 4 0 1 2 Bone Pa th ol . ar ea Healthy tissues Healthy tissues Pa thol og ic al ar ea (a) (b)
Fig. 3. Axial strain along the z axis, for a slice centered on the middle of the phantom (a), and for an off-centered slice (b).