HAL Id: hal-00295599
https://hal.archives-ouvertes.fr/hal-00295599
Submitted on 7 Feb 2005
HAL is a multi-disciplinary open access
archive for the deposit and dissemination of
sci-entific research documents, whether they are
pub-lished or not. The documents may come from
teaching and research institutions in France or
abroad, or from public or private research centers.
L’archive ouverte pluridisciplinaire HAL, est
destinée au dépôt et à la diffusion de documents
scientifiques de niveau recherche, publiés ou non,
émanant des établissements d’enseignement et de
recherche français ou étrangers, des laboratoires
publics ou privés.
Measurements of tropospheric NO2 with an airborne
multi-axis DOAS instrument
P. Wang, A. Richter, M. Bruns, V. V. Rozanov, J. P. Burrows, K.-P. Heue, T.
Wagner, I. Pundt, U. Platt
To cite this version:
P. Wang, A. Richter, M. Bruns, V. V. Rozanov, J. P. Burrows, et al.. Measurements of tropospheric
NO2 with an airborne multi-axis DOAS instrument. Atmospheric Chemistry and Physics, European
Geosciences Union, 2005, 5 (2), pp.337-343. �hal-00295599�
www.atmos-chem-phys.org/acp/5/337/ SRef-ID: 1680-7324/acp/2005-5-337 European Geosciences Union
Atmospheric
Chemistry
and Physics
Measurements of tropospheric NO
2
with an airborne multi-axis
DOAS instrument
P. Wang1, A. Richter1, M. Bruns1, V. V. Rozanov1, J. P. Burrows1, K.-P. Heue2, T. Wagner2, I. Pundt2, and U. Platt2
1Institute of Environmental Physics, University of Bremen, Germany 2Institute of Environmental Physics, University of Heidelberg, Germany
Received: 24 September 2004 – Published in Atmos. Chem. Phys. Discuss.: 15 November 2004 Revised: 1 February 2005 – Accepted: 1 February 2005 – Published: 7 February 2005
Abstract. The AMAXDOAS instrument is an airborne multi-axis DOAS instrument covering the spectral range from 300 to 600 nm. During one flight of the SCIAVALUE campaign on 19 March 2003, the AMAXDOAS onboard the DLR Falcon detected tropospheric NO2 over Europe under
both cloudy and cloud free conditions. By combining the measurements in nadir and zenith direction, and analysing the spectra in the UV and the visible spectral region, infor-mation was derived on where the bulk of the observed NO2
was located. Vertical columns of up to 5.7×10¹⁶molec cm−2 were observed close to Frankfurt, with a distribution peaking in the boundary layer and in good agreement with surface measurements. On several occasions, strong tropospheric NO2 signals were also detected when flying above clouds.
The ratio of zenith and nadir measurements indicates that the NO2 observed was located within the cloud, and assuming
the same profile as for the cloud free situation the NO2
ver-tical column was estimated to be 5.0 × 10¹⁶ molec cm−2. The results are relevant for the retrieval of tropospheric NO2
columns from space-borne instruments in cloudy situations.
1 Introduction
Nitrogen dioxide, NO2, is one of the most important trace
gases in the atmosphere. In the troposphere its photolysis leads directly to the formation of O3. High concentrations of
NO2are harmful to vegetation and human health. Sources of
NOx (NO2+NO) include both natural (soils, lightning) and
anthropogenic (fires, fossil fuel consumption) emissions. In-situ measurements of NO2in the troposphere have been
made by a variety of detectors, both on the surface and from air-borne platforms. In the last few years, retrievals of the tropospheric amount of NO2from GOME satellite
measure-Correspondence to: P. Wang ([email protected])
ments have yielded unprecedented information by provid-ing a global view (e.g. Burrows et al., 1999; Leue et al., 2001; Richter and Burrows, 2002; Martin et al., 2002). Since August 2002, similar measurements are performed by the Scanning Imaging Absorption Spectrometer for Atmospheric Chartography (SCIAMACHY) instrument on board of EN-VISAT (Bovensmann et al., 1999) with improved spatial res-olution. Although some successful first attempts have been made to validate the tropospheric NO2retrievals from space
instrumentation (Heland et al., 2002; Heue et al., 2004; Mar-tin et al., 2004), these have been limited to selected regions and many open questions remain. For the validation of the SCIAMACHY, two large campaigns were performed with the German research aircraft Falcon during September 2002 and in February and March 2003 (Fix et al., 2004; Wang et al., 2004). In this study, measurements taken by the Airborne Multi Axis DOAS (AMAXDOAS) instrument on board the Falcon on the 19 March 2003 have been analysed for NO2,
both in the presence and absence of cloud. The data have then been inverted, taking into account the dependence of the slant column on wavelength and viewing direction to re-trieve the amount of NO2 in the planetary boundary layer.
Finally, conclusions are drawn for satellite validation and the interpretation of GOME and SCIAMACHY measurements.
2 Methodology
2.1 Instrument
Airborne UV/visible spectrometers have been used in the past for studies of stratospheric (e.g Pfeilsticker and Platt, 1994; Petritoli et al., 2002) and tropospheric (McElroy et al., 1999; Melamed et al., 2003) composition. The AMAX-DOAS instrument (Wagner et al., 2001) was specifically de-signed and constructed to retrieve tropospheric and strato-spheric column amounts of atmostrato-spheric trace species for the
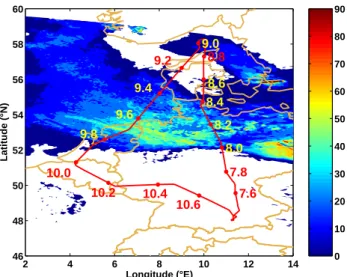
338 P. Wang et al.: AMAXDOAS tropospheric NO2measurements 2 4 6 8 10 12 14 46 48 50 52 54 56 58 60 Longitude (°E) Latitude (°N) 7.6 7.8 8.0 8.2 8.4 8.6 8.8 9.0 9.2 9.4 9.6 9.8 10.0 10.2 10.4 10.6 0 10 20 30 40 50 60 70 80 90
Fig. 1. MODIS cloud optical depth map for 19 March 2003, at
10:50 UT. The red line indicates the Falcon flight track with approx-imate times (UT). White areas are cloud free regions. The flight was from 07:30 UT to 10:48 UT with solar zenith angles ranging from 50◦to 70◦.
validation of the SCIAMACHY instrument from aircraft. It comprises two grating spectrometers, one operating in the UV between 300 and 440 nm, the other covering the visible part of the spectrum (400–550 nm). Quartz fibre bundles are used to collect scattered sunlight from two sets of telescopes, one on the top and one on the bottom of the aircraft. Dur-ing the flight discussed here, measurements were performed in four viewing directions: 0◦, 88◦, 92◦and 180◦, where the zenith direction is 180◦ and the nadir direction is 0◦. The signals from the four directions are detected simultaneously with CCD imaging detectors: the data being averaged and then recorded about every 30 seconds, corresponding to 6 km spatial resolution along the flight track. The field of view of the AMAXDOAS is about 0.2◦.
Analysis of the measurements is based on the well known Differential Optical Absorption Spectroscopy (DOAS) tech-nique (Platt, 1994) and similar to that used for ground-based and satellite measurements. As has been shown in a recent sensitivity study, measurements from the different viewing directions of the instrument can be used to derive vertically resolved profiles (Bruns et al., 2004). Using a different ap-proach, in this paper measurements from the zenith and nadir directions taken in different spectral regions having different weighting functions are combined to derive both the tropo-spheric NO2amount and its vertical distribution.
2.2 Measurement Situation
On the 19 March 2003, the Falcon flight track was from Oberpfaffenhofen (48.1◦N, 11.3◦E, close to Munich, Ger-many, at 07:30 UT), to Denmark (at 09:00 UT), to the Nether-lands, then to Belgium (at 10:00 UT) and back to
Oberpfaf-fenhofen (at 10:48 UT). After take off the Falcon typically cruised at 11 km altitude. The flight track is shown in Fig. 1 on top of the cloud optical depth derived from MODIS data. As can be seen, the northern part of the flight was over a con-tinuous bank of clouds, while the southern part was cloud free. According to the MODIS cloud top height data (King et al., 1997), the clouds above northern Germany were at about 700 hPa, while over the Netherlands and at the edge of the cloud field they were as low as 900 hPa. Local weather ob-servations report that the cloud base was at about 400 m. It was a relatively warm day and the earth’s surface was snow free under the flight track.
2.3 Sensitivity Studies
To investigate the sensitivity of the measurements to NO2
absorption in different altitudes below the aircraft, a number of model simulations were made using the radiative trans-fer model SCIATRAN (Rozanov et al., 1998, 2004). Calcu-lations were performed at three representative wavelengths (360, 433, 485 nm) where NO2retrieval is possible for both
the nadir and the zenith viewing geometry.
Two specific cases were distinguished: a) a cloud free situ-ation and, b) a measurement above a low cloud. For the sim-ulations, temperature and pressure profiles were taken from the US standard atmosphere, and an urban aerosol with a vis-ibility of 10 km was assumed in the boundary layer. The flight altitude was set to 11 km, and the solar zenith an-gle (SZA) was selected to be 60◦. The surface spectral re-flectance was set to 0.02, 0.05 and 0.08 at the wavelengths 360, 433, and 485 nm, respectively. To test the albedo effect, a scenario with a high albedo (0.8) was also investigated.
For the simulations with cloud, a cloud layer between 0.4 and 1.5 km was assumed with an optical depth of 25, which is about the average cloud optical depth observed by MODIS along the flight track. As the instrument field of view is small and the clouds were continuous and large, partially cloudy scenes were not considered.
In Fig. 2 (left), the weighting functions for the clear sky case and low albedo are shown at the three wavelengths in both nadir and zenith direction. The weighting functions de-scribe the change of the measured NO2column for a change
in concentration in a given altitude relative to the correspond-ing change in the vertical column. As can be seen, for small albedo the sensitivity to the boundary layer differs signifi-cantly between the three wavelengths, whereas the relative differences are small in the free troposphere. This is pre-dominantly a result of increased Rayleigh scattering in the UV which reduces the penetration depth of the photons and thereby the sensitivity to the lowest layers, but the change in surface reflectivity also contributes. By analysing the ratio of measurements at different wavelengths, an estimate can be made on where the bulk of the NO2 is located and at
least boundary layer and free tropospheric NO2 should be
distinguishable. At a given wavelength, the ratio of nadir
2
Fig. 2. Weighting functions or altitude dependent airmass factors for clear sky, low albedo (left), clear sky and high albedo (middle) and with
a cloud (right). The shaded area indicates the position of the cloud. Solid lines are for the nadir viewing direction, the broken lines for zenith observation. All curves are for a flight altitude of 11 km.
and zenith weighting function is also decreasing with alti-tude, and depending on the measurement uncertainty, this in-formation could also be used to derive altitude inin-formation.
As shown in Fig. 2 (middle) the weighting functions for high albedo (0.8) are much larger in the boundary layer than those for small albdeo and also the decrease with altitude is smaller. As the relative differences between the different wavelengths decrease, the amount of profile information is much lower for such a situation which occurs for example over snow or fog.
In the presence of a cloud, the sensitivity of the measure-ments to NO2below the cloud is close to zero. Within the
cloud, the sensitivity increases and above the cloud, it is larger than for the case without cloud (Fig. 2, right). This is the result of the higher effective spectral reflectance of the cloud top and the multiple scattering within the cloud. In contrast to the cloud free situation, the weighting functions for the three wavelengths do not differ significantly. The sen-sitivity of the zenith direction is again much smaller than that of the nadir direction, but above the cloud, it is also larger than in the cloud free situation. These relationships do not depend significantly on the cloud’s altitude as long as the cloud is below the aircraft. The cloud optical depth de-termines the gradient of the weighting functions within the cloud and also the absolute value above the cloud. Surface albedo plays no role for an optically thick cloud.
According to the figure, a small signal should be observed in the zenith direction if there is NO2above the cloud or in
its upper part, but not if it is within or below the cloud. As the nadir weighting function decreases much slower within the cloud, the ratio between the measurements in nadir and zenith direction can be used to estimate if NO2is above,
be-low or within the cloud.
3 Results and Discussion
The AMAXDOAS measurements from the 19 March 2003 were analysed in three different wavelength windows, 345– 380 nm, 410–456 nm, and 472–497 nm, respectively. As the focus of these measurements are the tropospheric concentra-tions, a measurement taken at about 09:36 UT, selected to be in a clean region free from significant tropospheric NO2has
been used as a background spectrum. The resulting columns are therefore differential slant columns relative to that in the background measurement. The stratospheric signal is as-sumed to be constant over the next hour of measurement. Ac-cording to GOME measurements, the typical latitudinal gra-dient of the stratospheric NO2between 50–60◦N was about
1×10¹⁵molec cm−2in mid of March 2003 over the Atlantic, and we assume that a similar gradient was present in the stratospheric NO2over the continent. This adds as a small
error to the tropospheric NO2retrieved in the polluted area.
To analyse the tropospheric NO2column, the NO2cross
sec-tion at 273 K was used in the retrieval.
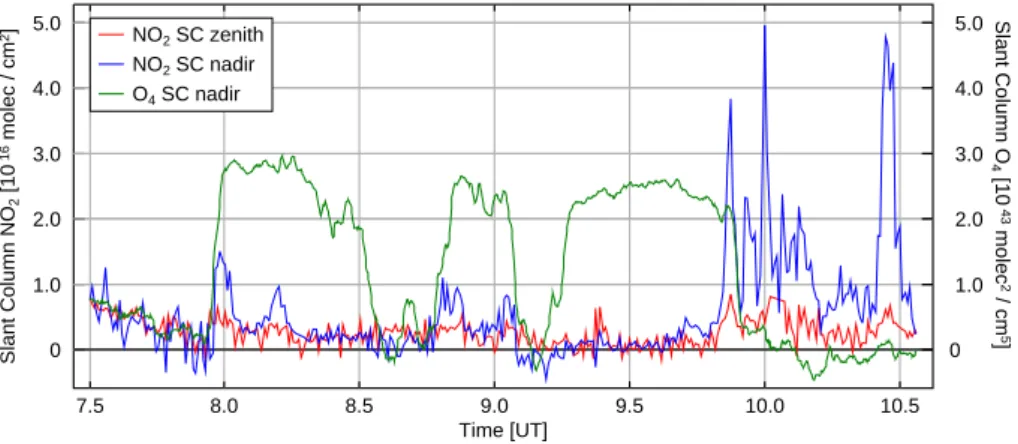
In Fig. 3, the NO2slant columns retrieved from the nadir
and zenith viewing directions in the 410–456 nm window are shown with the O4slant columns derived in the 345–380 nm
window nadir viewing direction. The O4columns are clearly
enhanced in some regions, indicating low cloud, in agree-ment with the MODIS cloud data shown in Fig. 1 and the observations during the flight. Large nadir columns are re-trieved in the clear region at the end of the flight, close to Frankfurt (at about 10:30 UT). However, on several occa-sions, enhancements of NO2 were also observed in cloudy
situations, in particular when approaching cloud free areas, for example at 09:48 UT between Amsterdam and Utrecht. NO2 columns in the zenith direction (see Fig. 3) are small
throughout the flight, but tend to increase when nadir NO2is
340 P. Wang et al.: AMAXDOAS tropospheric NO2measurements 0 1.0 2.0 3.0 4.0 5.0 0 1.0 2.0 3.0 4.0 5.0 7.5 8.0 8.5 9.0 9.5 10.0 10.5 NO2 SC zenith NO2 SC nadir O4 SC nadir Time [UT] Slant Column NO 2 [10 16 molec / cm 2] Slant Column O 4 [10 43 molec 2 / cm 5 ]
Fig. 3. NO2slant columns in zenith and nadir direction, and nadir O4columns observed during the Falcon flight. The solar zenith angle varied from 70◦to 50◦. The background spectra were taken at 09:36 UT at a solar zenith angle at about 61◦.
-1.0 0 1.0 2.0 3.0 7.5 8.0 8.5 9.0 9.5 10.0 10.5 O4 VC nadir O4 VC zenith O4 SC nadir O4 SC zenith Time [UT] Slant Column O 4 [10 +43 molec 2 / cm 5]
Fig. 4. O4slant and vertical columns observed in zenith and nadir
direction during the flight. For the cloudy parts, a low cloud layer between 0.4 and 1.5 km with an optical depth of 25 was assumed in the airmass factor calculations.
As the vertical profile of the oxygen dimmer, O4, is
known, and ignoring small effects resulting from surface pressure variability, the effective light path of the measure-ments can be estimated from the slant column change. The O4slant column depends mainly on surface elevation, albedo
and cloud. High clouds will reduce the observed column as they hide part of the column while low clouds increase the column through the effect of increased albedo and mul-tiple scattering. For the measurements having low cloud be-low the Falcon, the cloud top height and optical thickness of the cloud were derived from the O4measurements. This
was achieved by varying the cloud parameters used in the radiative transfer calculations until the derived O4 vertical
columns agreed for nadir and zenith measurements as well as in cloudy and clear sky conditions. Good consistency was obtained for a low cloud layer between 0.4 and 1.5 km
hav-ing an optical depth of 25 as illustrated in Fig. 4. These num-bers are also consistent with the MODIS data (see Fig. 1). Therefore these cloud settings were used for the evaluation of the NO2columns in the cloudy situation, and the
weight-ing functions shown in Fig. 2 already used these settweight-ings. As discussed above, the sensitivity of the retrieval to the boundary layer NO2 depends on wavelength. This effect is
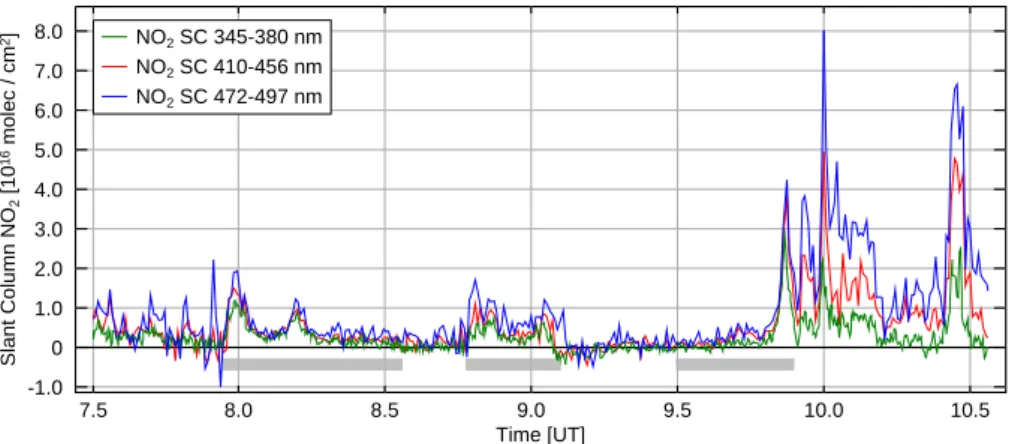
demonstrated in Fig. 5, where NO2slant columns retrieved
in the three different wavelength regions (345–380 nm, 410– 456 nm, and 472–497 nm) are shown. NO2columns at all
wavelengths are very similar over clouds, showing the high degree of consistency of the AMAXDOAS NO2
measure-ments. Under cloud free conditions, the enhanced columns retrieved from the three fitting windows differ significantly and increase with wavelength. The ratio of the slant columns retrieved at 410–456 nm and 345–380 nm is about 2. Accord-ing to the sensitivity studies presented above, this indicates that the bulk of the NO2 must be located in the boundary
layer, probably resulting from local emissions.
As the sensitivity of the measurements to NO2below the
clouds is negligible, the NO2signal observed over the cloud
must originate from NO2above or in the uppermost part of
the cloud. As the zenith viewing columns also show some enhancement in these regions (see Fig. 3), it is concluded that significant amounts of NO2must have been above or in
the cloud top. Whether or not there is NO2below the clouds
can not be determined from the measurements due to the very low sensitivity.
As can be seen from the cloud weighting function the ra-tio of nadir and zenith NO2column should be between 2 and
3 if the NO2layer is above the clouds. If the NO2 layer is
between 1.5 and 2.0 km, the ratio of nadir and zenith NO2
column as simulated with the radiative transfer model is 2.7. However, in the measurements, the ratio of the nadir and zenith NO2slant column is about 4.8, indicating that the NO2
is located in the upper part of the cloud and not as a layer above the cloud.
2 -1.0 0 1.0 2.0 3.0 4.0 5.0 6.0 7.0 8.0 7.5 8.0 8.5 9.0 9.5 10.0 10.5 NO2 SC 345-380 nm NO2 SC 410-456 nm NO2 SC 472-497 nm Time [UT] Slant Column NO 2 [10 16 molec / cm 2]
Fig. 5. NO2 slant column retrieved in different windows (regions having cloud are indicated by the grey bars). Over polluted regions,
measurements at larger wavelength yield larger slant columns in cloud free situations but not over clouds.
The measured NO2columns in three wavelength windows
were converted to vertical columns with air mass factors (AMFs) based on the above described scenarios. The AMF is defined as the ratio between slant column and vertical col-umn of the absorber. For optically thin constituents it can be calculated from the product of weighting function and con-centration profile (Martin et al., 2002; Nuess, 2005). Accord-ing to the temperature and wind measurements on the Fal-con during the descent at about 10:48 UT, the boundary layer height was about 1.3 km. We therefore assume that NO2
is well mixed below 1.3 km and linearly decreases to 0 at 1.6 km in both the cloudy and cloud free situation. The NO2
vertical columns are shown in Fig. 6 for the last part of the flight including the large peak over the cloud. In the cloudy situation, the NO2column was about 5.0×10¹⁶ molec cm−2
and about 5.7×10¹⁶molec cm−2in the cloud free peak. The agreement of the NO2 vertical columns in the three
wave-length regions gives a consistent picture of enhanced NO2in
the boundary layer.
The NO2 vertical columns retrieved from the
AMAX-DOAS measurements were compared with ground-based in-situ measurements from the Hessisches Landesamt f¨ur Umwelt and Geologie (http://www.hlug.de/medien/luft/ index.htm). The in-situ NO2measurement at 10:30 UT was
selected from seven air quality measurement stations within 20 km of the flight track. The average of these measurements yields 32.6 µg m−3, which corresponds to about 16.4 ppb.
When converted to a vertical column using the profile as-sumed for the AMF calculation, this corresponds to a vertical column of 5.5×10¹⁶ molec cm−2, which is consistent with the AMAXDOAS measurements of 5.7×10¹⁶molec cm−2.
The NO2columns, observed over the cloud close to
Ams-terdam are comparable to those observed in the cloud free re-gions over polluted sites. It is therefore reasonable to assume that they are the result of either vertical transport through the cloud, or more for low clouds, the uplifting of BL air in the cloud. -1.0 0 1.0 2.0 3.0 4.0 5.0 6.0 7.0 9.6 9.8 10.0 10.2 10.4 NO2 VC 345-380 nm NO2 VC 410-456 nm NO2 VC 472-497 nm Time [UT] Vertical Column NO 2 [10 16 molec / cm 2]
Fig. 6. NO2vertical columns for the Falcon flight calculated from different fitting windows using appropriate airmass factors with and without clouds.
The cloud observed by AMAXDOAS on 19 March 2003 was a large slow moving stratus cloud, which can be clearly identified on the MODIS measurements and also on Meteosat images. On that day, the meteorological situation was dom-inated by a low pressure system over the north east of Scan-dinavia (965 hPa, at 70◦N, 40◦E) and a cold front running from Scandinavia to the south. An anticyclone, Liliana was situated over the UK (1030 hPa, at 50◦N, 0◦E).
According to radiosonde data from De Bilt taken at 12:00 UT on 19 March the surface pressure was 1031 hPa, the wind mainly from north to south and very stable from the surface up to 800 hPa. The wind direction was about 350◦ (north is 0◦) and wind speed was smaller than 4 m/s. The wind direction shows that the front was moving from north to the south. The edge of the stratus cloud indicates the po-sition of the cold front. As the cold front was moving over the Netherlands and the northern part of Germany, warm air
342 P. Wang et al.: AMAXDOAS tropospheric NO2measurements
close to the surface was lifted upwards and with it any NO2
from the boundary layer.
As in a stratus cloud advection is small, the NO2 from a
localized source remains localized within the cloud for some time. This can explain why the NO2 is at the edge of the
cloud and the measurements show a single NO2peak. Also,
NO2in the cloud should only be observed close to pollution
sources unless long range transport becomes important. This can explain the observed variability in NO2.
4 Conclusions
AMAXDOAS measurements of scattered light from a flight over Denmark, the Netherlands, Belgium and Germany on the 19 March 2003 are reported. Tropospheric NO2columns
were retrieved from the measurements and strongly enhanced values were observed under clear sky conditions close to Frankfurt, but also over clouds, in particular close to the cloud edge in polluted regions.
Sensitivity studies using the radiative transfer model SCI-ATRAN show that for clear sky conditions, the sensitivity to boundary layer NO2changes by more than a factor of 2
be-tween 360 and 485 nm. Analysis of the NO2slant column
in three different wavelength windows therefore yields infor-mation about the vertical location of the NO2. In the case
studied here, the results from three wavelength regions were shown to be consistent with NO2being located in a
bound-ary layer of 1.3 km height. This is the first demonstration of vertically resolved retrieval of NO2 from measurements
aboard a high altitude aircraft. The tropospheric NO2vertical
columns derived in cloud free situation were compared with ground based in-situ measurements, and good agreement was found.
For cloud covered situations, the cloud top height and an estimate of the cloud optical depth were derived from the ob-served O4columns, measured in nadir and zenith direction.
For the flight discussed here, a cloud top height of 1.5 km and an optical depth of 25 were estimated from the measure-ments. These values are consistent with MODIS cloud data determined at about the same time.
Sensitivity studies for measurements over a low and op-tically thick cloud show that the vertical sensitivity depends only weakly on wavelength in agreement with the measure-ment results. For zenith sky measuremeasure-ments above clouds it could be shown that a small but significant signal originates from the light scattered upwards from the cloud and then back to the aircraft. The observation in zenith direction, cou-pled with the nadir measurements were used to determine whether enhanced NO2columns observed over clouds
orig-inated from NO2within or above the cloud. The
measure-ments taken during this flight indicate that the NO2signal
observed in cloudy situations were mainly from NO2in the
upper part of the cloud but not above the cloud.
The results of this study have important implications for satellite measurements of tropospheric NO2, for example
from GOME or SCIAMACHY. First, the wavelength method described here is also applicable to satellite measurements, providing a new method to derive BL NO2 from space
(Richter and Burrows, 2000). Second, the observation of NO2 in cloudy situation is an important constraint for
at-tempts to estimate BL NO2from satellite measurements by
comparing cloudy and cloud free measurements. And last, the observation of enhanced NO2 over the edge of cloud
fields indicates a potential problem for NO2 retrieval from
partially cloudy satellite scenes, as the relatively large NO2
signal from the highly visible NO2in the upper part or above
the cloud could be misinterpreted to be an inappropriately large amount of NO2in the BL.
The sensitivity studies and measurement results presented here demonstrate the large potential of air-borne UV/visible absorption measurements for studies of tropospheric NO2
pollution. Such measurements are well suited for satellite validation and can also contribute to environmental and air quality monitoring.
Acknowledgements. The authors would like to thank the Falcon
team and flight support at the DLR Oberpfaffenhofen for their continuous and very efficient support of the SCIAVALUE flights in general and the AMAXDOAS measurements in particular. We would also like to thank the former members of the AMAXDOAS team, in particular R. Rollenbeck, F. Finnocci, and A. Heck, and also the workshop of the University of Heidelberg for their great help with the instruments. Parts of this work were funded by the BMBF through projects 50 EE 0023 and 50 EE 0024. The radiosonde data at de Bilt were provided by KNMI. The MODIS data used in this study were acquired as part of the NASA’s Earth Science Enterprise. The algorithms were developed by the MODIS Science Teams. The data were processed by the MODIS Adaptive Processing Syst (MODAPS) and Goddard Distributed Active Archive Center (DAAC), and are archived and distributed by the DAAC.
Edited by: A. Hofzumahaus
References
Beirle, S., Platt, U., Wenig, M., Wagner, T.: Highly resolved global distribution of tropospheric NO2 using GOME narrow swath
mode data, Atmos. Chem. Phys., 4, 1913–1924, 2004,
SRef-ID: 1680-7324/acp/2004-4-1913.
Bovensmann, H., Burrows, J. P., Buchwitz, M., Frerick, J., Noel, S., Rozanov, V. V., Chance, K., Goede, A. P. H.: SCIAMACHY: Mission Objectives and Measurement Modes, J. Atmos. Sci., 56 (2), 127–150, 1999.
Bruns, M., Buehler, S. A., Burrows, J. P., Heue, K.-P., Platt, U., Pundt, I., Richter, A., Rozanov, A., Wagner, T., and Wang, P.: Retrieval of Profile Information from Airborne Multi Axis UV/visible Skylight Absorption Measurements, Appl. Opt., 43 (22), 4415–4426, 2004.
2
Burrows, J. P., Weber, M., Buchwitz, M., Rozanov, V., Ladstaetter-Weissenmayer, A., Richter, A., DeBeek, R., Hoogen, R., Bram-stedt, K., Eichmann, K.-U., Eisinger, M., and Perner, D.: The Global Ozone Monitoring Experiment (GOME): Mission Con-cept and First Scientific Results, J. Atmos. Sci., 56 (2), 151–175, 1999.
Fix, A., Ehret, G., Flentje, H., Poberaj, G., Gottwald, M., Finken-zeller, H., Bremer, H., Bruns, M., Burrows, J. P., Kleinboehl, A., Kuellmann, H., Kuttippurath, J., Richter, A., Wang, P., Heue, K.-P., Platt, U., and Wagner, T.: SCIAMACHY validation by air-craft remote measurements: design, execution, and first results of the SCIA-VALUE mission, Atmos. Chem. Phys. Discuss., 4, 8381–8423, 2004,
SRef-ID: 1680-7375/acpd/2004-4-8381.
Heland, J., Schlager, H., Richter, A., and Burrows, J.P.: First comparison of tropospheric NO2 column densities
re-trieved from GOME measurements and in situ aircraft pro-file measurements, Geophys. Res. Lett, 29 (20), 1983–1986, doi:10.1029/2002GL015528, 2002.
Heue, K.-P., Richter, A., Wagner, T., Bruns, M., Burrows, J.P., Friedeburg, C. V., Lee, W.-D., Platt, U., Pundt, I., and Wang, P.: Validation of SCIAMACHY tropospheric NO2-columns with
AMAXDOAS measurements, Atmos. Chem. Phys. Discuss., 4, 7513–7540, 2004,
SRef-ID: 1680-7375/acpd/2004-4-7513.
King, M.D., Tsay, S.-C., Platnick, S.E., Wang, M., and Liou, K.-N.: Cloud Retrieval Algorithms for MODIS: Optical Thickness, Effective Particle Radius, and Thermodynamic Phase, MODIS Algorithm Theoretical Basis Document No. ATBD-MOD-05 MOD06 – Cloud product (23 December 1997, version 5), 1997. Leue, C., Wenig, M., Wagner, T., Klimm, O., Platt, U., Jaehne,
B.: Quantitative analysis of NOx emissions from Global Ozone Monitoring Experiment satellite image sequences, J. Geophys. Res., 106 (D6), 5493–5506, doi:10.1029/2000JD900572, 2001. Martin, R. V., Chance, K., Jacob, D. J., et al.: An Improved
Re-trieval of Tropospheric Nitrogen Dioxide from GOME, J. Geo-phys. Res., 107 (D20), 4437–4457, doi:10.1029/2001JD001027, 2002.
Martin, R. V., Parrish, D. D., Ryerson, T. B., Nicks Jr., D. K., Chance, K., Kurosu, T. P., Fried, A., Wert, B. P., Jacob, D. J., and Sturges, E. D.: Validation of GOME satellite measurements of tropospheric NO2 and HCHO using regional data from air-craft campaigns in the southeastern United States, J. Geophys. Res., 109, D24307, doi:10.1029/2004JD004869, 2004.
McElroy, C. T., McLinden, C. A., and McConnell, J. C.: Evidence for bromine monoxide in the free troposphere during the Arctic polar sunrise , Nature, 397, 338–341, 1999.
Melamed, M. L., Solomon, S., Daniel, J. S., Langford, A. O., Port-mann, R. W., Ryerson, T. B., Nicks Jr., D. K., and McKeen, S. A.: Measuring reactive nitrogen emissions from point sources using visible spectroscopy from aircraft, J. Environ. Monit., 5, 29–34, 2003.
Nuess, J. H.: An improved tropospheric NO2retrieval from GOME
and SCIAMACHY measurements, PhD Thesis, University of Bremen, Germany, in German, 2005.
Petritoli, A., Ravegnani, F., Giovanelli, G., Bortoli, D., Bonaf, U., Kostadinov, I., and Oulanovsky, A.: Off-Axis Measurements of Atmospheric Trace Gases by Use of an Airborne Ultraviolet-Visible Spectrometer, Appl. Opt., 27, 5593–5599, 2002. Pfeilsticker, P. and Platt, U.: Airborne measurements during the
European Arctic Stratospheric Ozone Experiment: Observation of O3and NO2, Geophys. Res. Lett., 21, 1375–1378, 1994.
Platt, U.: Differential optical absorption spectroscopy (DOAS), in Air Monitoring by Spectroscopic Techniques, edited by: Sigrist, M. W., Chemical Analysis Series, Vol. 127, pp. 27–84, John Wi-ley, New York, 1994.
Richter, A. and Burrows, J. P.: A multi-wavelength approach to the retrieval of tropospheric NO2from GOME measurements,
Pro-ceedings of the ERS-ENVISAT symposium, Gothenburg, Octo-ber 2000.
Richter, A. and Burrows, J. P.: Tropospheric NO2 from GOME
measurements, Adv. Space Res., 29 (11), 1673–1683, 2002. Rozanov, V., Kurosu, T. and Burrows, J. P.: Retrieval of
atmo-spheric constituents in the uv-visible: a new quasi-analytical ap-proach for the calculation of weighting functions, J. Quant. Spec-trosc. Radiat. Transfer, 60 (2), 277–299, 1998.
Rozanov, A., Rozanov, V., Buchwitz, M., Kokhanovsky, A. and Burrows, J. P.: SCIATRAN 2.0 – A new radiative transfer model for geophysical applications in the 175–2400 nm spectral region, 35th COSPAR Scientific Assembly, 2004.
Wagner, T., Bruns, M., Burrows, J. P. and et al.: The AMAX-DOAS instrument and its application for SCIAMACHY validation, Pro-ceedings of the 15th ESA Symposium on European Rocket and Balloon Programs and Related Research (ESA SP-471, August 2001), Biarritz, France, 28–31 May, 2001.
Wang, P., Richter, A., Bruns, M., Burrows, J. P., Heue, K.-P., Wagner, T., Pundt, I., Platt, U.: SCIAMACHY validation with AMAXDOAS NO2 and O3measurements, Proceedings of the
2004 ENVISAT Symposium, in Salzburg, Austria, 6–10 Septem-ber 2004.