HAL Id: halshs-03182771
https://halshs.archives-ouvertes.fr/halshs-03182771
Submitted on 26 Mar 2021HAL is a multi-disciplinary open access
archive for the deposit and dissemination of sci-entific research documents, whether they are pub-lished or not. The documents may come from teaching and research institutions in France or abroad, or from public or private research centers.
L’archive ouverte pluridisciplinaire HAL, est destinée au dépôt et à la diffusion de documents scientifiques de niveau recherche, publiés ou non, émanant des établissements d’enseignement et de recherche français ou étrangers, des laboratoires publics ou privés.
The private return of R&D tax credit
Pierre Courtioux, Antoine Reberioux, François Métivier
To cite this version:
Pierre Courtioux, Antoine Reberioux, François Métivier. The private return of R&D tax credit. 2021. �halshs-03182771�
Documents de Travail du
Centre d’Economie de la Sorbonne
The private return of R&D tax credit
Pierre COURTIOUX, François METIVIER, Antoine REBERIOUX
The private return of R&D tax credit
Pierre Courtioux François Métivier Antoine Rebérioux
March 2021
Abstract: This article examines the private return on R&D tax credit, defined as the ratio of
total tax reliefs obtained by a firm through R&D tax credit to real R&D spending. Based on a dataset merging different sources for French companies, we first show that the distribution of this private return is dispersed. We then use clustering analyses to identify six mutually exclusive types of firms’ R&D strategies. We finally show in a regression setting that these strategies explain part of the variance in the private return on R&D tax credit. This study contributes to a better understanding of the heterogeneity of firms’ R&D strategies. It also seeks to open new directions in debates surrounding the proper design and reforms of R&D tax credit schemes.
JEL codes: C38, H25, O38
Key words: R&D; tax credit; firm strategies; firm heterogeneity
Acknowledgements: This research has benefited from an EMERGENCE grant from the IDEX
of the Université de Paris. The authors wish to thank Thomas Balcone, Gérard Forgeot and Camille Schweitzer for discussion on data. The usual disclaimer applies.
Paris School of Business & Centre d’Economie de la Sorbonne. E-mail: p.courtioux@psbedu.paris. Université de Paris, Institut de Physique du Globe de Paris. E-mail: metivier@ipgp.fr.
1. Introduction
The role of private R&D in fostering long-term, sustainable economic growth, as well as the failures of free-markets to deliver efficient levels of R&D, have long been recognized (Jaffe, 1989; Adams, 1990; Romer, 1992; Stephan, 1996). It has led governments in most countries to design a variety of mechanisms aimed at increasing R&D spending by private companies. Tax reliefs for firms engaged in R&D activity are one of these mechanisms, increasingly used by policy-makers in developed and emerging economies (Brown, et al., 2017; Bloom et al., 2019a).1 A vast number of studies have investigated the public return of such a mechanism, by estimating the (average) elasticity of R&D spending to tax reliefs (see Hall and Van Reenen, 2000; Becker, 2015; Beck et al., 2017 for surveys).2 But beyond this question, we know very little about the private return of R&D tax credit, from the firms’ point of view. In particular, we ignore the way tax credit schemes are incorporated within firms’ profit and R&D strategies, that are commonly observed to be heterogeneous (see e.g. Coad, 2019). In this paper, we address the question of how the French R&D tax credit (Crédit d’Impôt Recherche, CIR) is used by private companies and we show how different uses are associated with different (monetary) returns. By identifying the relationships between companies’ research strategies and fiscal rewards, the present study contributes to a better understanding of the heterogeneity of firms’ strategies. It also seeks to open new directions in debates surrounding the proper design and reforms of R&D tax credit schemes.
The crédit d’impôt recherche (CIR) belongs to a set of French programmes (also including direct subsidies or public support to young innovative firms) aimed at increasing private R&D. The programme was launched in 1983 and has undergone several substantial reforms. The last and most important one was enacted in 2008, with the shift from a mostly incremental to a fully volume-based system. Since that date, 30% of the yearly R&D spending declared by companies to the fiscal administration may be deducted from the corporate income tax or refunded if no income tax is due.
Since the 2008 reform, the total cost of the tax credit system has boomed – from 1.5 to nearly 6 billion euros in the mid-2010s – while the number of firms benefiting from the credit has more than tripled over that period. For one part, it may reflect a process of relabelling, by which firms are led to declare (to fiscal authorities) investments or spending that they would have done anyway (see Hall and Van Reenen, 2000 or Bloom et al., 2019a). But the magnitude of the aforementioned evolution also suggests that a deeper process is at stake. While the CIR was typically used by large industrial companies engaged in research-intensive activities prior to 2008, the population claiming the credit is now much diverse. A new business has emerged, with the creation of consulting firms that support companies in building their R&D activities and in designing their tax credit claim. This has led public authorities to structure this emerging sector by referencing and labelling more than 40 firms, now recognized as expert intermediaries
1 The OECD (2018) reports that 33 countries currently use tax credit to support innovation in the corporate sector. 2 The three surveys conclude that tax credits are found to have positive effects on private R&D, with average elasticities close to unity. For more recent evidence, see Bodas Freitas et al. (2017), Brown et al. (2017), Bloom et al. (2019), Guceri et al. (2019) and Agrawal et al. (2020). For the French case, the country we investigate, evaluations have been made by Duguet (2004), Marino et al. (2016) or Montmartin et al. (2018). Reviewing the various impact studies devoted to the French case, Harfi and Lallement (2019) consider that on average, 1€ of R&D tax credit adds 1€ to private R&D – in line with the three aforementioned literature reviews.
for CIR claims. Alongside these labelled players, there exists a multitude of organizations (independent consultants, law firms, etc.) which devote all or part of their activities to CIR consulting.
This suggests that the French R&D tax credit went beyond triggering private R&D. It also leads to somehow redefine what is and what is not R&D. Indeed, innovation is a socio-technic activity (Latour, 1991); even framed within standard definitions3, there is a variety of possible
interpretations as to what should be understood as innovation and R&D. Conventional wisdom tends to consider firms as passive in face of public support: firms engage in R&D and, finding out that public mechanisms allow to decrease the real cost of R&D, they thereafter increase their effort. Allegedly, firms are much more active. They think and adapt (with the help of intermediaries) their activities to the changing regulatory framework. The consequences are potentially important. Firms may find difficult or costly to declare to the fiscal administration some spending that they actually consider to be part of their R&D activity. By contrast, firms may integrate into their declaration spending that they did not consider through the lens of R&D activity beforehand, with a clear intention to mislead the regulator (relabelling). Companies may also build new R&D strategies, consistent with their own capabilities or sector. Ultimately, this potential heterogeneity should show up in the dispersion of the real (fiscal) rate of return of R&D spending, around the headline rate of 30%.
To check this, we calculate this real return on R&D spending for companies, by computing the ratio of total tax reliefs obtained through the CIR to the total real R&D spending as informed in independent R&D surveys (when R&D executives are questioned on what they are actually doing). A return of 20%, for example, indicates that the company receives, in the form of a tax credit, one-fifth of its actual R&D spending. Figure 1, panel A, plots the distribution of the private return, for firms that declared R&D to fiscal authorities in year 2013. It confirms that there is a significant dispersion around the 30% expected rate of return. About one fifth of the companies received more than 40% of their actual spending, while one quarter received less than 20%. Bloom et al. (2019a) have stressed that France is one of the most generous countries in terms of tax credit; we therefore add to this observation that the system is not equally generous for all companies. Moreover, Figure 1, panel B, shows that the heterogeneity in R&D tax credit private returns remains large across various company sizes.
3 The Frascati Manual is used as a guideline by administrative public authorities to define and identify R&D activity.
Figure 1. Distribution of the private return on R&D tax credit
Panel A. Whole sample
Panel B. By company size
Reading: about 20% of intermediate size companies have a private return on R&D tax
credit lower or equal to 10% (i.e. they gain a maximum of 10 cents for 1€ of R&D expenditure)
Source: ERD 2013 (MESRI), GECIR (MESRI, DGFiP) – authors’ calculation.
0 0.1 0.2 0.3 0.4 0.5 0.6 R a te of r ta x r e tu rn Percentiles Whole sample 0 0.1 0.2 0.3 0.4 0.5 0.6 0.7 R at e o f rt ax r e tu rn Percentiles
In this paper, we explore the diversity of firm R&D and tax credit claim strategies and the way it relates to the private return of R&D tax credit. We use a unique dataset, merging three distinct sources for year 20134: a survey on R&D performed by French firms (Enquête sur la Recherche
et Développement, ERD), an administrative file reporting the details of R&D tax credit claims
at the firm level (GECIR), and firm-level accounting and financial data (Liasses fiscales). We then use clustering methods that allow us to identify a small set of mutually exclusive strategies. We finally study, using multivariate regressions, the conditional correlation of these various strategies with the private tax credit return.
We identify six main mutually exclusive strategies: i) Patent management strategy, ii) self-contained R&D strategy, iii) Optimisation strategy, iv) Capital investment strategy, v) Public-oriented research strategy, and vi) Human capital-intensive strategy. Furthermore, we show that the private return on tax credit is significantly associated to these strategies, even controlling for structural characteristics of the business firms (such as industry, size, age, etc.). More precisely, we report evidence that two of these strategies – namely the Human capital-intensive strategy and the Optimisation strategy – are associated with a (conditional) premium of respectively 3.2 and 2.4 percentage points (in terms of rate of return). By contrast, the Public-oriented research strategy and the Patent management strategy deliver significantly lower payoffs. We also find evidence that two sectors (finance and building) are associated with significant (conditional) premium. In terms of policy, these results invite to consider with more details the mechanisms that lead these strategies and industries to leverage their average R&D tax credit returns.
The paper builds on and ties to two lines of research: one on the heterogeneity of firm strategies and the other on the R&D tax credit.
The observation that firm strategies, regarding human resource management for instance, are heterogeneous or diverse is a longstanding one, in the economics of the firm (see e.g. Haltiwanger et al., 2007; Bloom et al., 2019b) or in management (Lenox et al., 2006). Regarding innovations, since Pavitt (1984), a number of studies have highlighted the heterogeneity of firms and R&D strategies (see e.g. Belderbos et al., 2004; de Jong and Marsili, 2006; Coad, 2019; Gkotsis and Vezzani, 2019), related to their (hardly observable) “R&D-related capabilities" (Cohen and Klepper, 1992). For instance, de Jong and Marsili (2006) identify four categories of small innovative firms operating in the Netherland, while Coad (2019) notes “that
there is considerable heterogeneity in R&D intensities between firms in the same sector, and that this heterogeneity is persistent.” (p.38). We add to the literature by exploring the way fiscal
considerations are integrated within firm R&D strategies, increasing the potential heterogeneity in firm innovative strategies. The French case is of particular interest, as it offers one of the most generous tax incentives among OECD and emerging countries – with potentially significant impact on the choice and design of R&D strategies by private companies.
Second, we complement the literature on R&D tax credit. So far, most studies have investigated the return of this mechanism from the regulator point of view (how much private R&D spending increases for 1 euro of public spending in terms of tax credit? see e.g. González and Pazó, 2008;
Yang et al., 2012; Crespi et al., 2016; Marino et al., 2016; Bodas Freitas et al., 2017; Gucieri and Liu, 2019; Agrawal et al., 2020; Ivus et al., 2021). While crucial to assess the effectiveness
4 When we started this research (in year 2019), 2013 was the most recent available file for the GECIR database. Since then, the access to the 2014 file has been open.
of the mechanism, these evaluations provide few indications to policy makers in reforming R&D tax program designs (see Crespi et al., 2016 and Bodas Freitas et al., 2017 for a discussion). As we consider the private return of R&D spending, i.e. the return for the firms themselves (how much do companies gain in terms of tax credit for 1 euro really invested in R&D), our results help to go beyond traditional impact analysis of R&D tax credit. In particular, identifying firms’ strategies and replies to public policy lead to a better understanding of R&D public policy support. Our approach suggests that changes in the programme architecture and compliance process are still possible, that may ultimately improve its effectiveness (i.e. increasing the quantity and improving the quality of innovative activities).
At this stage, a caveat is required: our analysis is descriptive, not causal. We first use cluster analysis to classify multivariate data into sub-groups (strategies); we then estimate the conditional correlation between these strategies and the rate of return on R&D tax credit. While reverse causality (running from returns to strategies) is unlikely, we cannot rule out the possibility that an omitted variable determines simultaneously the choice of a particular strategy and the rate of return. However, our dataset allows capturing a rich set of information regarding R&D practices and strategies (investment in tangible capital, human resource management in research, patents and depreciation costs, use of public funds, etc.), and controlling for selection biases. Accordingly, we are confident that our estimates provide important insights to explain the variance in the private rate of return on R&D tax credit.
The rest of the paper is structured as follows. Section 2 briefly introduces the French tax credit system. Section 3 presents the data as well as the empirical strategy. Section 3 reports the results of the clustering analysis, while Section 4 is devoted to regression analyses. Section 5 offers a discussion of the main results and Section 6 concludes.
2. The French CIR: characteristics and functioning
Under the CIR regime, five kinds of R&D spending are eligible to tax credit, and can therefore be declared to fiscal authorities: (1) researcher labour costs (including social contributions), (2) depreciation costs on R&D capital investment, (3) operating costs (that correspond to a flat rate of 50% applied to researcher labour costs and to a flat rate of 75% applied to R&D capital depreciation costs), (4) spending related to intellectual property (fees for patents, etc.) and (5) R&D externalized to other companies or to public research centres or universities. A rate of 30% is applied on this fiscal basis, to calculate the level of the tax credit.
However, specific rules may affect companies’ fiscal return on R&D spending. On the one hand, two rules contribute to increase the company’s fiscal return above the standard headline rate of 30%. First, the Young PhD programme (Dispositif Jeunes Docteurs) allows companies to double the labour cost of PhDs with an open-ended contract, for the first two years following their appointment. Second, in the case of R&D externalized to a public subcontractor the spending is also counted two times in the fiscal base. On the other hand, two rules contribute to decrease the return below 30%. First, a firm that benefit from direct public subsidies has to exclude them from its fiscal base. Second, over 100 million euros of R&D spending declared to fiscal authorities, the R&D tax credit rate falls to 5%. However, this concerns very few firms (15, in our sample).
In addition, R&D activities are not necessarily defined similarly in the R&D survey and in the CIR tax report. It results in a gap, stable over time and of around 10 billion euros, in R&D spending as measured in the two sources (Schweitzer, 2019). It also results in additional variability in the distribution of the R&D spending private return. The main differences are the followings. First, labour costs of non-researchers involved in R&D (i.e. technicians and administrative staff) could not be declared to the CIR but are usually included in current R&D spending in survey. Ceteris paribus, the rate of return therefore decreases with the number of research employees that are not (direct) researchers. Second, the spending related to intellectual property is not counted as current R&D spending but it could be declared to the fiscal administration. Ceteris paribus, the rate of return is then an increasing function of spending for intellectual property. Third the actual operating cost of a company may differ from the operating cost that can be legally declared (as a flat rate).
To declare its R&D spending to the French fiscal administration, a company has (i) to fill in a dedicated tax form – a dataset based on these tax forms is used in our study, see below – and (ii) to join a “free” description of the R&D projects corresponding to the tax form. This very process could also explain why some firms tend to under-declare R&D spending to the CIR. The tax doctrine concerning R&D tax credit evolves over time and access to an efficient tax or innovation counsellor may be costly. A company may then decide to report only part of its R&D activity, when the administrative costs related to a given project is excepted to be too high. In the same vein, a company may opt for a strategy of fiscal prudence (following the advices of its innovation counselling, for instance), therefore minimizing its R&D efforts.
The various dimensions of the French R&D tax credit scheme could be combined so as to increase the fiscal return for the company. For instance, investing in the construction of a research laboratory (rather than renting one) can be a rewarding strategy, driven by fiscal considerations. The real operating costs decrease (because the firm no longer has any rent to pay), while the declared operating costs remain constant (as they are mostly based on a flat rate on labour costs). In addition, new capital depreciation costs (generated by the investment) could be declared to fiscal authorities, thereby increasing tax credit. Finally, grouping the research staff in its own research lab could ease the identification process of spending dedicated to R&D, therefore reducing the risk of rejection or facilitating the compliance process.
The previous discussion suggests that companies have a significant latitude in organising R&D activity and declaring it to fiscal administration. Because of its design and the need to disclose to the administration, the French R&D tax credit has become de facto an element of the company R&D strategy.
3. Data, empirical strategy, variables and descriptive statistics
The previous section has argued that R&D tax credit claim needs to be considered as a component of firms’ R&D strategy. To further support this argument, we first intend to identify the various types of strategies that are implemented. We then investigate the way variety in firm strategies is related with the dispersion of the rate of returns on R&D spending (as displayed in Figure 1). Ultimately, we seek to identify high-rewarding and low-rewarding strategies.
The data
To identify R&D strategies, we need information on the various dimensions of R&D activity and spending and on R&D tax claim, at the company level. To compute firms’ private rate of return on R&D, we also need information on the amount of tax credit ultimately received by firms.
First, we use the French Survey on Corporate R&D (ERD), for 2013, that informs on the amount and types of spending related to R&D at the firm level (see Marino et al., 2016, for a detailed presentation). This mandatory and representative survey is produced each year by the French Ministry of Higher Education, Research and Innovation (MESRI). Our second data set is the 2013 GECIR file that informs on R&D tax credits. It is managed jointly by the MESRI and the Ministry of Finance. It is a comprehensive administrative dataset, that includes all corporate fiscal declarations of R&D spending for the CIR claim in 2013. Our unit of analysis is what we call a ‘research firm’ – i.e. an economic organization that has devoted some of its resources for R&D spending in year 2013. This is the basic unit of observation in the R&D survey. However, a research firm may be composed of several companies (legal persons). In this case, the respondent (in the survey) indicates each of these companies (through the SIREN identification number) and fills the R&D survey by aggregating information across all these companies. Companies are the basic French fiscal units and constitute, as such, the level of observations of the GECIR files. We simply sum-up the tax credit items indicated in the GECIR files, following the aggregation pattern reported in the R&D survey. Finally, we match these two databases (R&D survey and GECIR) with the general company tax reporting (Liasses fiscales), to obtain company-level accounting and financial information. These are non-consolidated financial statements: for business groups (or multi-companies research firms), it is not possible to obtain consistent quantitative variables. However, we can use some information, like the age of the firm or its legal form. For a multi-companies research firm, we keep the variables of the oldest company composing the organization.
Out of 8,320 research firms observed in the R&D survey, 1,344 do not claim the CIR. We finally obtain a sample of 6,976 observations, including almost all firms that claim the CIR. This is our baseline sample, used to perform the clustering analysis. Multi-companies research firms account for a very small part of our sample, around 1.5% of our observations. In the following analysis, we use indifferently the terms company and firm. In our sample, the mean value of the CIR fiscal return is 29.89%, very close from the headline rate of 30%.5
The empirical strategy
We consider that there exist an unknown but limited number N of R&D strategies. Our main assumption is that a R&D strategy of type i (Si=1, …, N) is consistent, but is not directly
observable. We also assume that a strategy could be proxied by various observable characteristics (Fj= 1, …, P). The first step of our analysis is the identification of Si=1, …, N from
this set Fj= 1, …, P.
5 When using analytical weight provided by the data producer, we obtain a mean return of 31.4%. This slight discrepancy mirrors the data collecting process of the R&D survey, which is almost exhaustive for large firms but not for small ones: as shown in Figure 1, firm size is associated with differences in the rate of return.
Importantly, the F set include variables related to real R&D spending and variables related to R&D tax credit claim: in our clustering, we therefore consider simultaneously the two types of variables. This is in line with our main assumption, stating that R&D tax credit claims are part of a global R&D strategy, rather than a mere function of R&D activity. Put differently, separating the two would be required if firms were first defining their R&D activities, and then claiming the tax credit in consequence. However, our central argument is that firms consider simultaneously the two dimensions, engaging in some R&D activities (investment, recruitment, etc.) in light of what could be done in terms of tax credit claim. Note that as we plan in a second step to model the rate of return R as a function of our set S of mutually exclusive strategies, we obviously exclude R from the set F, as well as variables informing on the amount of R&D tax credit received by firms (and so directly related to R). Accordingly, when incorporating variables coming from the GECIR database, we will use information on the amount of R&D declared (not on CIR perceived).
We run successively a Principal Component Analysis (PCA) and a Hierarchical Agglomerative Clustering (HAC) analysis. PCA analysis is a method commonly used in taxonomy exercises, allowing to obtain uncorrelated dimensions (or latent variables). Combined with a clustering method like HAC, it reduces the risk that any single indicator dominates the clustering results (Everitt, 1993; Hair et al., 1998).6 Accordingly, we run a HAC based on the components of the PCA. The optimal number of clusters – i.e. the number of clusters that maximize inter-cluster variance and minimize intra-cluster variance7 – sets the number N of strategies.
In a second step, we perform OLS regressions, to identify the conditional correlation between
R (the rate of return on R&D spending) and firm strategies (S). We therefore estimate the
following model:
Ri = α Si + C’i β + εi (1)
where i indicates the firm, Ci is a vector of (firm-level) control variables, and εi is the error term.
As indicated previously, 1,344 firms actually engaged in R&D activities do not claim the CIR, for various reasons (complexity of the administrative process, reluctance to have contact with the fiscal authorities, etc.). This (self) selection process may generate a selection bias. To correct for this bias, we use, as a robustness check, a two-step Heckman selection model (Heckman, 1979). We first estimate a selection equation (probit model), where the dependant variable is a dummy (CIR) equal to 1 if the firm claims the CIR, and 0 otherwise:
Pr (CIRi) = Ω (Z’i γ) (2)
Z include all the variables of the C vector, plus a variable that we expect to be correlated with
the take-up of the tax credit, but not with the fiscal return (exclusion restriction). For each observation i, the inverse of the Mills ratio (or non-selection hazard mi) is computed8. The
6 See for instance de Jong and Marsili (2006) for an application of this combined method to obtain a taxonomy of innovation strategies by small firms.
7 This so-called Ward method is generally considered as providing good results compared to other clustering method – de Jong and Marsili (2006); Milligan and Cooper (1987).
8 The inverse Mills ratio is the ratio of the probability density function to the complementary cumulative distribution function.
step estimates are then obtained with model (1) augmented with mi as a regressor (controlling
for selection effect).
The variables
The variables used in the PCA are listed and described in Table 1. For PCA, using variables in level generally leads to identify a first component corresponding to a size effect. For instance, in our case, the level of economic activity (turnover) is obviously correlated with the number of employees, as well as with the level of R&D spending. While these correlations are easily captured by a PCA and could increase the total variance explained by one of the components, they are poorly informative (as far as we do not want firm size to be a variable defining R&D strategy). Accordingly, we compute all our variables as ratios where the denominator is related to firm size: we therefore net out the clustering of any pure size effect. Moreover, we do not consider information on the amount of R&D tax credit received by firms, as it is ultimately what we want to explain. Rather, when we incorporate variables coming from GECIR, we use information on the amount of R&D declared (not on CIR perceived).
Table 1. Variables (definition and source) used in the clustering analysis
Note: French Survey on corporate R&D (ERD) produced by the French Ministry of Higher Education Research
and Innovation (MESRI). Fiscal files of R&D tax claim (GECIR) produced by the MESRI and the French Public Finance General Directorate (DGFiP).
The variables presented in Table 1 can be distinguished in three groups.
First, a set of six variables comes exclusively from the Survey on corporate R&D (ERD). These variables are used to characterize R&D activity, irrespective of tax credit claims. We first include the Intensity of Research Spending (IRS, defined as total R&D spending on turnover) – which is a standard indicator to measure firms’ effort in R&D and that has been shown to be
Definition Sources IRS Intensity of research spending R&D spending/ Turnover
IRI Intensity of research investment Capital R&D spending/ R&D spending SPF Share of public funding Public funding/ R&D spending
SRS Share of research staff R&D workforce (in person)/ Total workforce (in person) SRRS Share of researchers in research staff Researcher workforce (in person)/ R&D workforce (in person) IRAR Intensity of research activity per researcher Researcher workforce (in FTE)/ Researcher workforce (in person) SPHD Share of PhD cost Declared young PhDs costs / Declared R&D spending SDEP Share of (capital) depreciation Declared depreciation costs / Declared R&D spending SPAT Share of patents' cost Declared Patent management spending / Declared R&D spending
CROC Coverage rate for operating cost Operating cost decared to CIR*/ Operating costs** *GECIR (MESRI, DGFiP) CRLC Coverage rate for labour cost R&D payroll declared to CIR*/ R&D payroll** **ERD (MESRI) CRSC Coverage rate of subcontracting cost Declared externalized R&D spending*/ externalized R&D spending**
Variable
ERD (MESRI)
GECIR (MESRI, DGFiP)
highly heterogeneous across organisations (Coad, 2019). We then consider the two main components of R&D expenditures (or the two main production factors): R&D capital and R&D personnel. For capital, we compute the Intensity of Research Investment (IRI, defined as investment in R&D capital divided by total R&D spending). For R&D human capital, we use three distinct ratios: the Share of Research Staff in total employment (SRS), the Share of
Researchers in Research Staff (SRRS) and the Intensity of Research Activity per Researcher
(IRAR). Overall, we include more variables to characterize R&D human resource management than what is usually found in the literature: for instance, Schmid and al. (2014) only consider the Share of Research Staff (SRS), while Jong and Marsili (2006) use a dummy variable equals to 1 if the “firm employed people who were occupied with innovation in their daily work”. By contrast, we are able to integrate the intensity of research activity by researcher (IRAR) and the fraction of ‘real’ researchers among the research staff (SRRS). These are important dimensions, as far as having a team of pure researchers devoting 90% of their time to research is certainly different from a research team mainly composed of supporting employees, with researchers devoting less than 40% of their activity to research. Finally, we include in our analysis of firms’ strategies the Share of Public Funding in total R&D spending (SPF). Public funding includes all funding received by the company from public agencies (ministries, universities, local authorities, etc.) in the form of contracts, subsidies or advances, as well as incentive credits – with the exception of tax credit (CIR and Young PhD programme). It is obviously a critical dimension of R&D strategy, especially considering the importance of R&D (direct) subsidies in most economies (see e.g. Beck et al., 2017, for a survey).
A second set of three variables comes exclusively from the R&D tax credit files (GECIR). These variables complement the description of R&D strategies by providing additional information, that cannot be observed with the R&D survey (ERD). These variables are all computed with declared R&D spending used as denominator (in order to neutralize size effects). These variables are the following: the Share of PhD cost in R&D spending (SPHD), the Share
of capital depreciation spending (SDEP) and the Share of costs related to Patents (SPAT,
measuring the importance of intellectual property management). These three shares go from 0 to 1. The first two (PhD costs and depreciations costs) allow a more detailed description of human and non-human capital investment (respectively), while the third informs on a new, important aspect.9
A third set of three variables mixes two sources: ERD and the fiscal file of CIR claims (GECIR). On three dimensions, we are able to compare what is done for real in terms of R&D (as indicated in the ERD), and what firms declare so as to benefit from the tax credit (as indicated in GECIR). Therefore, these variables inform on the magnitude of optimization strategy in terms of credit claim. These are new, original variables (regarding the literature on R&D taxonomy), consistent with our main research hypothesis (which is to consider simultaneously R&D activity and fiscal claim). The first variable is the Coverage Rate for Operating Cost (CROC) that compares the level resulting from the flat rate of 50% on staff and of 75% on the depreciation costs – see section 2.2 – to real operating costs (by computing the ratio of the former on the latter). The second variable is the Coverage Rate for Labour Cost (CRLC) and the third one is the Coverage
Rate of Subcontracting Costs (CRSC). To avoid excluding from our sample observations that
are not mathematically defined (for instance, firms that do not externalize R&D), we add 1€ to the denominator. Ultimately, a value greater than 1 indicates that the firm declares more to the
9 Note that we do not use an indicator based on the number of patents, a standard proxy of R&D output or efficiency. Our goal here is not to measure R&D efficiency.
fiscal administration than what it has actually spent. It does not necessarily mean that the company cheats the administration – see section 2.2 – but indicates that an optimization strategy is implemented.
In our regressions, the dependent variable is R, the return on R&D tax credit for companies, defined as the amount of the tax credit received divided by the level of real (internal and external) R&D spending. We have shown previously that the variance of this variable is quite large. As explanatory variables, we introduce firm strategies (as defined by the HAC), and we control for the following firm characteristics: industry (9 categories), scientific field (9 categories), age (in 5 classes) and size (in 4 classes corresponding to public administration operative categories) (see the Appendix Tables A1 and A2 for more details on industries and scientific fields), as well as two dummies indicating whether the firm acts as subcontractor, and whether the firm declares an amount of R&D spending larger than 100 million euros (the R&D tax credit rate falls to 5% above this threshold).
Descriptive statistics
Descriptive statistics for variables used in the clustering analysis are reported in Table 2: we observe that the distribution of some variables is highly skewed, with the risk for our clustering process to be driven by extreme observations. For these skewed variables, we apply a log-transformation (adding 1€ when the variable is equal to 0).
Table 2. Summary statistics for research firms: active variables
Source: ERD 2013 (MESRI), GECIR (MESRI, DGFiP) – authors’ calculation.
The median for the intensity of research spending is about 10%. A significant number of firms did not invest in research capital, so that the median for the intensity of research investment is 0, but the average is 5% (of total research spending): labour cost is by far the primary (research) cost. The mean value for the share of public funding is 8.4%, but a number of companies do not use any public funding (other than the CIR) – so that the median is equal to 0. On average, research staff represents 40% of the workforce, with pure researchers accounting for 70% of this staff and devoting around 60% of their working time to research activity. The medians of the coverage rates for operating cost and labour cost are close to 1 (meaning that companies tend to declare approximately what they have indeed incurred). Finally, the shares of costs (in
Number of observations mean min max median std skewness IRS Intensity of research spending 6,976 10,559 0.000 16,018,000 0.096 270,862 42.200
log (IRS) 6,976 -2.249 -12.737 16.589 -2.345 2.523 2.000
IRI Intensity of research investment 6,976 0.052 0.000 1.000 0.000 0.118 3.400 SPF Share of public funding 6,976 0.084 0.000 12,658 0.000 0.342 15.800
log (SPF) 6,976 -9.717 -20.945 2.538 -11.871 5.091 0.700
SRS Share of research staff 6,976 0.414 0.000 1.000 0.327 0.339 0.500 SRRS Share of researchers in research staff 6,976 0.688 0.020 1.000 0.725 0.295 -0.400 IRAR Intensity of research activity per researcher 6,976 0.623 0.000 1.000 0.643 0.334 -0.300 SPHD Share of PhD cost 6,976 0.010 0.000 0.667 0.000 0.050 8.200 SDEP Share of (capital) depreciation 6,976 0.037 0.000 1.000 0.008 0.070 3.700 SPAT Share of patents' cost 6,976 0.041 0.000 1.000 0.030 0.098 5.400 CROC Coverage rate for operating cost 6,976 42,020 0.000 16,744,838 1.021 314,875 28.800
log (CROC) 6,976 -9.523 -19.176 0.000 -11.051 4.805 1.100
CRLC Coverage rate for labour cost 6,976 79.892 0.000 193,529 0.987 3,157.906 49.000
log (CRLC) 6,976 -0.461 -16.616 12.173 -0.013 1.365 -5.000
CRSC Coverage rate of subcontracting cost 6,976 21,640 0.000 11,545,818 0.000 277,069 24.000
log (CRSC) 6,976 -0.209 -16.238 16.262 0.000 4.345 -0.100
declared R&D spending) related to PhDs, capital depreciation and patents are, respectively, 1%, 3.7% and 4%. Descriptive statistics for control variables are reported in Appendix, Table A3. We observe that around 40% of research firms operate in the manufacturing sector (against less than 10% for the whole French productive sector). Our sampled firms are also rather old (around two third have more than 10 years), and 58% are small and medium companies.
4. Clustering results
Table A4 (in Appendix) presents the results obtained with the PCA. The three main components explain only 40.3% of the total variance, whereas the two main components explain 29.7% of the total variance. Using variables in level (i.e. not normalized by firm size) for the PCA would have artificially increased the explanatory power of the first components10 (but the correlations would have been driven by size effects). We therefore decide not to focus on the description of the three main components – as usually done for PCA – but rather directly on the clustering (HAC). We run a clustering based on all the components i.e. we make the hypothesis that there is no residual noise in the mapping captured by the less informative components of the PCA. The optimal number of clusters is six.
Figure 2 summarizes the agglomerative process of companies’ strategies produced by the HAC – as it appears from a dendogram.11 The dendogram first shows that the use of public funding
allows differentiating two broad sets of strategies: companies that benefit from few public funding, developing R&D on their own agenda and funds, and those that have developed more intense relationships with public agencies (benefiting from public contracts, direct subventions, etc. – excluding the CIR). In the first case (autonomous research), it is possible to distinguish between two sub-categories: companies that have a ‘self-contained research’ strategy (S2), and a small group of firms that focus on ‘patent management’ (S1). Among the strategies that tend to benefit from a high-level of public support, a first differentiating factor is the relative place of PhDs. A subgroup of firms tends to appoint a significant number of young PhDs and to declare the related costs to the administration: we call this group ‘R&D human capital-intensive’ enterprises (S6). Among the firms that focus less on PhDs, a differentiating factor is the relative level of R&D capital investment (real estate dedicated to research, machines for labs, etc.) and lead to isolate the ‘capital investment’ strategy (S4) from others. Considering the rest of companies, it is possible to make a distinction between firms who have a ‘public-oriented research’ strategy (S5), having strong relationships with the public sector, from those who tend to implement an ‘optimisation’ strategy (S3) (benefiting from the loopholes of the French R&D tax credit).
10 When we do so, the two main components explain 54% of the variance, and the three main components 63%. 11 The complete dendogram is available upon request.
Figure 2. A mapping of R&D strategies’ types
Source: ERD 2013 (MESRI), GECIR (MESRI, DGFiP) – authors’ calculation.
Table 3 indicates the distribution of these 6 strategies (using proper statistical weight computed by the data producer).
Table 3. The distribution of R&D and fiscal claim strategies
Note: The two columns on the right side are weighted statistics.
Source: ERD 2013 (MESRI), GECIR (MESRI, DGFiP) – authors’ calculation.
Table 4 reports the statistics (mean and standard deviation) of the original variables for the 6 identified groups. We rely on these statistics to give a broad overview of each of these 6
Number of observations Relative frequency (in %) Relative weighted frequency (in %) Share of researchers (full time equivalent in %)
S1 Patent management strategies 62 0.9 1.0 0.3
S2 Self-contained research strategies 2,338 33.5 31.9 22.1
S3 Optimisation strategies 894 12.8 14.5 5.2
S4 Capital investment strategies 477 6.8 7.4 2.1
S5 Public-oriented strategies 3,058 43.8 42.5 69.7
S6 Human capital-intensive strategies 147 2.1 2.7 0.7
6,976 100.0 100.0 100.0
Strategies
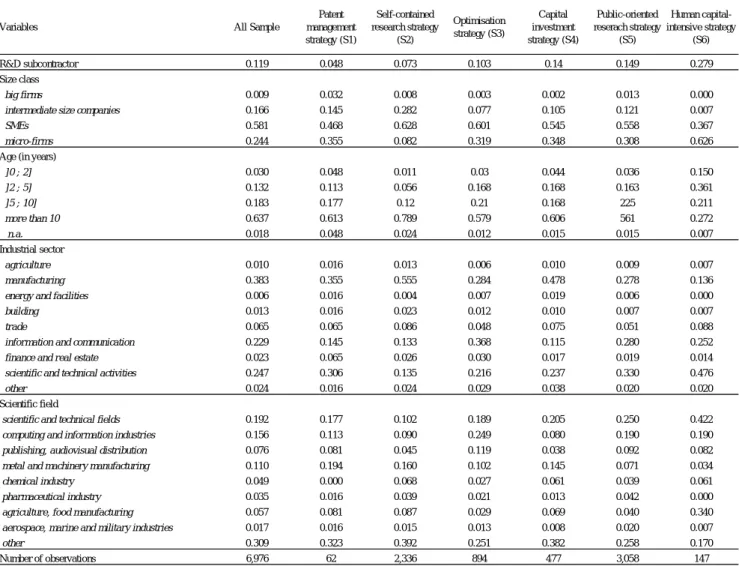
strategies (see below). Descriptive statistics for control variables across strategies is indicated in Appendix, Table A5.
Table 4. Descriptive statistics (mean and standard deviation) for active variables used for strategies clustering by cluster
Note: standard deviation in parentheses.
Source: ERD 2013 (MESRI), GECIR (MESRI, DGFiP) – authors’ calculation.
Self-contained research strategy (S2)
This strategy is largely diffused; it concerns 31.9% of French firms claiming for R&D tax credit, and 22.1% of the researchers employed (see Table 3). It groups together a number of companies that use few public funding to develop their R&D (2.9% on average, against 8.4% for the whole sample). Furthermore, we observe that R&D is a rather marginal activity for these companies: the mean value for the Intensity of Research Spending (IRS) is way below the sample mean value (the picture is exactly the same if we consider the median: it is equal to 3% for the self-contained strategy, against 10% for the whole sample). The apparent correlation between a low use of public funding and a low research intensity highlights the importance of the public sector in the French private R&D ecosystem. Consistent with the low level of R&D activity, we see that on average, the research staff represents only 19.8% of the workforce, against 41.4% for the whole sample (see Table 4). However, the researchers are more focused on their research activity: ‘pure’ research activity represents 66.1% of their working time (versus 62.3% on
All Sample Patent management strategy (S1) Self-contained research strategy (S2) Optimisation strategy (S3) Capital investment strategy (S4) Public-oriented reserach strategy (S5) Human capital-intensive strategy (S6) IRS Intensity of research spending 10,559 7,960.3 2.60 0.70 3,133.0 22,997.9 9,089.3
(270,862.2) (62,610.0) (111.7) (7.6) (38,508.4) (408,081.7) (75,883.8)
log (IRS) -2.249 -3.057 -3.486 -2.564 -1.963 -1.327 -0.417
(2.52) (3.40) (1.80) (1.98) (2.74) (2.63) (2.73)
IRI Intensity of research investment 0.052 0.061 0.030 0.009 0.330 0.037 0.067 (0.12) (0.15) (0.06) (0.03) (0.23) (0.07) (0.13) SPF Share of public funding 0.084 0.036 0.029 0.089 0.094 0.117 0.225 (0.34) (0.12) (0.32) (0.35) (0.45) (0.33) (0.42)
log (SPF) -9.717 -10.114 -12.420 -9.965 -9.693 -7.772 -5.572
(5.09) (4.12) (3.34) (4.52) (4.94) (5.38) (5.22)
SRS Share of research staff 0.414 0.410 0.198 0.455 0.461 0.549 0.663 (0.34) (0.40) (0.22) (0.34) (0.36) (0.32) (0.31) SRRS Share of researchers in research staff 0.688 0.714 0.627 0.730 0.658 0.72 0.836 (0.30) (0.31) (0.30) (0.31) (0.31) (0.28) (0.24) IRAR Intensity of research activity per researcher 0.623 0.514 0.661 0.549 0.496 0.638 0.603 (0.30) (0.38) (0.35) (0.34) (0.33) (0.32) (0.31) SPHD Share of PhD cost 0.010 0.000 0.002 0.003 0.005 0.005 0.297 (0.050) (0.000) (0.011) (0.013) (0.020) (0.019) (0.156) SDEP Share of (capital) depreciation 0.037 0.083 0.029 0.014 0.168 0.029 0.020
(0.070) (0.206) (0.044) (0.031) (0.149) (0.045) (0.027) SPAT Share of patents' cost 0.041 0.378 0.067 0.016 0.030 0.025 0.022
(0.098) (0.474) (0.120) (0.044) (0.052) (0.044) (0.027) CROC Coverage rate for operating cost 42,020 7,218.5 16,695 218,454 60,875 8,553 21,493 (314,874.7) (45,587.5) (384,101.9) (488,524.5) (219,907.0) (158,689.1) (55,403.7)
log (CROC) -9.523 -7.301 -11.237 0.000 -8.20 -11.32 -7.93
(4.81) (5.51) (2.85) (0.00) (4.99) (2.90) (4.73)
CRLC Coverage rate for labour cost 79.892 0.0 0.784 617.674 1.030 0.875 0.832 (3,157.91) (0.00) (0.63) (8,806.79) (2.60) (0.90) (0.38)
log (CRLC) -0.461 -11.561 -0.525 -0.193 -0.306 -0.295 -0.347
(1.37) (2.11) (0.90) (1.23) (0.88) (0.63) (0.74)
CRSC Coverage rate of subcontracting cost 21,640 660.5 62,894.7 118.2 6,836.5 161.5 56.5 (277,069.48) (3,654.77) (475,578.08) (2,406.51) (38,804.63) (7,152.61) (527.21) log (CRSC) -0.209 -3.059 1.762 0.034 -0.079 -1.701 -1.206 (4.35) (5.74) (4.68) (0.82) (4.67) (4.01) (3.61) 6,976 62 2,338 894 477 3,058 147 Variables Number of observations
average), and they benefit from a relatively large technical staff (the share of researchers among research staff is 62.7% versus 68.8% on average). This relatively small number of researchers working intensively on R&D activity goes with a propensity to adjust the volume of R&D activity by externalizing and declaring it largely to the CIR (the average coverage rate of subcontracting costs is the highest of all the R&D strategies identified here). This suggests that these companies, by relying significantly on R&D outsourcing, tend to focus in core knowledge-intensive task, as described in García-Vega and Huergo (2019). This strategy concerns more frequently intermediary-size companies (28.2% versus 16.6% on average) and SMEs (62.8% versus 58.1% on average); it is overrepresented in the manufacturing sector (55.5% versus 38.3% on average), construction (2.3 versus 1.3% on average) and in the commerce sector (8.6% versus 6,5% on average).
Patent management strategies (S1)
This is the less diffused strategy, and it rather appears as a spinoff of the self- contained research strategy. It concerns 1% of the firms and 0.3% of the researchers – see Table 3. The main characteristic of this strategy, beside its low use of public funding, is a very high level of patent costs – representing on average 37.8% of declared R&D, against 4.1% for the whole sample (see Table 4). Companies belonging to this category also have a relatively high share of depreciation costs (SDEP), meaning that they have recently done capital investment in R&D. They tend to have relatively more researchers in their research staff than the average, but they under-report their costs for CIR and they do not declare young PhDs in their staff. Accordingly, these companies appear to manage the rent of past investments in R&D (capital investment, but also researcher hiring). The fact that they tend to under-declare the payroll of their research staff may indicate that some of their present activity would not be considered as “pure” R&D tasks by the administration. This strategy is overrepresented at the extremes of the size distribution (big companies and micro-business), but also in the financial industry (6.5% versus 0.23% on average) and scientific sector (30.6% versus 2.3% on average).
The remaining four groups are characterized by higher use of public funding, as compared to the patent and to the self-contained strategies.
Human capital-intensive strategy (S6)
This strategy is not largely diffused, as it concerns only 2.7% of the firms claiming for R&D tax credit, and accounts for 0.7% of the researchers employed – see Table 3. It groups together firms that are highly intensive in scientific human capital: the share of research staff and the share of researchers in the research staff are the highest. This strategy also leads to the highest level in the share of PhD costs (29.7% versus 1.0% in the whole sample). The level of capital investment is relatively high (6.7% against 5.2% for the whole sample) but way below what we observe for the capital investment strategy (see infra). This strategy has strong financial relationships with the public sector: firms implementing this strategy have the highest share of public funding (22,5% versus 8,4% in the whole sample). Small organizations are clearly overrepresented in this category (62.6% of micro-firms against 24.4% for the whole sample). We also observe an over-representation of these firms in the science and technique sector (47.6% versus 24.7% of the whole sample). We also note that companies implementing this
strategy are rather young, at the beginning of their research activity (15% has less than 2 years
versus 3% in the whole sample). Capital investment strategy (S4)
This strategy concerns 7.4% of the firms that benefit from the CIR and 2.1% of the researchers – see Table 3. The main characteristic of these firms is their high level in R&D capital investment: they have the highest level of intensity in R&D capital investment (IRI) but also the highest share of depreciation costs (SDEP) – see Table 4. By contrast, the average research intensity for researchers (IRAR) is the lowest (49.6% versus 62.3% on average), whereas their research department have less researchers and more technicians than the average – the SRRS amounts to 65.8% versus 68.8% on average. In sum, they favour physical (research) capital, to the detriment of human capital. This kind of strategy is overrepresented among micro-firms (34.8% versus 24.4% on average). It is consistent with the fact that in small firms, researchers have to take in charge other activity than ‘pure’ research. These firms are overrepresented in the energy and amenities sector (1.9% versus 0.6% in average) and in the manufacturing sector (47.8% versus 28,3% on average).
Public-oriented research strategy (S5)
This strategy is well diffused among companies claiming for French R&D tax credit: it concerns 42.5% of the firms and 69.7% of the researchers employed – see Table 3. This strategy is implemented by firms with a high share of public funding (11.7% versus 8.4% on average). As such, they are integrated within the public-private French R&D ecosystem. Besides, this strategy stands out by a high level of research intensity (IRS). Overall, it appears as the exact opposite of the Self-contained research strategy (S2). The level of capital investment intensity (IRI) is low, in particular when compared with the Capital investment strategy (S4). The three optimizing indicators (CROC, CRLC, CRSC) are below the average. This is consistent with the fact that companies implementing this strategy rely heavily on public funding, like subsidies: these funds must be deducted from the total amount declared to the R&D tax credit claim and then contribute to the small levels of optimizing indicators. Firms in this category are overrepresented at the extreme of the size distribution: 1.9% are big firms12 (versus 0.9% in the whole sample) and 30.8% are micro-firms (versus 24.4% in the whole sample). These firms operate more frequently in the information and communication sector (28.0% versus 22.9% on average) and on the scientific and technique sector (33.0% versus 24.7% on average). The link with public funding is also apparent when we consider research fields: firms implementing this strategy are over-represented in the aeronautics, naval and military research fields (2.0% versus 1.7% on average in the whole sample) and drugs field (4.2% versus 3.5% in the whole sample) – where the French State is highly involved (as a client, or as a large blockholder).
12 More over this strategy corresponds to firms that declare an amount of R&D spending above the threshold who lead to decrease the marginal tax credit rate of return for the firm.
Optimisation strategies (S3)
This last strategy concerns 14.5% of the companies that claim for French R&D tax credit and account for 5.2% of the researchers employed – see Table 3. This strategy is characterized by very high levels of coverage rates for operating costs and labour costs. Companies grouped here may therefore be involved in relabelling strategy: when interviewed as part of an R&D survey, managers may not consider some activities that are nevertheless reported to fiscal authorities to benefit from tax credit. Alternatively, after having completed the ERD survey, managers may have become aware that some of their activity is eligible to the R&D tax credit. These strategies may have been advised by R&D consulting firms, that are now numerous in the French case. Besides, the intensity of research spending (IRS) is very low on average as well as the intensity of research investment (IRI). This optimisation strategy is found all over the size distribution of companies but is over-represented at the bottom of the size distribution: micro-firms represent 31.9% (versus 24.4% on average) and the SME 60.1% (versus 58.1% on average). This strategy concerns more frequently the information and communication industry (36.8% versus 22.9% on average) and also the finance industry (3.0 % versus 2.3% on average). In conclusion, our empirical analysis leads to identify two major opposite strategies, which group respectively 32% and 42% of research firms: the self-contained strategy and the public-oriented strategy. Close to the first one, we can identify a strategy, used by a small group of firms, which is characterized by the importance of patent management. Closer to the second (because they rely significantly on public funding), three more strategies can be observed: one intense in (R&D) physical capital (7.5% of the firms), one intense in (R&D) human capital (2.7% of the firms) and the last, characterized by a propensity to optimise on fiscal request (14.5% of the firms).
5. Regression results
We now investigate in a regression setting the (conditional) correlation between the previously identified R&D strategies and the private return of R&D tax credit. To avoid our estimates being driven by extreme values, we trim the return at the 1% and 99% levels. Our regression sample then includes 6,836 observations.
Regression results are reported in Table 5. In the first model (column 1), we regress the fiscal return of R&D on the R&D strategies, where the self-contained strategy is taken as a reference. This model explains about 9% of the variance in the fiscal return. Besides, we observe that two strategies (optimization and human-capital intensive) are associated with significant higher returns, of a large magnitude (respectively +11.4 and +17 percentage points, as compared to the self-contained strategy, for an average sample mean of 29.9%). This is consistent with our previous discussion. R&D human capital-intensive firms are characterized by an important use of young PhDs; it allows these firms to declare more R&D spending to the fiscal administration. We also know from section 4 that firms implementing an optimization strategy are characterized by a high coverage of R&D personnel spending and operating cost: as such, they fully benefit from the legal flat rate of operating costs.
In model 2 (column 2), we only consider baseline control variables, namely firm size, firm age, industry, scientific research field, plus two dummies indicating whether the firm acts as a subcontractor and whether its R&D spending is above the 100 million euros threshold: the model only explains 5% of the variance in fiscal return, almost half as much as the previous model. Firm strategies, that are heterogeneous within industry, research field, firm age or size, have therefore a larger explanatory power than standard, structural dimensions. Looking at estimated coefficients, we observe that taking SMEs as a reference, micro-firms have an average rate of 2.5 percentage points higher, whereas intermediate size companies and big firms tend to have respectively rates lower of 5 and 6.6 percentage points. This result is consistent with the meta-regression analysis performed by Castellaci and Lie (2015): they have shown that the additionally effect of R&D tax credit is stronger for SMEs – see also Kobayashi (2014) for Japan. Few industrial sectors are significantly associated with the fiscal return, with the exception of the finance and real estate industry, and the building industry, that are associated with a premium. As expected, we observe that begin a subcontractor significantly decreases the fiscal return (as the principal may choose to claim the outsourced R&D), just like being above the 100 million euros threshold.
Table 5. Regression of firms’ rate of fiscal returns on R&D strategy
Note: standard deviation in parentheses; significative at *** 1% level, ** 5% level, * 10% level. Source: ERD 2013 (MESRI), GECIR (MESRI, DGFiP) – authors’ calculation.
In model 3, we consider simultaneously strategies and structural characteristics. The model explains 12.2% of the whole variance in fiscal return. Importantly, we observe that the correlation between firm strategies and the rate of fiscal return remains significant, even when controlling for firm size and age, industry and research field. It supports the idea that (i) there
Intercept 0.267 (0.003) *** 0.293 (0.005) *** 0.290 (0.006) *** 0.281 (0.009) *** 0.311 (0.012) ***
R&D strategy
Patent management strategy -0.028 (0.021) -0.048 (0.021) ** -0.044 (0.021) ** -0.049 (0.021) **
Self-contained research strategy ref. ref. ref. ref.
Optimisation strategy 0.114 (0.006) *** 0.095 (0.006) *** 0.095 (0.006) *** 0.095 (0.006) ***
Capital investment strategy 0.010 (0.007) -0.004 (0.007) -0.004 (0.007) -0.004 (0.007)
Public-oriented strategy -0.006 (0.004) -0.020 (0.004) *** -0.017 (0.004) *** -0.020 (0.004) ***
Human capital-intensive strategy 0.170 (0.012) *** 0.142 (0.013) *** 0.146 (0.013) *** 0.142 (0.024) *** Size class
big firms -0.066 (0.022) *** -0.056 (0.021) *** -0.050 (0.022) ** -0.067 (0.022) ***
intermediate size companies -0.049 (0.005) *** -0.044 (0.005) *** -0.044 (0.005) *** -0.052 (0.007) ***
SMEs ref. ref. ref. ref.
micro-firms 0.025 (0.005) *** 0.021 (0.005) *** 0.027 (0.005) *** 0.035 (0.009) *** Age (in years)
]0 ; 2] -0.006 (0.011) -0.011 (0.011) -0.011 (0.011) -0.012 (0.011)
]2 ; 5] 0.011 (0.006) * 0.007 (0.006) 0.007 (0.006) -0.002 (0.008)
]5 ; 10] 0.008 (0.005) 0.009 (0.005) * 0.009 (0.005) * 0.001 (0.006)
more than 10 ref.
n.a. -0.001 (0.018) 0.003 (0.017) 0.014 (0.021) 0.025 (0.021)
Industrial sector
agriculture 0.033 (0.023) 0.028 (0.022) 0.004 (0.027)
manufacturing 0.000 (0.007) -0.005 (0.007) -0.007 (0.007)
energy and facilities 0.006 (0.023) 0.000 (0.023) 0.009 (0.024)
building 0.075 (0.017) *** 0.064 (0.016) *** 0.069 (0.017) ***
trade 0.007 (0.009) 0.001 (0.009) -0.003 (0.009)
information and communication 0.007 (0.010) 0.000 (0.010) -0.003 (0.011)
finance and real estate 0.049 (0.014) *** 0.040 (0.013) *** 0.035 (0.014) **
scientific and technical activities ref. ref. ref.
other 0.020 (0.013) 0.0104 (0.013) 0.019 (0.014)
R&D subcontractor -0.01962 (0.006) *** -0.02058 (0.006) *** -0.019 (0.006) *** -0.011 (0.008)
100 millions treshold -0.12804 (0.043) *** -0.11542 (0.041) *** -0.111 (0.042) *** -0.115 (0.004) ***
Inverse Mills ratio -0.085 (0.045) *
R² R² adjusted Observations
Estimates OLS OLS OLS OLS Heckman two-step
Detailed sectors no no no yes no
Scientific fields dummies no yes yes yes yes
6,836 6,836 6,836 6,836 6,836
0.0896 0.04980 0.1247 0.1424
0.0890 0.0464 0.1208 0.1302
is a variety of research strategies even within industry, and (ii) these strategies are significant drivers of the private return of R&D tax credit. Further, we observe that while the coefficients on the two ‘rewarding’ strategies (optimization and R&D human capital-intensive) are slightly reduced (9.5 and 14.2 percentage points respectively), the coefficients on patent management strategy and on public-oriented strategy increase (in absolute value) and become significant: the two strategies are associated with a discount, of about 5 percentage points for the former and 2 percentage points for the latter. These results are consistent with what we know of the two strategies from section 4: the public oriented-strategy tends to benefit from high levels of public subsidies, that have to be deducted from the fiscal basis used to compute the amount of tax credit. We also know that the patent-management strategy is focused on a rent-management approach rather than on intensive R&D activity, a characteristic that could explain the estimated discount. The size effect continues to hold (with a significant discount for large organizations), while we still observe a significant premium in the finance and real estate industry, as well as in the building industry.
We test the robustness of our results in two different ways.
First, in model 4 (column 4), we control for much more detailed sectors (in 88 positions, instead of 9: see Table A1 for the detail). Our results are robust: in particular, we continue to observe a significant discount associated with the patent management strategy and with the public-oriented strategy (4.4 and 1.7 percentage points, respectively) and a significant premium associated with the optimisation and the human capital-intensive strategy (9.5 and 14.6 percentage points respectively). It indicates that there is a strong heterogeneity of firms R&D strategies, even within narrowly defined industry (Coad, 2019), and that this heterogeneity is directly associated with the private return of R&D tax credit.
Second, as indicated above, 1,344 out of 8,320 research firms (i.e. 16.2% of the firms that are observed in the research survey) do not declare any research to the administration. Non take-up of tax credit by firms carrying out private research is likely to be non-random, potentially generating biased estimates in our OLS modelling. To correct for selection bias, we use a standard two-step Heckman model. Note that we first drop the observations for which the private fiscal return on R&D is below or above the first and the last percentiles (that is 140 observations, 2% of our baseline sample of 6,976). Indeed, these observations correspond to companies that claim the tax credit (so that they are not concerned by the non take-up), but for which the fiscal return takes extreme values. The selection model is therefore estimated on 8,180 observations (1,344 censored and 6,836 uncensored). For the exclusion restriction, we use a variable informing on the legal statute of the firm. More precisely, we introduce in the selection equation (2) a dummy variable that takes value 1 if the company is a public limited company (PLC, Société anonyme in French), 0 otherwise. PLCs are used by large, visible firms, with a clear internal functional division of labour or organizational structure. As such, it is unlikely that these firms try to pass “under the radar” of fiscal authorities or that they do not have the in-house resources to complete CIR forms. Accordingly, we expect the PLC statute to be negatively correlated with the non take-up of tax credit (or positively correlated with CIR claim). By contrast, it is no clear that this legal form, by itself, should have any consequence on the magnitude of the fiscal return. 18% of our 8,180 observations are PLCs. The results of the first stage equation are displayed in Appendix, Table A6. As expected, the coefficient on the PLC dummy (exclusion restriction) is significant and positive (0.285 with a standard error of 0.049), indicating than non take-up is less frequent for PLCs. Turning to the fiscal return
equation (Table 5 Model 5, column 5), we see that the coefficient on the inverse Mills ratio is significant and negative (-0.085, with standard error equal to 0.045), indicating that some (unobserved) factors that make CIR take-up more likely are associated with a lower fiscal return on R&D. Our results on strategy are virtually unchanged (as compared to Model 3). Correction of the selection bias mainly affects the size variables, with an increase in the discounts associated with large firms and intermediate size companies of about 1 percentage point.
6. Discussion
Most of the literature on R&D tax credits has focused on assessing the public efficiency of the scheme. Microeconometric studies have in particular examined the rate at which private R&D expenditures increase, due to the introduction of fiscal incentives (additionality ratio) or to the decrease in the marginal costs of R&D (user-cost elasticity). Eventually, other outputs have been considered, such as the number of patents or the magnitude of job creation in research activity. Basically, an additionality ratio or a user-cost elasticity (in absolute value) greater than 1 are interpreted as a sign of ‘crowding-in effect’ (Marino et al., 2016): public policy is somehow successful in triggering private R&D. By contrast, the estimation of elasticities lower than 1 casts suspicion on the effectiveness of the system, as it indicates that (at least some) firms benefit from the system without significantly leveraging their effort in R&D. However, as stressed by Crespi et al. (2016) or Bodas Freitas et al. (2017), this approach does not provide much help to policy makers in reforming R&D tax program designs: which firms need to be particularly targeted? which mechanisms, regarding R&D reporting or the computation of the credit, need to be revised?
In this study, we have shown that the distribution of R&D fiscal returns is dispersed and associated with various firm’s characteristics.
More precisely, our results show that some R&D strategies yield high, significant discount or premium regarding the private fiscal rate of return on R&D, irrespective of size and industry effects. The Public-oriented strategy is associated with a small yet significant discount, of about 2% (as compared to the Self-contained strategy). Firms highly beneficiating from pubic support, under the form of subsidies in particular, are somewhat at a disadvantage regarding tax credit: it indicates that the two mechanisms (direct subsidies and tax credit) act more as substitute than complementary. This conclusion suggests that in the future, empirical studies should provide deeper attention to the combination of various measures in favour of R&D – see Montmartin et al. (2018) for an evaluation and a discussion in this vein, at the regional level.
By contrast, the Optimization strategy is associated with an average bonus of 9.5 percentage points. This strategy is not negligible. Based on our computation for 2013, it concerns 5.5 percent of the whole amount of credit distributed –i.e. assuming that the share of this strategy among companies has remained constant over time, it corresponds grosso modo to 358 million euros in the current CIR regime.13 It suggests the existence of a deadweight loss for the programme that could be diminished by modifying some rules like the flat rate for operating costs and/or increasing controls on these costs. One could expect some substantial gains for the taxpayer if the corporate fiscal returns for this strategy go back to the average rate. The human
13 The last available data of the French Ministry (MESRI, 2020) estimated that in 2018 the CIR amounts to 6,5 billion euros.