HAL Id: hal-00295836
https://hal.archives-ouvertes.fr/hal-00295836
Submitted on 6 Feb 2006
HAL is a multi-disciplinary open access
archive for the deposit and dissemination of
sci-entific research documents, whether they are
pub-lished or not. The documents may come from
teaching and research institutions in France or
abroad, or from public or private research centers.
L’archive ouverte pluridisciplinaire HAL, est
destinée au dépôt et à la diffusion de documents
scientifiques de niveau recherche, publiés ou non,
émanant des établissements d’enseignement et de
recherche français ou étrangers, des laboratoires
publics ou privés.
aerosol and new particle growth in a Finnish forest
during QUEST 2 using an Aerodyne Aerosol Mass
Spectrometer
J. D. Allan, M. R. Alfarra, K. N. Bower, H. Coe, J. T. Jayne, D. R. Worsnop,
P. P. Aalto, M. Kulmala, T. Hyötyläinen, F. Cavalli, et al.
To cite this version:
J. D. Allan, M. R. Alfarra, K. N. Bower, H. Coe, J. T. Jayne, et al.. Size and composition measurements
of background aerosol and new particle growth in a Finnish forest during QUEST 2 using an Aerodyne
Aerosol Mass Spectrometer. Atmospheric Chemistry and Physics, European Geosciences Union, 2006,
6 (2), pp.315-327. �hal-00295836�
www.atmos-chem-phys.org/acp/6/315/ SRef-ID: 1680-7324/acp/2006-6-315 European Geosciences Union
Chemistry
and Physics
Size and composition measurements of background aerosol and new
particle growth in a Finnish forest during QUEST 2 using an
Aerodyne Aerosol Mass Spectrometer
J. D. Allan1,2, M. R. Alfarra1,*, K. N. Bower1, H. Coe1, J. T. Jayne3, D. R. Worsnop3, P. P. Aalto4, M. Kulmala4, T. Hy¨otyl¨ainen5, F. Cavalli6, and A. Laaksonen7
1School of Earth, Atmospheric & Environmental Science, University of Manchester, UK
2Distributed Institute for Atmospheric Composition, NERC Centres for Atmospheric Science, UK 3Aerodyne Research Inc., Billerica, MA, USA
4Department of Physical Sciences, University of Helsinki, Finland 5Department of Chemistry, University of Helsinki, Finland
6Institute of Atmospheric Sciences and Climate, Consiglio Nazionale delle Ricerche, Bologna, Italy 7Department of Applied Physics, University of Kuopio, Finland
*now at: Laboratory for Atmospheric Chemistry, Paul Scherrer Institut, Switzerland
Received: 1 August 2005 – Published in Atmos. Chem. Phys. Discuss.: 14 September 2005 Revised: 12 December 2005 – Accepted: 30 December 2005 – Published: 6 February 2006
Abstract. The study of the growth of nucleation-mode
parti-cles is important, as this prevents their loss through diffusion and allows them to reach sizes where they may become ef-fective cloud condensation nuclei. Hyyti¨al¨a, a forested site in southern Finland, frequently experiences particle nucle-ation events during the spring and autumn, where particles first appear during the morning and continue to grow for sev-eral hours afterwards. As part of the QUEST 2 intensive field campaign during March and April 2003, an Aerodyne Aerosol Mass Spectrometer (AMS) was deployed alongside other aerosol instrumentation to study the particulate com-position and dynamics of growth events and characterise the background aerosol. Despite the small mass concentrations, the AMS was able to distinguish the grown particles in the
<100 nm regime several hours after an event and confirm that the particles were principally organic in composition. The AMS was also able to derive a mass spectral finger-print for the organic species present, and found that it was consistent between events and independent of the mean par-ticle diameter during non-polluted cases, implying the same species were also condensing onto the accumulation mode. The results were compared with those from offline analyses such as GC-MS and were consistent with the hypothesis that the main components were alkanes from plant waxes and the oxidation products of terpenes.
Correspondence to: J. D. Allan
(james.allan@manchester.ac.uk)
1 Introduction
The processes governing the formation of new aerosol par-ticles are a very important aspect of atmospheric science to understand and quantify. For instance, the number concen-trations of atmospheric particles affects the microphysics of clouds, which may affect their rainfall, lifetime and optical properties and in turn, global climate (Penner et al., 2001; Twomey, 1977). In addition to mechanical and combustion processes, new particles can be created from the nucleation of gas phase species (Kulmala et al., 2000; Kulmala, 2003). These events have been observed in a variety of environments worldwide and may be a significant factor in the repopulation of particle numbers lost through deposition. Typically, these particles are measured in high numbers (∼105cm−3)at their source and occur in discrete ‘bursts’. There are thought to be many different precursor species responsible, specific to each environment, which can be of either natural or anthropogenic origin (Kulmala et al., 2004b).
In addition to the processes governing the initial forma-tion of the particles, the mechanisms behind the subsequent growth must also be understood and quantified if they are to be considered in regional and global climate models, as the new particles must grow to significant sizes (∼102nm) if they are to affect the optical properties of the atmosphere and clouds. Also, smaller particles have very high Brownian velocities, so would quickly diffuse onto available surfaces and therefore have short atmospheric lifetimes if the growth processes were absent. Particle coagulation is one process responsible, but the addition of extra mass through gas to
particle conversion is also important. The gas species respon-sible may or may not be the same ones that are responrespon-sible for the initial nucleation.
The study of freshly-nucleated particles is inherently dif-ficult due to their small size. The direct observation of the number and size of particles less than around 2.5 nm in di-ameter is currently impossible with commercially-available instrumentation. Similarly, the study of the chemical com-position of these particles is limited by the small amounts of matter they posses. The composition of atmospheric par-ticles can be studied by first collecting them in bulk on fil-ter or impactor substrates for offline analysis. While these techniques permit the use of many powerful analytical proce-dures, limitations are imposed by the need to collect a signif-icant amount of particulate matter during sampling, depend-ing on the analytical technique used. This, in turn, means that the samplers must be operated for several hours contin-uously, which is undesirable for the study of dynamic sys-tems such as this. Also, while cascade impactors offer some size-resolved data, the resolution is generally poor compared to that possible with dedicated sizing instrumentation. It is possible to collect particles as small as 10 nm with suitable low-pressure impactors, although concentrators must be used to collect large enough samples, even when working in a pol-luted environment (Geller et al., 2002).
The chemical composition of growing ultrafine particles has been measured previously using aerosol mass spectrom-etry, although in different environments. Using an Aerodyne Aerosol Mass Spectrometer (AMS), Zhang et al. (2004a) were able to show that the composition of the growing parti-cles was predominantly sulphuric acid during the earliest ob-servable stages of formation events in Pittsburgh in Septem-ber 2002. The particles in more advanced stages of growth showed amounts of ammonium and later still, organic matter was found to be present. The composition of ultrafine parti-cles during nucleation events in Atlanta has also been stud-ied using a Thermal Desorption Chemical Ionization Mass Spectrometer in series with Differential Mobility Analysers (Smith et al., 2005), who also concluded that ammonium sul-phate was the principal condensing species.
Nucleation events have also frequently been observed in non-polluted environments, such as the Hyyti¨al¨a forestry re-search station in southern Finland (e.g. Kulmala et al., 2001). The compositions of growing particles in a forested environ-ment such as this are expected to be different to those in ur-ban environments. The chemical analysis of growth event aerosols from a previous study at Hyyti¨al¨a was presented by M¨akel¨a et al. (2001), who analysed samples collected with cascade impactors using ion chromatography (IC). The anal-ysis of samples taken on days where nucleation took place showed little significant difference to the samples from other days, except for extra amounts of methanesulphonic acid and dimethylamine. However, it may be that much of the matter that made up the growing particles were not be observable using IC, through either insolubility or chemical instability.
The Quantification of Aerosol Nucleation in the European Boundary Layer (QUEST) 2 field campaign, which took place during March and April 2003, was an intensive study into these phenomena at Hyyti¨al¨a. It is thought that in this particular environment, the biogenic VOCs and their oxida-tion products are responsible for the growth of the particles, although the initial formation is thought to happen though the nucleation of sulphuric acid with water and/or ammonia (Kulmala et al., 2000). For a detailed study into the initial nucleation and early stages of growth during this study, the reader is directed to Kulmala et al. (2004a). Each nucleation burst normally occurred during the morning of a given day and the particles typically grew in size during the follow-ing hours into the evenfollow-ing and night, providfollow-ing no air mass changes occurred. This did not happen every day, meaning that each day could be classed as either an “event” or “non-event” day. The event days at Hyyti¨al¨a are mostly confined to the spring and autumn months. During the campaign, an extensive suite of particle, gas and meteorological instrumen-tation was deployed, which included an AMS.
2 Experimental
In addition to the AMS, other aerosol samplers were de-ployed for offline mass and chemical characterisation. In par-ticular, some 5-stage Berner low-pressure impactors (Berner et al., 1979) were deployed by the CNR Bologna group. Each substrate set collected aerosol from multiple event or non-event days, in order to collect as much mass of a particu-lar aerosol type as possible. Samples collected using these were either weighed for gravimetric mass measurement or dissolved in water for IC and water soluble organic carbon (WSOC) analysis. More details on this work is presented in Cavalli et al. (2005). Aerosols were also collected on quartz filters using high-volume samplers for offline anal-ysis at the Department of Chemistry, Helsinki, using tech-niques such as gas chromatography-mass spectrometry (GC-MS). For more information on the sampling methodology, the different types of organic analyses performed on the fil-ter samples and the results obtained, the reader is directed to Anttila et al. (2005), Shimmo et al. (2004) and Rissanen et al. (2006). Some of the particle physical data used in this publication were derived from instrumentation permanently deployed as part of the collocated Station for Measuring For-est Ecosystem-Atmosphere Relations (SMEAR) 2, in partic-ular the Differential Mobility Particle Sizer (DMPS) system (Aalto et al., 2001), which was used to count and size the particles between approximately 3 and 1000 nm on 10 min intervals.
The AMS, its operation and data analysis techniques are dealt with in detail elsewhere (Allan et al., 2003a; Allan et al., 2004a; Jayne et al., 2000; Jimenez et al., 2003), but some specific modifications that were made are described below. The instrument thermally flash vaporises the non-refractory
component of the submicron particles and analyses the resul-tant vapours in situ using 70 eV electron ionisation (EI) and a quadrupole mass spectrometer. The data are processed to de-rive quantitative mass concentrations of various components such as sulphate, nitrate, organics and ammonium. It also uses the aerodynamic sizing of selected m/z channels to de-liver these data as a function of particle diameter. In addition to the main inorganic m/z (16, 30, 36, 48, 64) a selection of principally organic m/z were selected (27, 43, 44, 55, 57, 67, 77, 91).
By inspecting the mass spectra, it is also possible to de-rive information regarding the overall nature of the organic fraction. While, the mass spectra produced by the instru-ment have been shown to be largely comparable with those in 70 eV mass spectral libraries such as NIST (2003), some differences introduced by the temperature of the vaporiser. These can occur through two mechanisms: One is that the ex-tra heat imparted onto the molecules during vaporisation may increase the amount of internal energy during ionisation, in-creasing the likelihood of bonds breaking; the second effect is that some species may fragment on the surface of the va-poriser during vaporisation, so the vapour molecules ionised by EI are chemically different from the parent species. For simpler organic molecules, the locations of the peaks within the spectra are unchanged, but first effect manifests as a bias in the relative peak sizes towards the low m/z peaks in the spectrum (note that PAHs are a known exception to these, due to their extra molecular stability). When more complex molecules are studied, in particular oxygenated, multifunc-tional species, the second effect causes the mass spectrum to be dominated by smaller ions such as CO+2 (Alfarra, 2004; Silva et al., 20061). Note that neither effect changes the num-ber of ions produced, therefore the instrument’s quantitative capability is maintained.
While the mass spectrometric evaluation of the aerosol ensemble does not yield as much information as more spe-cialist offline analytical procedures, the fact that it is per-formed in real time and in situ means that time resolutions of minutes are possible and artefacts associated with gas phase interchanges and handling are eliminated. Also, the size-resolving capability allows the particle chemical composi-tions to be assigned to individual particle modes identified using sizing equipment such as the DMPS. The AMS data is capable of studying the dynamic chemical composition of the particles during the growth stages as a function of par-ticle size with high resolution, which can in turn reduce the ambiguity when linking the accurate sizing and number data produced by the dedicated sizing instrumentation and the de-tailed chemical composition data derived from the various offline analyses.
1Silva, P., Canagaratna, M., Jimenez, J. L., Jayne, J. T., Kolb,
C. E., Davidovits, P., and Worsnop, D. R.: Quantitative Analysis of Non-refractory Fine Particles Using Aerosol Mass Spectrometry, Aerosol Sci. Technol., in preparation, 2006.
The instrument uses an aerodynamic lens to focus the par-ticles as they are introduced into the instrument (Liu et al., 1995a, 1995b), before the majority of the gas phase material is skimmed off and the aerosol beam introduced into the de-tection region. Aerodynamic lenses are capable of focussing particles with 100% efficiency over a given range of aero-dynamic diameters, in this case 30 to 700 nm (Zhang et al., 2002, 2004b). Particles smaller than 30 nm do not posses enough inertia to be focussed correctly, so the instrument is unable to study those in the early stages of the growth pro-cesses. Another limitation is imposed by the signal to noise ratios of the processed data, which are directly linked to the total amount of mass the particles possess and the sensitivity of the mass spectrometer. This factor also hampers the study of the small particles, although the temporal averaging of the data mitigates this.
To complement the standard deployment of the AMS, the instrument was also fitted with additional equipment to iden-tify and hopefully quaniden-tify particle collection biases. In a previous experiment during ITCT 2K2 at Trinidad Head, California, 2002, it was noted that the collection efficiency of the instrument varied as a function of the relative humidity of the aerosol sampled (Allan et al., 2004b). The speculation made at the time was that the effloresced particles were irreg-ularly shaped and as a result, were forming a more divergent beam in the aerodynamic lens through lift forces that in turn resulted a smaller number being detected.
To probe this behaviour further, a temperature control system similar in principle to that used during ITCT 2K2 was deployed, although instead of using water from a temperature-controlled bath in a jacket around the AMS in-let, a Peltier thermoelectric cooler (Marlow Industries model AT12-6, Dallas, TX, USA) was used to control the inlet tem-perature directly (Allan, 2004). The inlet assembly around the critical orifice used to control the flow was encased in a small copper block to which the Peltier cooler was at-tached in a compression fitting. The Peltier cooler itself was operated using a programmable controller (Oven Indus-tries model 5C7-362, Mechanicsburg, PA, USA), employing a feedback loop connected to a bead thermistor located next to the pinhole. The setpoint was continuously calculated and updated using a computer and matched to a relative humid-ity, based on the ambient temperature and humidity measure-ments provided by a solid-state probe (Rotronic model Hy-groclip SC05, Crawley, West Sussex, UK). For the first half of the experiment, the inlet was at cabin temperature (which was generally much larger than ambient), while in the latter half, the inlet temperature was matched to 90% RH above water.
In addition to the temperature control, a beam probe was installed in the instrument’s chamber immediately prior to the detection region. This consisted of a wire that was moved in and out of the aerosol beam by a servo motor, in effect an automated version of the probe used by Jayne et al. (2000). This operated continuously during sampling,
100 80 60 40 20 0 A tte nu at io n of s ec to r ( % ) -1.0 -0.5 0.0 0.5 1.0
Wire position (fraction of vaporiser radius) 100 80 60 40 20 0 No cooling 90 % RH
Fig. 1. Beam profiles with and without inlet cooling, based on the
measured sulphate mass concentrations with and without the wire interposed in the particle beam. The attenuations are normalised to 100%. Both graphs were generated from data taken from peri-ods when accumulation mode particles (mass mode at around 300– 400 nm) dominated the mass concentrations.
alternating between a fully open position and one of seven blocking positions every two minutes (the “unblocked” data were the only ones used for the standard analyses). By study-ing the reduction in the measured signal as a function of wire position, a horizontal profile of the aerosol beam could be generated. When comparing the attenuations of the differ-ent wire positions for the low (cabin temperature) and high (90%) humidity sampling scenarios, it does appear that the humidity does have an effect on the divergence (Fig. 1). At high humidity, a large fraction of the particles are confined within the centre region of the particle beam, while at lower humidities, they are more spread out, showing that phase changes in the particles can cause a degree of beam diver-gence. The next stage is to quantify what overall effect this has on the instrument detection efficiency. To this end, recent work has been undertaken at the University of Colorado at Boulder to model the response of the beam probe technique to theoretical particle beams of varying divergence (Huff-mann et al., 2005). According to this work, for a noticeable fraction of particles to miss the vaporiser, the beam atten-uation at the centre wire position must be around 15% or less for a 0.39 mm wire. As Fig. 1 shows, the attenuation in the dry case is around 30% for a 0.5 mm wire, which, as a low estimate, would translate as an attenuation of 23% for a 0.39 mm wire. This means that while there is a degree of beam divergence when studying the ambient particles in this case, the divergence itself does not significantly affect the instrument collection efficiency.
2.5 2.0 1.5 1.0 0.5 0.0 dM /d lo gD va (µ g m -3 ) 4 5 6 100 2 3 4 5 6 1000 2 3
Vacuum Aerodynamic Diameter (nm) Ammonium Nitrate Sulphate Organics
Fig. 2. Mass distribution from a period of arctic influence (20
March).
More recently, results obtained by Aerodyne Research Inc. and Boston College using an in situ light scattering probe when sampling ambient aerosols (Cross et al., 2004), seem to suggest that beam divergence is not the main reason for the loss of dry particles. The current favoured hypothesis is that dry, solid particles are more likely to “bounce” when they impact on the vaporiser and not be detected, whereas deli-quesced, liquid particles will stick and not be lost. The ef-fect on the particle collection efficiency is increased to unity when the inlet is chilled and the particles deliquesce, which is consistent with the observations of Allan et al. (2004b). Some water will inevitably be lost in the low pressure of the aerodynamic lens (Buzorius et al., 2002), but Allan et al. (2004b) found that most particles over around 100 nm in diameter retained at least some water until detection. This phenomenon is currently the subject of much investigation and will be discussed in future technical publications. For the purposes of this paper, the collection efficiency has been assumed to be 0.5 while the inlet was at low humidity and 1 at high humidity. This is in line with previous compar-isons where it has been found that sampling without humid-ity or temperature control normally results in an overall heat-ing of the aerosol relative to ambient, dryheat-ing the particles and giving and collection efficiency of 0.5, whereas sampling through a chilled line has given a collection efficiency of 1 (e.g. Allan et al., 2004b; Drewnick et al., 2003).
3 Results
There were many event days witnessed during the QUEST 2 campaign, as classified by the DMPS data. One of the most significant factors noted to affect the behaviour on any one particular day is the history of the air mass prior to arrival
3 2 1 0 dM /d lo gDva (µ g m -3 ) 4 5 6 7 8 9 100 2 3 4 5 6 7 8 91000 2 3 Vacuum Aerodynamic Diameter (nm)
Ammonium Nitrate Sulphate Organics
Fig. 3. Mass distribution from a polluted continental airmass (29
March). 0.5 0.4 0.3 0.2 0.1 0.0 N itr at e E qu iv al en t M as s C on ce nt ra tio n (µ g m -3 ) 90 80 70 60 50 40 30 m/z Nitrate (×0.5) Sulphate Organics
Fig. 4. Mass spectral signature for nitrate, sulphate and organics
during a period of continental influence. The nitrate values have been halved for clarity. This pattern is typical of regional pollution observed using the AMS.
at the site. Typically, a nucleation event is more likely to occur if the air mass originated from arctic regions in the north, which is consistent with previous observations at this site. This would stand to reason, as lower background par-ticle numbers are typically measured under these conditions, which results in a lower available surface area and conceptu-ally a smaller sink for the precursor gases. There are other potential reasons in addition to this, such as the lower tem-peratures causing gases to partition into the particle phase and a reduced mixing height. For a more detailed discussion on this topic, the reader is directed to Nilsson et al. (2001).
6 4 2 0 dM /d lo g( Da ) ( µg m -3 ) 5 6 102 2 3 4 5 6 103 2 3 4 5 6 104 Aerodynamic Diameter (nm) 1.4 1.2 1.0 0.8 0.6 0.4 0.2 0.0 WSOC NH4+ SO4 Na+ NO3 Total Mass Non-event Event
Fig. 5. Ion chromatography, water soluble organic carbon (WSOC)
and gravimetric mass data from Berner impactor samples, averaged over all event and non-event days.
The AMS was able to characterise both the size and com-position of the particles during the various conditions. For a more detailed study of the origins of the air masses expe-rienced during QUEST 2, the reader is directed to Pet¨aj¨a et al. (2005). Typically, when the site was subjected to northern air masses as shown by back trajectories (Draxler and Rolph, 2003), the overall mass concentrations of the background aerosol were low, with the particles existing in a single ac-cumulation mode, mainly composed of sulphate (Fig. 2). During the majority of these cases, the measured amounts of ammonium were not sufficient to fully neutralise the par-ticles, therefore they were mainly acidic in nature. These were the conditions typical of event days. Conversely, when the site was subjected to air from continental Europe (the conditions which favoured non-event days), the concentra-tions were much higher, with the particles containing signif-icant amounts of sulphate, organic matter, ammonium and frequently nitrate (Fig. 3), the latter being a good indication of pH neutrality as nitrate will partition into the gas phase as nitric acid from an acidic particle. The organic mass spec-tral fingerprint observed during periods of continental influ-ence has its primary peak at m/z 44, with other peaks at 43 and 55 (Fig. 4). This signature is indicative of highly oxidised organic species and is considered typical for pro-cessed particulate matter observations with the AMS. The same pattern has been observed in other areas influenced by non-local organic sources (e.g. Alfarra et al., 2004; Topping et al., 2004). Other tracers for anthropogenic emissions were also detected under these conditions using offline techniques,
0.30 0.25 0.20 0.15 0.10 0.05 0.00 dM /d lo gDva (µ g m -3 ) 4 6 8 100 2 4 6 81000 2 Dva (nm) 0.30 0.25 0.20 0.15 0.10 0.05 0.00 dM /d lo gDva (µ g m -3 ) 4 6 8 100 2 4 6 81000 2 Dva (nm) 10 100 M ob ili ty D ia m et er (n m ) 12:00 28/03/2003 29/03/200300:00 12:00 Date and Time (GMT)
2 4 100 2 4 1000 2 Dva (n m ) 4 6 8 100 2 4 6 101 102 103 104 dN/d lo gD m (c m -3 ) 0.3 0.2 0.1 0.0 dM /d lo gD va (µ g m -3 ) 1.2 0.8 0.4 0.0 dV /d lo gD m (× 10 -1 2 ) AMS Organics DMPS Volume/Number (a) (b) (c) (d)
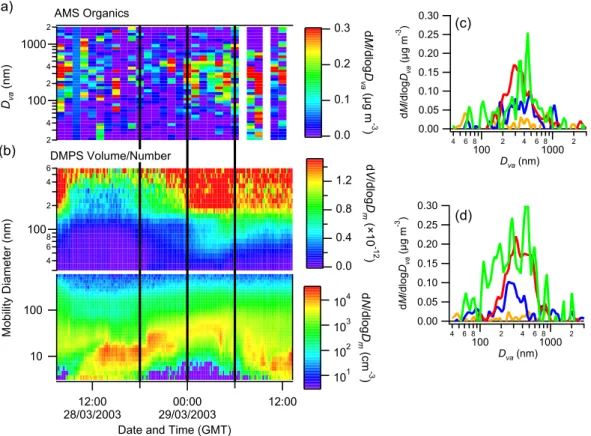
Fig. 6. The 28 March nucleation and growth event. (a) is the AMS-measured organic mass distribution, while (b) is the DMPS-measured
volume and number concentrations. (c) is the AMS distribution from 18:00 to 00:00 GMT, while (d) is from 00:00 to 06:00 the following day. These periods are indicated by the black lines on (a) and (b) for convenience. Note that the AMS data in (a) have been averaged to reduce the amount of noise, for the sake of clarity.
for example polycyclic aromatic hydrocarbons and elemental carbon (Shimmo et al., 2004; R. Janson, Stockholm Univer-sity, personal communication, 2005).
These assessments are in general agreement with the gravimetric mass and ion chromatography analyses of cas-cade impactor samples, collected over multiple event and non-event days, which generally speaking, corresponded to arctic- and continental-influenced days respectively. These too show low mass concentrations, being sulphate-dominated in the accumulation mode during the event days while there is more mass and a greater abundance of ammonium and ni-trate. The accumulation mode peak normally occurred within the 420<Da<1200 nm impactor stage (Fig. 5).
During a typical nucleation day, several hours’ worth of growth were needed before the new particles were observ-able with the AMS. Generally speaking, the particles exhib-ited a clear presence in the mass size distributions in the late afternoon of an event day, forming a distinct Aitken mode, and became bigger during the night. Under these situations, while the new particles were several hours old, the site has a very large forested fetch to the north, so the particles sampled can be considered representative of the environment, provid-ing that there is no change in wind direction durprovid-ing an event
day large enough to result in a different air mass or emissions footprint being sampled.
The grown particles were exclusively organic in nature during the early stages of their evolution, although some-times they would become accompanied by nitrate or sul-phate in the late evening. There was almost always be a de-tectable accumulation mode present during the day, although the amount of mass this represented varied between the dif-ferent days. Sometimes, the Aitken mode, while distinct in the DMPS number distributions, would be dwarfed by the ac-cumulation mode in the AMS mass distributions. Note that the term “Aitken mode” is applied very loosely within this paper; very often, a particle population that has a distinct mode in the 10<Dm<100 nm regime in the DMPS
num-ber distributions (the most common definition for an Aitken mode) can often manifest as a mode with a peak of a larger diameter (Dva<200 nm) in the AMS mass distributions. This
is due to the conversion of electromobility to vacuum aero-dynamic diameters and the mapping of aerosol particle num-ber distributions to volume (DeCarlo et al., 2004). However, during these measurements, the mode was normally distinct from the AMS-measured accumulation mode, whose peak was normally of a Dvaof greater than 300 nm.
1.0 0.8 0.6 0.4 0.2 0.0 dM /d lo gDva (µ g m -3 ) 4 6 100 2 4 610002 Dva (nm) 1.0 0.8 0.6 0.4 0.2 0.0 dM /d lo gD va (µ g m -3 ) 4 6 100 2 4 610002 Dva (nm) 1.0 0.8 0.6 0.4 0.2 0.0 dM /d lo gDva (µ g m -3 ) 4 6 100 2 4 610002 Dva (nm) 10 100 M ob ili ty D ia m et er (n m ) 12:00 01/04/2003 02/04/200300:00 12:00
Date and Time (GMT) 2 4 100 2 4 1000 2 Dva (n m ) 2 4 6 100 2 4 6 AMS Organics DMPS Volume/Number (a) (b) (c) (d) (e)
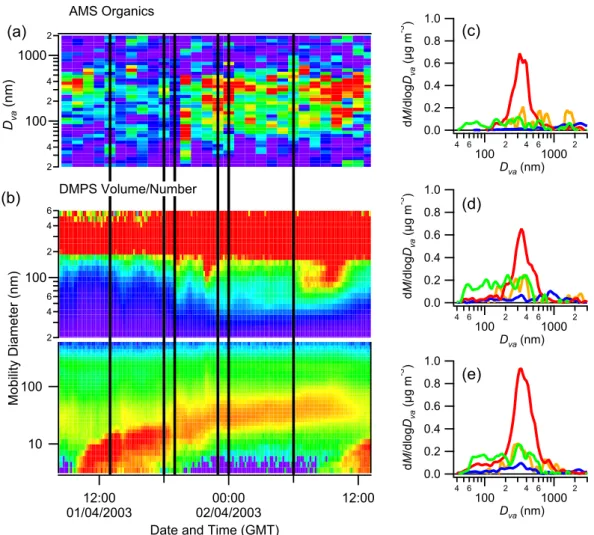
Fig. 7. The 1 April growth event as observed by the AMS (a) and DMPS (b). The colour scales are identical to those used in Fig. 6.
Distributions (c), (d) and (e) are from 13:00–18:00, 19:00–23:00 and 00:00–06:00 GMT respectively. Note that the composition in the Aitken mode is partly inorganic during the later stages.
As an example, the data from two case study event days (28 March and 1 April) are shown (Figs. 6 and 7), com-pared to the DMPS number concentrations (the data from 25 March, another day designated as a QUEST case study, are unfortunately unsuitable for AMS analysis, as there was an air mass change at around 23:00 GMT). In the case of 28 March, back trajectories indicated the air originated from the northwest, whereas on 1 April, it was from a more northerly direction. In both cases, the amount of organic matter in the smaller sizes (<100 nm) increased in the later stages of growth, relative to the earlier stages. While the mass con-centrations are small, it is important to note the difference in how the organic matter is distributed amongst the particles sizes compared to sulphate. While sulphate tends to be exclu-sively contained within the accumulation mode, the organics have a significant presence in the Aitken mode. In the case of 1 April, the smaller particles also acquired some inorganic mass in the form of sulphate in the later stages of growth.
While the growth events were qualitatively detectable, the mass concentrations and therefore signal to noise ratios were much lower than in polluted environments. As a result, the most reliable results are derived after averaging the data from multiple event days, as identified using DMPS data. The organic mass spectral fingerprint produced by averaging all of the data from event days was fairly consistent between events, although it was unlike any mass spectra observed pre-viously in other environments. The relative peak sizes of the fingerprint was invariant of whether the organic distribution was Aitken or accumulation mode dominated (this was found to be true for a range of cases, exhibiting organic mass modes from 80 to 400 nm). The base peak was consistently at m/z 43, a very common organic peak in ambient aerosols (typi-cally C3H+7, C2H3O+or their isomers), which can be
indica-tive of both aliphatic and oxidised features. There were many peaks present from the CnH+2n+1and CnH+2n−1series (e.g. 55,
57, 69, 71) which can indicate the presence of heavily sat-urated and non-oxidised hydrocarbon-like organic species,
300 250 200 150 100 50 0 A bu nd an ce re la tiv e to m /z 5 7 (% ) 110 100 90 80 70 60 50 40 30 20 m/z 1000 500 0 Hyytiälä event Hyytiälä continental Pittsburgh 27 43 53 65 79 91
Fig. 8. Comparison between the organic mass spectral signatures of
a growth event at Hyyti¨al¨a and primary traffic emissions extracted from ambient sampling in Pittsburgh (Zhang et al., 2005). These are also compared with a spectrum from the continentally-influenced period shown in Fig. 4. The spectra are presented relative to m/z 57, the largest aliphatic peak that does not receive significant con-tributions from other known atmospheric organic species.
such as alkanes (McLafferty and Turecek, 1993). This pat-tern in AMS data has been observed many times before, in particular when sampling in urban environments where un-burned lubricating oils dominate the organics in the smaller particles (e.g. Alfarra et al., 2004; Allan et al., 2003b; Cana-garatna et al., 2004). This is highlighted in Fig. 8, where the signature obtained in Hyyti¨al¨a is compared with an urban primary organic spectrum from Pittsburgh, extracted numer-ically using a form principle component analysis (Zhang et al., 2005). However, additional peaks were present with sizes relative to the other peaks that had not been observed before, such as m/z 50, 51, 53, 65, 77, 79 and 91. The prevalence of these peaks over the corresponding aliphatic peaks could potentially be associated with a low hydrogen to carbon ratio in the parent organic molecules relative to alkanes, possibly as a result of unsaturated and/or cyclic features. Also, several of the lower mass peaks, such as m/z 12, 15, 27 and 29, were significantly elevated relative to the other peaks.
The component reported as ‘nitrate’ using the standard AMS analysis techniques is derived from the signals at m/z 30 and 46 (Allan et al., 2003a). While this is an accurate description for most of the data collected using the AMS, in some cases, other species are thought to be responsible for the signals. In polluted environments in particular, m/z 30 signals are associated with the NO+fragment from NH
4NO3
and are usually accompanied with a corresponding signal at m/z 46 (NO+2), with a ratio of around 2.5:1. This be-haviour was seen in the accumulation mode during this study during polluted periods, which is consistent with NH4NO3.
However, there were several instances during this campaign when an m/z 46 signal was not present when a large sig-nal at m/z 30 was. When looking at the size-resolved data, some of the excess m/z 30 signal was seen in the coarse
0.20
0.15
0.10
0.05
0.00
-0.05
dS
/d
lo
gD
va(a
rb
itr
ar
y
un
its
)
2 4 6100
2 4 61000
2 4Vacuum Aerodynamic Diameter (nm)
0.3
0.2
0.1
0.0
m/z 30
m/z 46
m/z 27
m/z 43
m/z 55
m/z 57
m/z 67
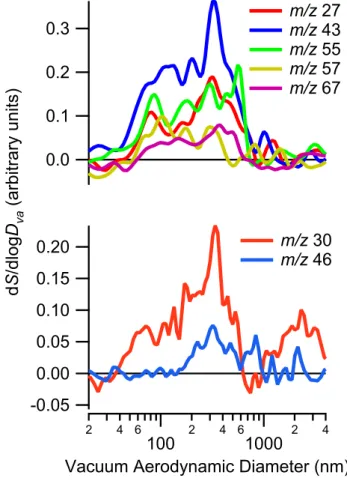
Fig. 9. Graph comparing the different m/z signals from the
pe-riod of 00:00 to 06:00 GMT on 2 April, during the later stages of a growth event. The top graph shows the organic signals, which are smoothed for clarity and show their presence in both the Aitken and accumulation modes. The bottom graph shows the two m/z chan-nels traditionally associated with nitrate (30 and 46) The accumu-lation mode (150–600 nm) signal ratios are typical of ammonium nitrate, while the coarse mode (>1 µm) signal is probably due to sodium nitrate. However, the Aitken mode (<150 nm) is something else, potentially an organic nitrogen species.
mode, indicating that mineral nitrates such as NaNO3were
responsible (Fig. 9). This is consistent with the IC analy-sis of the cascade impactors, which often showed signifi-cant Na+ and NO−3 in the upper stages (1.2<Da<3.5 and
3.5<Da<10 µm), and has also been seen in previous
stud-ies (e.g. Allan et al., 2004b; Topping et al., 2004). How-ever, extra m/z 30 signal was also occasionally observed in the Aitken mode, associated with organic signals seen dur-ing growth events, which is unlikely to be related to mineral nitrates, as sea salt and dust particulate matter is largely con-fined to the coarse mode. It is also unlikely to be NH4NO3,
due to the lack of an m/z 46 signal. In this instance, it may be possible that the signal, instead of originating from inorganic nitrates, may instead arise from the fragmentation of organic nitrates (producing NO+)or amines (producing CH2NH+2
or its isomers). While it is possible to have fragments of this m/z originating from other organic species that do not contain nitrogen (e.g. CH2O+, 13CCH+5), these are
gener-ally small features in the mass spectra relative to peaks such as 27 and 43, based on previous experience in both ambient sampling and laboratory work. Conversely, the m/z 30 sig-nal was often found to be as large as the largest organic peak (43) during these measurements. The presence of excess sub-micron m/z 30 signal has been noted on previous occasions and correlations found with the organic fraction (Allan et al., 2004b; A. Middlebrook, NOAA Aeronomy Laboratory, Un-published field data, 2002), although at this stage, it is very difficult to conclusively identify the species responsible with AMS data alone. This is discussed further below.
4 Discussion
The data from the AMS show that, as expected, the majority of the matter involved in the particle growth is organic in na-ture, within the measurement capabilities of the instrument. Limitations imposed by the low signal to noise ratios meant that only particle populations with mass modes of Dva
val-ues in the high tens of nm were observable, however signals at m/z values associated with organic species were always the first detected during growth events. Note that, however, this in no way implies that organic species are involved in the initial nucleation itself. The nature of the organics is unlike any of those seen previously with the AMS in other envi-ronments. With the capabilities of the instrument, the signa-ture was found to be invariant of whether an event day was Aitken or accumulation mode dominated, implying that the condensing species are the same regardless of the size of the particles they are condensing onto. This is an important re-sult with reference to the rest of the chemical analyses taking place in the project, as it supports the assumption that any chemical species identified using bulk samples collected on filters or impactors are representative of those responsible for the growth of new particles specifically.
In an attempt to explain the unique mass spectral signa-ture for the organic species encountered in this experiment, the chemical species identified through the offline analysis of filter pack and impactor samples collected at the site. In particular, the AMS mass spectra are consistent with the GC-MS analysis of filter samples, which identified much of the organic mass as being alkanes. The most abundant alkanes also on non-polluted cases were in the range of C27-C29, which is taken to be indicative of biogenic sources of emis-sion. Similar results were also obtained by the analyses of Shimmo et al. (2004), who also found significant amounts of alkanes, with the peak at carbon number 27. Note that this carbon number cannot be directly confirmed using the AMS mass spectral data, as laboratory data have shown the loca-tions and relative sizes of the peaks within the mass spectra to be largely invariant as a function of alkane carbon number
100 80 60 40 20 R el at iv e ab un da nc e (% ) 150 140 130 120 110 100 90 80 70 60 50 40 30 20 m/z 27 41 65 53 79 91
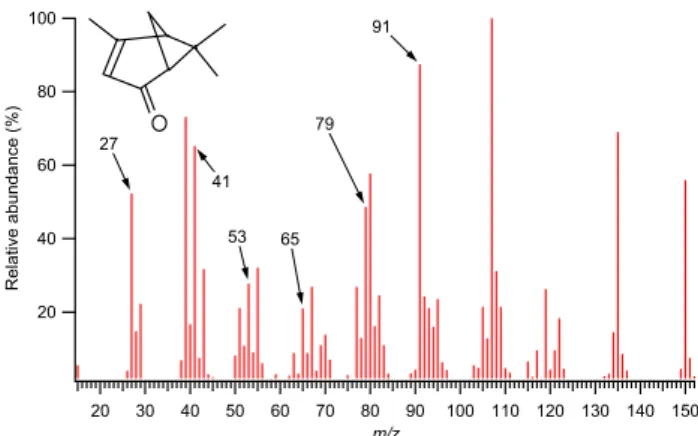
Fig. 10. Molecular structure and mass spectrum of verbenone, taken
from the NIST database (2003). Some the unexpected peaks present in the ambient data are labelled. m/z 39 is not present in the AMS data shown previously, as it is routinely rejected due to interfer-ences from thermally-ionised potassium. The listed higher mass fragments are also not present, but these are probably lost through the thermal effects described in Sect. 2.
above approximately C10 (although the absolute sizes still scale with mass, as expected). The significance of alkanes is not inconsistent with the CNR Bologna cascade impactor analyses from event days, which showed that an amount (ap-proximately 50 to 80%, depending on the sample) of the par-ticulate matter in the lowest stage (Da<140 nm) could not be
accounted for by IC or water soluble organic carbon analy-ses, implying a significant fraction was not water soluble.
The mechanism for how these species come to exist in the particle phase isn’t entirely clear. Conceptually, they could have originally evaporated though the radiative heating of the tree surfaces before condensing onto the particle phase, how-ever Marcolli et al. (2004) predict that the vapour pressures of alkanes of these lengths to be too low for them to be con-sidered semivolatile at standard temperature and pressure. It must also be noted that if the constituents were semivolatile, there is a possibility that some of the ambient particulate mass may have been lost back to the gas phase in instrument sampling lines (which were generally warmer than ambient) or from the substrate during bulk sampling.
The oxidation products of monoterpenes and sesquiter-penes were also identified in the offline analyses, although some of the species could not easily be quantified due to their chemical instability. This is particularly interesting, be-cause the 70 eV EI mass spectrum of verbenone (an oxidised monoterpene, one of the specific species identified using GC-MS) listed in the NIST database (2003) contains many of the peaks unaccounted for in the AMS spectrum such as m/z 27, 29, 51, 53, 65, 77, 79 and 91 (Fig. 10), while the molecu-lar structure is indeed bicyclic and contains a double bond, as speculated above. None of the higher m/z peaks listed in NIST, which include the base peak, appear in the AMS spec-trum (e.g. m/z 107, 135 and 150), but this is probably due to the thermal effects caused by the vaporiser, as mentioned
in the introduction. However, even taking these into account, the relative abundances of carbon, hydrogen and oxygen are reflected in the fragments, so the emphasis seen here of the peaks towards those a few amu smaller than the aliphatic sequence could very well be indicative of a low hydrogen to carbon ratio, possibly due to terpene oxidation products. Note that this interpretation is by no means implying that the composition can be treated as a direct combination of ver-benone and alkanes; the additional peaks noted are probably produced from a wide range of related species and it remains to be seen how representative verbenone (or any other identi-fied species) is of that fraction. Also note that the relative abundances of the two categories cannot be inferred with these data at this stage because the ambient terpene oxida-tion products will be contributing to the alkane peaks to a degree, which is currently uncertain. As part of future work, a systematic laboratory study of verbenone and other related species using an AMS would be highly desirable.
In an attempt to see if there was a direct link between the particulate organics measured by the AMS and the suspected gas phase precursors, the measured organic particulate mat-ter below 200 nm Dvawas compared with the total mixing
ratio of gas phase monoterpene oxidation products, measured by MPIK Heidelberg using Chemical Ionisation Mass Spec-trometry (Sellegri et al., 2005a, 2005b). While a distinct cor-relation was not evident (probably due to spatial and tem-poral mismatches between the formation of the precursors and organic particulate matter), it was found that there was never any measurable organic particles of these sizes when the measured gas mixing ratio was less than 500 ppt, showing that the Aitken mode particulate matter could not be formed in the precursors’ absence.
Using Liquid Chromatography-MS on filter samples, Anttila et al. (2005) made the finding that there was an in-crease in the amounts of short-chain n-alkanoic acids in the particles phase during event days. Monocarboxylic acids tend to give a large signal at m/z 43 in the AMS (Alfarra, 2004; Silva et al., 20061) and as this is the base peak dur-ing growth events, the finddur-ing is not inconsistent with the results presented here. However, as stated previously, there are many potential contributors to this m/z, including alka-nes, so it is difficult to say whether these species represent a significant fraction of the total organic mass or not.
As also stated previously, particulate amines have been ob-served at Hyyti¨al¨a previously in the form of dimethylamine (M¨akel¨a et al., 2001) and as stated before, the amine fam-ily of compounds could be responsible for the excess signal
m/z30 seen in the mass spectrum. According to the NIST database, dimethylamine does have a peak at m/z 30, al-though it is a minor peak. Much larger peaks are expected at m/z 28 and 40–45, but these could have been obscured by other species in the AMS data, including other organics and argon. Crucially, a peak of a similar size to m/z 30 is ex-pected at 46 for dimethylamine, which is not present in the AMS data. Looking at other species, the library spectrum of
methylamine does have m/z 30 as its major peak, but also contains a large peak at m/z 31, which again was not found in the ambient data. What is interesting is that the higher alkylamine mass spectra listed by NIST, from propylamine onwards, consist of a very strong peak at m/z 30 with very little contribution from others, so this family might be a can-didate.
If amines are indeed present, this may have implications for the nucleation and growth mechanisms. It is known that acids condense much faster in the presence of a base (Ko-rhonen et al., 1999), which an amine could act as in the ab-sence of ammonia in the early stages of growth. Conversely, it has also been shown that SOA formation can be promoted by acid-catalysed reactions (Jang and Kamens, 2001; Lim-beck et al., 2003), processes that the presence of a base could suppress, in principle. The initial source of these species, however, is not immediately obvious.
However, the possibility that organic nitrates may be re-sponsible for the rogue m/z 30 signal has yet to be dis-counted, although recent technical developments should aid in investigating and quantifying this in the future. Based on the atomic weights of the respective elements (De Laeter et al., 2003), a mass spectrometer with a m/1m resolution of at least 800 would be required to separate the CH2NH+2
and NO+ peaks (1m is effectively unity in the current quadrupole mass spectrometer). At the time of writing, an AMS design fitted with a high resolution, orthogonal extrac-tion (Chen et al., 1999), reflectron time-of-flight mass spec-trometer (Tofwerk AG model H-TOF, Thun, Switzerland) is undergoing testing at Aerodyne Research and the University of Colorado at Boulder and early results are highly promis-ing. This will also aid in resolving other cluttered peaks, es-pecially m/z 43, as discussed above, in addition to the other benefits of using a time of flight mass spectrometer, such as capturing complete mass spectra of single particles and as a function of particle size (Drewnick et al., 2005).This will be the subject of future publications.
It is still interesting to note that the averaged organic mass spectral signature has, to date, not been clearly observed in any other environments, even in cases where it would be reasonable to expect regional biogenic SOA. It is possi-ble that after the initial formation of the particulate matter, the organic species undergo subsequent transformations in the atmosphere through internal or heterogeneous reactions (Kalberer et al., 2004) or even cloud processing, so this par-ticular signature may indeed never be distinctly seen far from the source. However, it may also be that this particular sig-nal is being routinely dwarfed by the sigsig-nals from anthro-pogenic SOA sources in other environments, as few other studies in pristine, biogenically-influenced sites have been performed to date. Indeed, mass spectra resembling the sig-nature seen here have been extracted from some studies in remote, biogencially-influenced sites when other signatures are removed numerically (Worsnop et al., 2005), although this work is currently ongoing.
During this campaign, the ‘normal’ oxidised organic spec-trum (with m/z 44 as the base peak) dominated when the organic mass concentrations were high and the air originated from continental Europe, which is probably as a result of a large anthropogenic contribution. During some other periods influenced by continental airmasses (such as 10–11 April), a combination of the two spectra was observed, with peaks from both the regional oxidised organic spectrum and the growth event spectrum. Other evidence of biogenic species in the particle phase (e.g. pinic acid and other tracers) was also observed during these periods (Anttila et al., 2005; Cav-alli et al., 2005; R. Janson, Stockholm University, personal communication, 2005), but it is not clear based on the obser-vations alone at what stage these species entered the particle phase; whether they condensed onto the particles within the local forest itself or further upwind. This is something that requires further investigation.
5 Conclusions
An Aerodyne Aerosol Mass Spectrometer (AMS) was de-ployed as part of the suite of instrumentation used in the QUEST 2 intensive field study in Hyyti¨al¨a, Finland during March and April 2003. The object of the experiment was to study and quantify the particle formation events and the con-ditions surrounding them. It was able to study the dynamics of the growth processes and chemical compositions with high size and time resolutions.
The conditions that favoured nucleation events were northerly air masses, where the particle mass concentrations were low, and the particles mainly composed of sulphate with little ammonium. On occasions when the site was influenced by continental air masses, the particulate compositions were more indicative of processed regional emissions.
On the event days, the particles first appeared during the morning and grew throughout the day and into the night. As they accumulated mass, they became detectable with the AMS and a mass spectral signature was obtained. The par-ticles were organic in nature during the majority of their growth stages, although they sometimes acquired some in-organic mass during the later stages. The mass spectral sig-nature was unlike any seen previously in other environments but was consistent between different events and the size of the particles the species were condensing onto during the events themselves. The dominant peaks in the mass spectra seem to be in agreement with the theory that the condensing species consisted primarily of a combination of terpene oxi-dation products and alkanes from plant waxes. There is also evidence to suggest that a form of organic nitrogen, possibly amines, may also be present, although this requires further investigation.
Acknowledgements. This work was supported by the Nordic
Centre of Excellence BACCI (Biosphere-Aerosol-Cloud-Climate Interactions). The AMS was purchased and maintained through UK Natural Environment Research Council (NERC) research grant GR3/12499. During part of this work, J. D. Allan was in receipt of NERC studentship NER/S/A/2000/03653. The filter analyses were supported by The Academy of Finland, project 48867. Library mass spectra were taken from the NIST Chemistry Webbook (http://webbook.nist.gov/chemistry/). Thanks to R. Jan-son (Stockholm University) for the OC, EC and organic acid data and F. Arnold (MPIK Heidelberg) for the CIMS data. Additional thanks to M. Canagaratna (Aerodyne Research Inc.) and J. Jimenez (University of Colorado at Boulder) for the AMS logging software support during the measurements.
Edited by: K. H¨ameri
References
Aalto, P., H¨ameri, K., Becker, E., Weber, R., Salm, J., M¨akel¨a, J. M., Hoell, C., O’Dowd, C. D., Karlsson, H., Hansson, H. C., Vakeva, M., Koponen, I. K., Buzorius, G., and Kulmala, M.: Physical characterization of aerosol particles during nucleation events, Tellus B, 53, 344–358, 2001.
Alfarra, M. R.: Insights Into Atmospheric Organic Aerosols Us-ing An Aerosol Mass Spectrometer (PhD Thesis), Department of Chemical Engineering, UMIST, 2004.
Alfarra, M. R., Coe, H., Allan, J. D., Bower, K. N., Boudries, H., Canagaratna, M. R., Jimenez, J. L., Jayne, J. T., Garforth, A., Li, S., and Worsnop, D. R.: Characterization of urban and rural or-ganic particulate in the Lower Fraser Valley using two Aerodyne Aerosol Mass Spectrometers, Atmos. Environ., 38, 5745–5758, 2004.
Allan, J. D., Jimenez, J. L., Williams, P. I., Alfarra, M. R., Bower, K. N., Jayne, J. T., Coe, H., and Worsnop, D. R.: Quantita-tive sampling using an Aerodyne aerosol mass spectrometer – 1. Techniques of data interpretation and error analysis, J. Geophys. Res.-Atmos., 108, 4090, doi:10.1029/2002JD002358, 2003a. Allan, J. D., Alfarra, M. R., Bower, K. N., Williams, P. I.,
Gal-lagher, M. W., Jimenez, J. L., McDonald, A. G., Nemitz, E., Canagaratna, M. R., Jayne, J. T., Coe, H., and Worsnop, D. R.: Quantitative sampling using an Aerodyne aerosol mass spec-trometer – 2. Measurements of fine particulate chemical compo-sition in two U.K. cities, J. Geophys. Res.-Atmos., 108, 4091, doi:10.1029/2002JD002359, 2003b.
Allan, J. D.: An Aerosol Mass Spectrometer: Instrument Develop-ment, Data Analysis Techniques and Quantitative Atmospheric Particulate Measurements, PhD Thesis, Department of Physics, UMIST, 2004.
Allan, J. D., Coe, H., Bower, K. N., Alfarra, M. R., Delia, A. E., Jimenez, J. L., Middlebrook, A. M., Drewnick, F., Onasch, T. B., Canagaratna, M. R., Jayne, J. T., and Worsnop, D. R.: A generalised method for the extraction of chemically resolved mass spectra from Aerodyne aerosol mass spectrometer data, J. Aerosol. Sci., 35, 909–922, 2004a.
Allan, J. D., Bower, K. N., Coe, H., Boudries, H., Jayne, J. T., Canagaratna, M. R., Millet, D. B., Goldstein, A. H., Quinn, P. K., Weber, R. J., and Worsnop, D. R.: Submicron aerosol com-position at Trinidad Head, California, during ITCT 2K2: Its
rela-tionship with gas phase volatile organic carbon and assessment of instrument performance, J. Geophys. Res.-Atmos., 109, D23S24, doi:10.1029/2003JD004208, 2004b.
Anttila, P., Hy¨otyl¨ainen, T., Heikkil¨a, A., Jussila, M., Finell, J., Kulmala, M., and Riekkola, M. L.: Determination of organic acids in aerosol particles from a coniferous forest by liquid chromatography-mass spectrometry, J. Sep. Sci., 28, 337–346, 2005.
Berner, A., Lurzer, C., Pohl, F., Preining, O., and Wagner, P.: Size distribution of the urban aerosol in Vienna, Sci. Total Environ., 13, 246–261, 1979.
Buzorius, G., Zelenyuk, A., Brechtel, F., and Imre, D.: Simul-taneous determination of individual ambient particle size, hy-groscopicity and composition, Geophys. Res. Lett., 29, 1974, doi:10.1029/2001GL014221, 2002.
Canagaratna, M. R., Jayne, J. T., Ghertner, D. A., Herndon, S., Shi, Q., Jimenez, J. L., Silva, P. J., Williams, P., Lanni, T., Drewnick, F., Demerjian, K. L., Kolb, C. E., and Worsnop, D. R.: Chase studies of particulate emissions from in-use New York City vehi-cles, Aerosol Sci. Technol., 38, 555–573, 2004.
Cavalli, F., Facchini, M. C., Decesari, S., Emblico, L., Mircea, M., Jensen, N. R., and Fuzzi, S.: Size-segregated aerosol chemi-cal composition at a boreal site in southern Finland, during the QUEST project, Atmos. Chem. Phys. Discuss., 5, 8851–8877, 2005,
SRef-ID: 1680-7375/acpd/2005-5-8851.
Chen, Y. H., Gonin, M., Fuhrer, K., Dodonov, A., Su, C. S., and Wollnik, H.: Orthogonal electron impact source for a time-of-flight mass spectrometer with high mass resolving power, Int. J. Mass Spectrom., 185–187, 221–226, 1999.
Cross, E., Onasch, T. B., Lewis, D. K., Jayne, J. T., Canagaratna, M. R., Worsnop, D. R., Dunlea, E., and Jimenez, J. L.: Characteriza-tion of Laboratory and Ambient Particles Using the CombinaCharacteriza-tion of Aerosol Mass Spectromtetry and Light Scattering Techniques, in 23rd Annual AAAR Conference, pp. 256 (8PE2), Hyatt Re-gency Atlanta, Atlanta, GA, 2004.
De Laeter, J. R., Bohlke, J. K., De Bievre, P., Hidaka, H., Peiser, H. S., Rosman, K. J. R., and Taylor, P. D. P.: Atomic weights of the elements: Review 2000 – (IUPAC technical report), Pure Appl. Chem., 75, 683–800, 2003.
DeCarlo, P. F., Slowik, J. G., Worsnop, D. R., Davidovits, P., and Jimenez, J. L.: Particle Morphology and Density Characteriza-tion by Combined Mobility and Aerodynamic Diameter Mea-surements. Part 1: Theory, Aerosol Sci. Technol., 38, 1185– 1205, 2004.
Draxler, R. R. and Rolph, G. D.: HYSPLIT (HYbrid Single-Particle Lagrangian Integrated Trajectory) Model access via NOAA ARL READY Website: http://www.arl.noaa.gov/ready/hysplit4.html, NOAA Air Resources Laboratory, Silver Spring, MD, USA, 2003
Drewnick, F., Schwab, J. J., Hogrefe, O., Peters, S., Husain, L., Dia-mond, D., Weber, R., and Demerjian, K. L.: Intercomparison and evaluation of four semi-continuous PM2.5 sulfate instruments, Atmos. Environ., 37, 3335–3350, 2003.
Drewnick, F., Hings, S. S., DeCarlo, P., Jayne, J. T., Gonin, M., Fuhrer, K., Weimer, S., Jimenez, J. L., Demerjian, K. L., Borrmann, S., and Worsnop, D. R.: A New Time-of-Flight Aerosol Mass Spectrometer (TOF-AMS)-Instrument Description and First Field Deployment, Aerosol Sci. Technol., 39, 637–658,
2005.
Geller, M. D., Kim, S., Misra, C., Sioutas, C., Olson, B. A., and Marple, V. A.: A methodology for measuring size-dependent chemical composition of ultrafine particles, Aerosol Sci. Tech-nol., 36, 748–762, 2002.
Huffman, J. A., Jayne, J. T., Drewnick, F., Aiken, A. C., Onasch, T., Worsnop, D. R., and Jimenez, J. L.: Design, Modeling, Op-timization, and Experimental Tests of a Particle Beam Width Probe for the Aerodyne Aerosol Mass Spectrometer, Aerosol Sci. Technol., 39, 1143–1163, 2005.
Jang, M. S. and Kamens, R. M.: Characterization of secondary aerosol from the photooxidation of toluene in the presence of NOx and 1-propene, Environ. Sci. Technol., 35, 3626–3639,
2001.
Jayne, J. T., Leard, D. C., Zhang, X. F., Davidovits, P., Smith, K. A., Kolb, C. E., and Worsnop, D. R.: Development of an aerosol mass spectrometer for size and composition analysis of submi-cron particles, Aerosol Sci. Technol., 33, 49–70, 2000.
Jimenez, J. L., Jayne, J. T., Shi, Q., Kolb, C. E., Worsnop, D. R., Yourshaw, I., Seinfeld, J. H., Flagan, R. C., Zhang, X., Smith, K. A., Morris, J. W., and Davidovits, P.: Ambient aerosol sampling using the Aerodyne Aerosol Mass Spectrometer, J. Geophys. Res.-Atmos., 108, 8425, doi:10.1029/2001JD001213, 2003. Kalberer, M., Paulsen, D., Sax, M., Steinbacher, M., Dommen, J.,
Prevot, A. S. H., Fisseha, R., Weingartner, E., Frankevich, V., Zenobi, R., and Baltensperger, U.: Identification of polymers as major components of atmospheric organic aerosols, Science, 303, 1659–1662, 2004.
Korhonen, P., Kulmala, M., Laaksonen, A., Viisanen, Y., McGraw, R., and Seinfeld, J. H.: Ternary nucleation of H2SO4, NH3, and
H2O in the atmosphere, J. Geophys. Res.-Atmos., 104, 26 349–
26 353, 1999.
Kulmala, M., Pirjola, U., and M¨akel¨a, J. M.: Stable sulphate clus-ters as a source of new atmospheric particles, Nature, 404, 66–69, 2000.
Kulmala, M., H¨ameri, K., Aalto, P. P., M¨akel¨a, J. M., Pirjola, L., Nilsson, E. D., Buzorius, G., Rannik, ¨U., Dal Maso, M., Seidl, W., Hoffman, T., Janson, R., Hansson, H. C., Viisanen, Y., Laak-sonen, A., and O’Dowd, C. D.: Overview of the international project on biogenic aerosol formation in the boreal forest (BIO-FOR), Tellus B, 53, 324–343, 2001.
Kulmala, M.: How particles nucleate and grow, Science, 302, 1000– 1001, 2003.
Kulmala, M., Laakso, L., Lehtinen, K. E. J., Riipinen, I., Dal Maso, M., Anttila, T., Kerminen, V. M., H¨orrak, U., Vana, M., and Tam-met, H.: Initial steps of aerosol growth, Atmos. Chem. Phys., 4, 2553–2560, 2004a,
SRef-ID: 1680-7324/acp/2004-4-2553.
Kulmala, M., Vehkamaki, H., Petajda, T., Dal Maso, M., Lauri, A., Kerminen, V. M., Birmili, W., and McMurry, P. H.: Formation and growth rates of ultrafine atmospheric particles: a review of observations, J. Aerosol. Sci., 35, 143–176, 2004b.
Limbeck, A., Kulmala, M., and Puxbaum, H.: Secondary organic aerosol formation in the atmosphere via heterogeneous reaction of gaseous isoprene on acidic particles, Geophys. Res. Lett., 30, 1996, doi:10.1029/2003GL017738, 2003.
Liu, P., Ziemann, P. J., Kittelson, D. B., and McMurry, P. H.: Gener-ating Particle Beams of Controlled Dimensions and Divergence: I. Theory of Particle Motion in Aerodynamic Lenses and Nozzle
Expansions, Aerosol Sci. Technol., 22, 293–313, 1995a. Liu, P., Ziemann, P. J., Kittelson, D. B., and McMurry, P. H.:
Gener-ating Particle Beams of Controlled Dimensions and Divergence: II. Experimental Evaluation of Particle Motion in Aerodynamic Lenses and Nozzle Expansions, Aerosol Sci. Technol., 22, 314– 324, 1995b.
M¨akel¨a, J. M., Yli-Koivisto, S., Hiltunen, V., Seidl, W., Swietlicki, E., Teinil¨a, K., Sillanp¨a¨a, M., Koponen, I. K., Paatero, J., Ros-man, K., and H¨ameri, K.: Chemical composition of aerosol dur-ing particle formation events in boreal forest, Tellus B, 53, 380– 393, 2001.
Marcolli, C., Luo, B. P., Peter, T., and Wienhold, F. G.: Inter-nal mixing of the organic aerosol by gas phase diffusion of semivolatile organic compounds, Atmos. Chem. Phys., 4, 2593– 2599, 2004,
SRef-ID: 1680-7324/acp/2004-4-2593.
McLafferty, F. W. and Turecek, F.: Interpretation of mass spectra, 4th edition, University Science Books, Mill Valley, CA, 1993 Nilsson, E. D., Paatero, J., and Boy, M.: Effects of air masses and
synoptic weather on aerosol formation in the continental bound-ary layer, Tellus B, 53, 462–478, 2001.
NIST Mass Spec Data Center (Director S. E. Stein): Mass Spec-tra, in: NIST Chemistry WebBook, NIST Standard Reference Database Number 69, edited by: Linstrom, P. J. and Mallard, W. G., National Institute of Standards and Technology, Gaithers-burg, MD, 2003.
Penner, J. E., Andreae, M., Annegarn, H., Barrie, L., Feichter, J., Hegg, D., Jayaraman, A., Leaitch, R., Murphy, D., Nganga, J., and Pitari, G.: Aerosols, their Direct and Indirect Effects, in: Cli-mate Change 2001: The Scientific Basis. Contribution of Work-ing Group I to the Third Assessment Report of the Intergovern-mental Panel on Climate Change, edited by: Houghton, J. T., Ding, Y., Griggs, D. J., Noguer, M., van der Linden, P. J., Dai, X., Maskell, K. and Johnson, C. A., pp. 289–348, Cambridge University Press, Cambridge, New York, 2001.
Pet¨aj¨a, T., Kerminen, V. M., H¨ameri, K., Vaattovaara, P., Joutsen-saari, J., Junkermann, W., Laaksonen, A., and Kulmala, M.: Ef-fects of SO2 oxidation on ambient aerosol growth in water and ethanol vapours, Atmos. Chem. Phys., 5, 767–779, 2005,
SRef-ID: 1680-7324/acp/2005-5-767.
Rissanen, T., Hy¨otyl¨ainen, T., Kallio, M., Kulmala, M., and Riekkola, M.: Characterization of organic compounds in aerosol particles from coniferous forest by GC-MS, Chemosphere, in press, 2006.
Sellegri, K., Hanke, M., Umann, B., Arnold, F., and Kulmala, M.: Measurements of organic gases during aerosol formation events in the boreal forest atmosphere during QUEST, Atmos. Chem. Phys., 5, 373–384, 2005a,
SRef-ID: 1680-7324/acp/2005-5-373.
Sellegri, K., Umann, B., Hanke, M., and Arnold, F.: Deployment of a ground-based CIMS apparatus for the detection of organic gases in the boreal forest during the QUEST campaign, Atmos. Chem. Phys., 5, 357–372, 2005b,
SRef-ID: 1680-7324/acp/2005-5-357.
Shimmo, M., J¨antti, J., Aalto, P., Hartonen, K., Hy¨otyl¨ainen, T., Kulmala, M., and Riekkola, M. L.: Characterisation of organic compounds in aerosol particles from a Finnish forest by on-line coupled supercritical fluid extraction-liquid chromatography-gas chromatography-mass spectrometry, Anal. Bioanal. Chem., 378, 1982–1990, 2004.
Smith, J. N., Moore, K. F., Eisele, F. L., Voisin, D., Ghimire, A. K., Sakurai, H., and McMurry, P. H.: Chem-ical composition of atmospheric nanoparticles during nucle-ation events in Atlanta, J. Geophys. Res.-Atmos., 110, D22S03, doi:10.1029/2005JD005912, 2005.
Topping, D. O., Coe, H., McFiggans, G. B., Burgess, R., Allan, J. D., Alfarra, M. R., Bower, K. N., Choularton, T. W., Decesari, S., and Facchini, M. C.: Aerosol chemical characteristics from sam-pling conducted on the island of Jeju, Korea during ACE Asia, Atmos. Environ., 38, 2111–2123, 2004.
Twomey, S.: The influence of pollution of the shortwave albedo of clouds, J. Atmos. Sci., 34, 1149–1152, 1977.
Worsnop, D., Northway, M., Jayne, J., Canagaratna, M., Onasch, T., Allan, J., Cubison, M., Coe, H., Jimenez, J., DeCarlo, P., Huff-man, A., Zhang, Q., Cross, E., and Davidovits, P.: Overview Of Aerosol Mass Spectrometry At Chebogue Point During ICARTT 2004, in: 24th Annual AAAR Conference, pp. 131 (5A2), Hilton Austin, Austin, TX, USA, 2005.
Zhang, Q., Stanier, C. O., Canagaratna, M. R., Jayne, J. T., Worsnop, D. R., Pandis, S. N., and Jimenez, J. L.: Insights into the chemistry of new particle formation and growth events in Pittsburgh based on aerosol mass spectrometry, Environ. Sci. Technol., 38, 4797–4809, 2004a.
Zhang, Q., Alfarra, M. R., Worsnop, D. R., Allan, J. D., Coe, H., Canagaratna, M. R., and Jimenez, J. L.: Deconvolution and Quantification of Hydrocarbon-like and Oxygenated Organic Aerosols Based on Aerosol Mass Spectrometry, Environ. Sci. Technol., 39, 4938–4952, 2005.
Zhang, X. F., Smith, K. A., Worsnop, D. R., Jimenez, J., Jayne, J. T., and Kolb, C. E.: A numerical characterization of particle beam collimation by an aerodynamic lens-nozzle system: Part I. An individual lens or nozzle, Aerosol Sci. Technol., 36, 617–631, 2002.
Zhang, X. F., Smith, K. A., Worsnop, D. R., Jimenez, J. L., Jayne, J. T., Kolb, C. E., Morris, J., and Davidovits, P.: Numerical characterization of particle beam collimation: Part II – Inte-grated aerodynamic-lens-nozzle system, Aerosol Sci. Technol., 38, 619–638, 2004b.