HAL Id: hal-00295926
https://hal.archives-ouvertes.fr/hal-00295926
Submitted on 29 May 2006
HAL is a multi-disciplinary open access
archive for the deposit and dissemination of
sci-entific research documents, whether they are
pub-lished or not. The documents may come from
teaching and research institutions in France or
abroad, or from public or private research centers.
L’archive ouverte pluridisciplinaire HAL, est
destinée au dépôt et à la diffusion de documents
scientifiques de niveau recherche, publiés ou non,
émanant des établissements d’enseignement et de
recherche français ou étrangers, des laboratoires
publics ou privés.
Episode of unusual high solar ultraviolet radiation over
central Europe due to dynamical reduced total ozone in
May 2005
C. Stick, K. Krüger, N. H. Schade, H. Sandmann, A. Macke
To cite this version:
C. Stick, K. Krüger, N. H. Schade, H. Sandmann, A. Macke. Episode of unusual high solar ultraviolet
radiation over central Europe due to dynamical reduced total ozone in May 2005. Atmospheric
Chemistry and Physics, European Geosciences Union, 2006, 6 (7), pp.1771-1776. �hal-00295926�
www.atmos-chem-phys.net/6/1771/2006/ © Author(s) 2006. This work is licensed under a Creative Commons License.
Chemistry
and Physics
Episode of unusual high solar ultraviolet radiation over central
Europe due to dynamical reduced total ozone in May 2005
C. Stick1, K. Kr ¨uger2,3, N. H. Schade1, H. Sandmann1, and A. Macke3 1Institut f¨ur Medizinische Klimatologie der Universit¨at Kiel, 24118 Kiel, Germany 2Alfred Wegener Institut f¨ur Polar- und Meeresforschung, 14401 Potsdam, Germany 3Leibniz-Institut f¨ur Meereswissenschaften an der Universit¨at Kiel, 24105 Kiel, Germany
Received: 9 August 2005 – Published in Atmos. Chem. Phys. Discuss.: 24 October 2005 Revised: 1 February 2006 – Accepted: 4 April 2006 – Published: 29 May 2006
Abstract. In late May 2005 unusual high levels of so-lar ultraviolet radiation were observed over central Europe. In Northern Germany the measured irradiance of erythe-mally effective radiation exceeded the climatological mean by more than about 20%. An extreme low ozone event for the season coincided with high solar elevation angles and high pressure induced clear sky conditions leading to the high-est value of erythemal UV-radiation ever observed over this location in May since 1994. This hereafter called “ozone mini-hole” was caused by an elevation of tropopause height accompanied with a poleward advection of ozone-poor air from the tropics. The resultant increase in UV-radiation is of particular significance for human health. Dynamically induced low ozone episodes that happen in late spring can considerably enhance the solar UV-radiation in mid latitudes and therefore contribute to the UV-burden of people living in these regions.
1 Introduction
In the tropics the total ozone column is mainly determined by a balance between photochemical formation and destruc-tion. In higher latitudes, however, total ozone is controlled by both transport and chemistry. Although most of the ozone is formed in the tropical stratosphere, the total ozone col-umn nevertheless increases at higher latitudes during win-ter and spring due to the mean meridional circulation in the stratosphere with the upward motion of air in the tropics and poleward transport and sinking air masses over the winter poles. Generally, the tropics have natural lower total ozone than higher latitudes (D¨utsch, 1978). In mid-latitudes, maxi-mum total ozone is reached during spring and the minimaxi-mum during late summer.
Correspondence to: C. Stick
(c.stick@med-klimatologie.uni-kiel.de)
If air from the tropical lower stratosphere is directly ad-vected to higher latitudes, it can be mixed and develop so called dynamically induced ozone mini-holes (OMs), as it was first observed and defined by Newman et al. (1988) for the southern hemisphere. The influence of the tropopause height, associated with tropospheric low- and high-pressure systems, on the ozone column has been known for a long time (Dobson, 1929). During a high tropopause in an anti-cyclonic region a larger part of the total ozone column arises from ozone-poor tropopheric air which leads to lower total ozone in this region. Both dynamical processes are relevant for the formation of OMs.
OMs mainly occur from winter to early spring in both hemispheres, especially, when an ozone reduction caused by a displacement of the polar vortex is existent. They persist for a few days, before ozone levels again normalize. Many studies have analysed these winter and spring OMs in detail (e.g. Newmann et al., 1988; McKenna et al., 1989; Rood et al., 1992; Petzoldt et al., 1994; Orsolini et al., 1995; James et al., 2000). James (1998) and Stenke and Grewe (2003) reported of increasing occurrence of OM-events for the winter months based on satellite observations and on a coupled chemistry climate model, whereas in late spring or summer such events take place only very rarely. Orsolini et al. (2003) observed two extreme low ozone events over Northern Europe during summer. A pool of low ozone in the Arctic stratosphere, caused by chemical ozone destruction (gas-phase chemistry) and transport processes, contributed to these summer events.
In the present paper, we report on an unusual tropo-spheric/stratospheric situation where a late spring OM oc-curred at a time when tropospheric conditions favoured large surface irradiation which in turn led to considerably in-creased risks for human health. Section 2 briefly describes the relevant ground- and satellite based measurements. A detailed description of the synoptical situation both in the troposphere and in the stratosphere are presented in Sect. 3, followed by a conclusion in Sect. 4.
1772 C. Stick et al.: Unusual high solar ultraviolet radiation in central Europe 0 50 100 150 200 4 6 8 10 12 14 16 18 20 27.05.2005 27.05.2004 27.052003 27.05.2002 0 1 2 3 4 5 6 7 8 time [CET] E er [mW/m 2] total Ozone (TOMS-Data) 2002: 350 DU 2003: 332 DU 2004: 386 DU 2005: 287 DU UVI
Fig. 1. Measured irradiance of erythemally effective radiation (m W/m2) in Westerland (54.93◦N, 8.31◦E) on 27 May 2002– 2005. The spectral irradiance was measured every six minutes by a calibrated double monochromator. The measured solar spectra were weighted by the standard CIE action spectrum for the ery-thema and integrated from 290 nm to 400 nm wavelength. The right y-axis gives the global UV-index (UVI).
2 Measurements
Solar ultraviolet radiation was measured in Westerland, a seaside resort on the North Sea island of Sylt, Germany (ge-ographical position 54.93◦N, 8.31◦E). Measurements were
carried out using a double-monochromator spectroradiome-ter system (DTM 300, Bentham Instruments Ltd., Reading, England). The input optics was a cosine adapted Teflon dif-fuser (Schreder-CMS, Kirchbichl, Austria) that was mounted on the roof of the laboratory building. The Spectrometer was operated indoor without a particular temperature sta-bilisation. The instrument was calibrated using a calibra-tion standard (1000 W quartz halogen lamp) derived from national metrology institute standard (PTB, Braunschweig, Germany). The nominal bandwidth (50% points of the slit function) of the system was 1 nm. Spectra were recorded in steps of 0.5 nm in the range from 290 to 320 nm and in steps of 5 nm in the range 320–450 nm respectively. The measured spectra were convoluted by the CIE standard action spec-trum for the erythema in human skin (McKinley and Diffey, 1987). The erythemally effective irradiance Eer was calcu-lated by integrating the weighted spectra from 290 to 400 nm wavelength. The global UV-index (UVI) was calculated as an indicator of the potential of skin damage (ICNIRP 1995; WHO 2002). The measurement-routine was derived from the federal office for radiation protection (BfS, Salzgitter Ger-many) (Steinmetz, 1997). Spectra were taken every six min-utes from sunrise to sunset. The operational measurement series started in Westerland in 1994.
Figure 1 shows the diurnal courses of the erythemal irradi-ance during 27 May of the years 2002 to 2005 respectively.
280 300 320 340 360 380 400 20-5 25-5 30-5 4-6 total ozone date [DU] 8-6
Fig. 2. Time-series of total ozone over 54.5◦N and 8.125◦E (clos-est grid point to W(clos-esterland, black line) as measured by TOMS, 20 May–8 June 2005. The red line shows the mean level of total ozone from 1979 to 2004, the dashed lines indicate the range of the stan-dard deviation.
Since the sky during these days was nearly cloud free, the di-urnal cycles are directly comparable. In May the usual level of the erythemal irradiance at noontime is about 150 mW/m2 in Westerland as shown by the data measured on 27 May in the years 2002 and 2004. This corresponds to an UV-index of 6. In 2005 the erythemal irradiance increased up to max-imum 188 mW/m2or an UVI of 8. During 2003 the irradi-ance also was unusual high according to relatively low total ozone, which was the second lowest value measured on a 27 May between 1979 and 2004, based on the TOMS climatol-ogy.
The increases in the erythemally effective UV radiation corresponded to decreases of the ozone column as measure-ments of the TOMS satellite show: The ozone decrease over the closest grid point to Westerland (54.5◦N, 8.125◦E) com-menced on 24 May . During the three following days the ozone levels were less than 300 Dobson Units (DU). The minimum value of 287 DU was reached on 27 May (Fig. 2). After 30 May the total ozone values again returned to lev-els that can be considered normal with respect to seasonal and geographical position. The levels of total ozone as mea-sured by TOMS on 27 May during the years 1979 to 2004 ranged from minimum 330 DU to maximum 420 DU, mean 365 DU, median value 360 DU. Thus, the decrease in to-tal ozone during the episode described here was more than 20% below the seasonal level. The deviation from the cli-matological mean, i.e. from the arithmetic mean or the me-dian value respectively, is 3.1 times the standard deviation (SD=25.4 DU) or 3.5 times the mean deviation from the me-dian (MD=20.6 DU). Accordingly, the low total ozone is un-likely to be due to the variability of the data sample, but has to be explained by a certain synoptic situation.
Fig. 3. Pressure (hPa) and horizontal winds (m/s) at the tropopause-height of the northern hemisphere (27 May 2005 12:00 UTC) shown at 2 PVU iso-surface using ECMWF data (T511/L60) from 20◦–90◦N. The extra tropical tropopause is dynamically defined as the area with constant potential vorticity of 2 PVU (1 PVU=10−6m2Ks−1kg−1). In the tropics the low pressure in-dicates stratospheric air. The blue region over central Europe marks the low ozone event. The red cross marks the UV station in Wester-land.
3 Synoptic situation
At the end of May, the Arctic stratosphere was dominated by an anticyclone with easterly winds and relatively high temperatures over the polar cap at 30 and 50 hPa (Fig. 4). The winter polar vortex was already broken down with an early transition to summer circulation in the stratosphere at the beginning of April. Therefore no conditions for halogen-induced ozone depletion existed anymore. Figure 5 reveals ozone-rich air over the polar cap with a positive ozone gradient from the tropics to the pole in the lower stratosphere (on the 56 and 150 hPa level) on 27 May. The ozone distributions shown in Fig. 5 are derived from the chemistry and transport model ROSE/DLR assimilating EN-VISAT/SCIAMACHY measurements.
Inspecting ozone maps in the mid stratosphere (not shown here) reveals that the latitudinal ozone gradient changes sign between 30 and 10 hPa. There is no indication that transport of ozone-poor air neither from the tropical nor from polar latitudes contributed to the unusual low total ozone columns observed over central Europe. The reported ozone decrease rather has to be explained by dynamical processes in the up-per troposphere lower stratosphere (UTLS) region.
Fig. 4. Geopotential height (dam) on 30, 50 and 150 hPa pres-sure levels for 27 May 2005, 12:00 UTC; ECMWF data from 20◦– 90◦N. The contour interval is 8 dam.
In the present episode a tongue of upper tropospheric air with low ozone concentrations was advected from the tropics towards higher latitudes due to strong wind shear at the west-ern flank of the stationary high over central Europe (Fig. 3). This intrusion of ozone-poor air, which is apparent on the
1774 C. Stick et al.: Unusual high solar ultraviolet radiation in central Europe
Fig. 5. Ozone volume mixing ratios (ppmv) at 56 and 150 hPa from the ROSE/DLR chemistry transport model assimilating En-visat/SCIAMACHY ozone data for 27 May 2005, 12:00 UTC (http: //wdc.dlr.de/index.html).
150 hPa ozone chart of 27 May (Fig. 5), was reaching from the Canary Islands to the Baltic Sea replacing lowermost stratospheric air in the extratropics in the following days (not shown here). Comparable results were also obtained from Aura MLS satellite observations (personal communication Gloria Manney).
The tropospheric weather situation confirms a possible de-velopment of a very low ozone event. Most of central and southern Europe was lying under a nearly stationary high-pressure area. A wide area increase of high-pressure was observed already on 23 May, which led to an enlargement of the high and to advection of warm air from the Iberian Peninsula to central Europe, up to high tropospheric regions. A rapid increase of temperature, caused by this advection in front of a low lying to the west of Great Britain and increasing
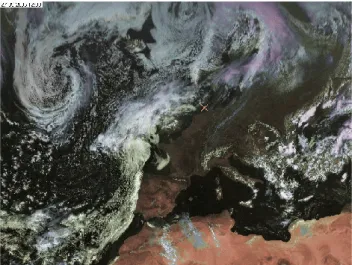
Fig. 6. Satellite picture of Europe on 27 May 2005, 12:00 UTC (copyright EUMETSAT 2005).
irradiance was expected for 25 May. Finally a nearly cloud-free region and the high-pressure area fit on 27 May over central Europe (Fig. 6) and led to unusual high temperatures in some cases the highest temperatures measured since 1890 (Berlin Weather map, 29 May) for that time of the year. Koch et al. (2005) found that OMs often develop during the exis-tence of blocking highs, which was investigated in more de-tail over a southern European station.
The ECMWF analysis on the 2 PVU iso-surface (Fig. 3) supports the assumption that the OM was mainly induced by processes taking place in the UTLS region. The 2 PVU iso-surface, which is often used as an indicator for the tropopause, gives evidence that the tropopause has risen up to 160 to 200 hPa over central Europe. The position and shape of this elevated tropopause ridge (see also Fig. 4) coincides well with the reduced ozone concentrations in the UTLS re-gion (Fig. 5) and with the cloud-free area caused by the high pressure system located over central Europe (see Fig. 6).
According to this synoptic situation, the TOMS-instrument shows a decrease of total ozone from 26–28 May over central Europe with a pronounced minimum over West-erland on 27 May (Fig. 7). This minimum coincides perfectly with the position of the maximum of the tropopause height (see Fig. 3).
We conclude that the elevation of the tropopause height above central Europe led to a vertical uplift of isentropes and expansion of air parcels which additionally to the horizontal isentropic transport of tropical ozone caused the local ozone minimum, detected in Westerland. According to the study of Wohltmann et al. (2005) both dynamical processes play a significant role on the total ozone variability observed over Europe from 1970–2002.
x
Fig. 7. Total ozone over the northern hemisphere (27 May 2005), EP/TOMS Version 8 in Dobson Units (http://toms.gsfc.nasa.gov/ ozone/ozone.html, North pole image). The EP/TOMS measures to-tal ozone over the northern- and southern hemisphere on a single day on board of the NASA-satellite “Earthprobe”. TOMS measures approx. 290 DU over central Europe, while north of Scandinavia an increase of approx 150 DU is detected.
4 Conclusions
The occurrence and the impact of OMs during winter and early spring are widely discussed in the literature. Events like the described episode in late May, however, may have a higher impact on the human health, even if they do not have such low ozone columns as OMs in winter. Since they occur during late spring or summer they could contribute much to the UV-burden of people living in the mid latitudes. In con-trast to the studies cited above investigating especially win-ter and spring OMs the unusual low ozone event in our study was not caused by transport of ozone poor air from polar re-gions in the lower or mid stratosphere. The synoptic maps indicate that the extremely low ozone event over central Eu-rope in late spring mainly arose from a dynamical induced ozone reduction in the UTLS region. In that respect, the ori-gin of the OM described in our study is different to the oriori-gin of other OMs that regularly occur during winter/early spring conditions and such that happen during summer season.
The meteorological situation observed can be considered of particular medical relevance. The increase in solar UV-radiation coincided with specific weather conditions: the low ozone episode is accompanied by a high-pressure induced clear sky and warm fair conditions according to the synoptic situation. Many people will have been out of doors and, at this stage of the summer, their skin will not be adapted to the sun. Moreover, the high levels of ultraviolet radiation are not expected during this time of the year. According to the expo-sure categories of the WHO/WMO/ICNIRP the increase of
the UVI from 6 to 8 for this time of the year means a change from exposure category “high” to “very high”. The latter is quite unusual in Northern Germany. In this respect, late spring low ozone events as described here could contribute to the UV-burden of the population and increase the risk of skin damage. They may finally enhance adverse health effects from ozone depletion as described by other studies (Slaper et al., 1996; de Gruijl et al., 2003).
Acknowledgements. We would like to particular thank Y. Orsolini
and one anonymous reviewer for their helpful comments on the manuscript. The stratospheric data were provided by the ECMWF, Reading and the TOMS data set by the Ozone Processing Team at NASA’s Goddard Space Flight Center. ICSU World Data Center for Remote Sensing of the Atmosphere kindly provided
the ROSE/DLR data assimilating ENVISAT/SCIAMACHY
measurements which were made available as ozone maps by J. Meyer-Arnek (DLR). For the helpful discussion on the ozone column we would like to thank G. Manney and J. Meyer-Arnek. K. Kr¨uger was supported by the European Union’s 6th framework program within the O3-SCOUT (GOCE-CT-2004-505390) project. Edited by: P. Haynes
References
Dobson, G. M. B., Harrison, D. N., and Lawrence, L.: Measure-ments of the amount of ozone in the Earths atmosphere and its reaction to other geophysical conditions, Proc. R. Soc. London, Ser. A, 110, 660–693, 1929.
D¨utsch, H. U.: Vertical ozone distribution on a global scale, Pure Appl. Geophys., 116, 511–529, 1978.
de Gruijl, F. R., Longstreth, J., Norval, M., Cullen, A. P., Slaper, H., Kripke, M. L., Takizawa, Y., and van der Leun, J. C.: Health effects from stratospheric ozone depletion and interactions with climate change, Photochem.Photobiol. Sci., 2, 16–28, 2003. ICNIRP: Global solar UV index. A joint recommendation of the
Word Health Organisation, the World Meteorological Organisa-tion, the United Nations Environment Programme, and the In-ternational Commission on Non-Ionizing Radiation Protection, Oberschleißheim, 1995.
James, P. M.: A climatology of ozone mini-holes over the northern hemisphere, Int. J. Climatol., 18(12), 1287–1303, 1998. James, P. M., Peters, D., and Waugh, D. W.: Very low ozone
episodes due to polar vortex displacement. Tellus Series B-Chemical and Physical Meteorology, 52(4), 1123–1137, 2000. Koch, G., Wernli, H., Schwierz, C., Staehelin, T., and Peter, T.: A
composite study on the structure and formation of ozone mini-holes and minihighs over central Europe. Geophys. Res. Lett., 32, L12819, doi:10.1029/2004GL022062, 2005.
McKenna, D. S., Jones, R. L., Austin, J., Browell, E. V., Mc-Cormick, M. P., Krueger, A. J., and Tuck, A. F.: Diagnostic Stud-ies of the Antarctic Vortex During the 1987 Airborne Antarc-tic Ozone Experiment: Ozone Miniholes, J. Geophys. Res., 94, 11 641–11 668, 1989.
McKinley, A. F. and Diffey B. L.: A reference action spectrum for ultraviolet induced erythema in human skin, CIE J, 6, 17–22, 1987.
1776 C. Stick et al.: Unusual high solar ultraviolet radiation in central Europe
Newman, P. A., Lait, L. R., and Schoeberl, M. R.: The morphology and meteorology of southern hemisphere spring total ozone mini-holes, Geophys. Res. Lett., 15, 923–926, 1988.
Orsolini, Y. J., Cariolle, D., and Deque, M.: Ridge formation in the lower stratosphere and its influence on ozone transport: a GCM study during late January 1992, J. Geophys. Res., 100, 11 113– 11 135, 1995.
Orsolini, Y. J., Eskes, H., Hansen, G., Hoppe, U.-P., Kylling, A., Kyr¨o, E., Notholt, J., van der A. R., and von der Gathen, P.: Summertime low-ozone episodes at northern high latitudes, Q. J. R., Meteorol. Soc., 129, 3256–3275, 2003.
Petzoldt, K., Naujokat, B., and Neugebohren, K.: Correlation be-tween stratospheric temperature, total ozone, and tropospheric weather systems, Geophys. Res. Lett., 21, 1203–1206, 1994. Rood, R. B., Nielsen, J. E., Stolarski, R. S., Douglass, A. R., Kaye,
J. A., and Allen, D. J.: Episodic total ozone minima and asso-ciated effects on heterogenous chemistry and lower stratosphere transport, J. Geophys. Res., 97, 7979–7996, 1992.
Slaper, H. G., Velders, G. J. M., Daniel, J. S., de Gruijl, F. R., and van der Leun, J. C.: Estimates of ozone depletion and skin can-cer incidence to examine the Vienna convention achievements, Nature, 384, 256–258, 1996.
Steinmetz, M.: Continous solar UV monitoring in Germany, Pho-tochem. Photobiol. Biology, 41, 181–187, 1997.
Stenke, A. and Grewe, V.: Impact of ozone mini-holes on the het-erogeneous destruction of stratospheric ozone, Chemosphere, 50, 177–190, 2003.
WHO: Global solar UV index: a practical guide. A joint recommen-dation of the World Health Organisation, World Meteorological Organisation, United Nations Environment Programme, and the International Commission on Non-Ionizing Radiation Protection, WHO, Geneva, 2002.
Wohltmann, I., Rex, M., Brunner, D., and Mader, J.: Inte-grated equivalent latitude as a proxy for dynamical changes in ozone column, Geophys. Res. Lett., 32(9), L09811, doi:10.1029/2005GL022497, 2005.