HAL Id: hal-01427340
https://hal.archives-ouvertes.fr/hal-01427340
Submitted on 5 Jan 2017
HAL is a multi-disciplinary open access
archive for the deposit and dissemination of
sci-entific research documents, whether they are
pub-lished or not. The documents may come from
teaching and research institutions in France or
abroad, or from public or private research centers.
L’archive ouverte pluridisciplinaire HAL, est
destinée au dépôt et à la diffusion de documents
scientifiques de niveau recherche, publiés ou non,
émanant des établissements d’enseignement et de
recherche français ou étrangers, des laboratoires
publics ou privés.
Effects of Test Duration in Subjective Listening Tests
Diemo Schwarz, Guillaume Lemaître, Mitsuko Aramaki, Richard
Kronland-Martinet
To cite this version:
Diemo Schwarz, Guillaume Lemaître, Mitsuko Aramaki, Richard Kronland-Martinet. Effects of Test
Duration in Subjective Listening Tests. International Computer Music Conference (ICMC), Hans
Timmermans, Sep 2016, Utrecht, Netherlands. pp.515-519. �hal-01427340�
Effects of Test Duration in Subjective Listening Tests
Diemo Schwarz, Guillaume Lemaitre IRCAM–CNRS–UPMC name.surname@ircam
Mitsuko Aramaki, Richard Kronland-Martinet LMA–CNRS
surname@lma.cnrs-mrs.fr
ABSTRACT
In perceptual listening tests, subjects have to listen to short sound examples and rate their sound quality. As these tests can be quite long, a serious and practically relevant ques-tion is if participants change their rating behaviour over time, because the prolonged concentration while listening and rating leads to fatigue. This paper presents first results of and hypotheses about changes in the rating behaviour of subjects taking a long-lasting subjective listening test eval-uating different algorithms for environmental sound tex-ture synthesis. We found that ratings present small but sta-tistically significant upwards tendency towards the end of the test. We put forward the hypotheses that this effect is due to the accustomation of the subjects to the artefacts present in the test stimuli. We also present the analysis of a second test evaluating wind noises in interor car record-ings and find similar effects.
1. INTRODUCTION
In perceptual listening tests, subjects have to listen to short sound examples and rate their sound quality. The sound ex-amples would typically be several variants of a speech or sound synthesis algorithm under test, in order to find the best methods or parameters. As these tests can be quite long (usually more than 15 minutes, up to two hours), a serious and practically relevant question is if partici-pants change their rating behaviour over time, possibly be-cause the prolonged concentration while listening and rat-ing leads to fatigue or other long term effects.
This is a real and original research question relevant to countless researcher’s daily work, but it is rarely treated specifically in the literature.
We will present analyses of two data sets: A first data set (section 3) with sound quality ratings of five different environmental sound texture synthesis algorithms [1, 2], and a second data set (section 4) from a listening test of unpleasantness of wind noise in car interiors [3].
From an analysis of data set 1, we found that ratings present small but statistically significant upwards tendency in sound quality rating towards the end of the test. We put forward the hypothesis that this effect is due to the accus-tomation of the subjects to the artefacts present in the test stimuli.
Copyright: c 2016 Diemo Schwarz et al. This is an open-access article
distributed under the terms of theCreative Commons Attribution License
3.0 Unported, which permits unrestricted use, distribution, and reproduc-tion in any medium, provided the original author and source are credited.
Data set 2 presents a downwards tendency in the pleasant-ness rating for certain types of stimuli. Here the hypothesis is that listening fatigue could be the main factor.
Of course a good test design would randomise the order of presentation of sounds in order to cancel out these ef-fects for calculation of the mean score for the different stimuli, but they do augment the standard deviation of the results.
2. PREVIOUS AND RELATED WORK Despite the practical relevance of this question, existing literature on this subject is rather rare. Neither Bech and Zacharov [4], nor Pulkki and Karjalainen [5] treat this question specifically. This observation was corroborated by the reaction of three researchers experienced in design-ing and carrydesign-ing out listendesign-ing test asked by the authors, who all showed surprise at the first hints of an effect. In ex-perimental psychology, Ackerman and Kanfer [7] studied cognitive fatigue in SAT-type tests of 3 to 5 hours, which is much too far from our use case.
We have to look in fields such as usability testing to find relevant research: Schatz et al. [6] study the duration ef-fect of a 90 min test (including a 10 min break) of video transmission quality and web site usability on user ratings. They find little difference of the mean scores of control questions repeated at the beginning and end of the test, al-though physiological measurements of fatigue (eye blink rate, heart rate mean and variation) and subjective task load index (TLX) questionnaires show clear signs of strain. However, they admit that “pure audio or speech tests might even cause stronger boredom and fatigue (due to higher monotony) than mixed task profiles”. Here we can argue further that the mental strain in our experiment 1 is higher, since the decision rate, i.e. the number of ratings to de-cide on is very high—after every stimulus of 7 s, two rat-ings were required—and more concentrated listening was asked for, whereas in the above studies, rather few judg-ments from the subjects were required.
We also have to note that above study took place in a lab, and subjects were payed to participate. Our experiment 1 is on-line and unpayed, and the subjects’ motivation is thus much lower.
3. EXPERIMENT 1
Data set 1 was collected in a subjective listening test [1, 2], comparing 5 different algorithms for extending an environ-mental sound texture recording for an arbitrary amount of time, using synthesis based on granular and spectral sound representations, with and without the use of audio descrip-tors. These algorithms were developed in the course of the
PHYSIScollaborative research project1. Their details are
not subject of this article and can be found in [2, 8–12]. See also the state-of-the-art overview on sound texture synthe-sis [13] for further discussion and a general introduction of sound textures.
The 5 algorithms under test are evaluated in an ongoing listening test accessible online.2 The experiment setup is
briefly described in the following, full details can be found in [1, 2].
3.1 Sound Base
The sounds to be tested stem from 27 original environ-mental sound texture examples that cover scenes relevant for games and audio–visual applications, such as nature sounds, human crowds, traffic, city background noises, etc. Each original sound of 7 s length is resynthesised by 5 dif-ferent sound textures algorithms.
3.2 Experimental Procedure
The subjects take the experiment via a web-based form where first the instructions, and then the 27 sounds are presented in random order. For each sound example, the original, and the 6 test stimuli of 7 s length are presented. The stimuli contain in randomised order 5 syntheses, and the original as hidden reference. For each stimulus, the subject is asked to rate the aspects of sound quality and naturalness on a scale of 0–100.
3.3 Experiment 1 Results and Evaluation
Project members and members of the wider research teams were invited by email to take the listening test. There were 17 responders, 16 listening on headphones or earplugs, 1 on studio loudspeakers. None reporting hearing impair-ments, 5 reported not being familiar with listening tests.
We removed one responder from the statistics (reporting not being familiar with listening tests) who left 80% of the quality and all similarity ratings at the default setting of the web form of 50, and rated the quality of the rest of the stimuli as less than 50.
Figure 1 shows the mean quality and similarity ratings, over all responses and sounds, for the different algorithms. Table 1 shows that the inter-rater reliability, measured by Cronbach’s α, is very high (i.e. subjects agree to a high degree in their ratings), with SDIS being slightly lower.
Quality Similarity Overall 0.9874 0.9915 Orig 0.9672 0.9789 Descr 0.9431 0.9686 Montage 0.9560 0.9695 AudioTexture 0.9410 0.9628 Random 0.9337 0.9615 SDIS 0.8944 0.8979
Table 1. Inter-rater reliability of experiment 1 (standardized Cronbach’s α) for all ratings, and per stimulus type.
1https://sites.google.com/site/physisproject
2http://ismm.ircam.fr/sound-texture-synthesis-evaluation
Orig Descr Mont AT Rand SDIS
Quality 0 10 20 30 40 50 60 70 80 90 100
Orig Descr Mont AT Rand SDIS
Similarity 0 10 20 30 40 50 60 70 80 90 100
Figure 1. Box plots of the quality and similarity ratings per type of stim-ulus, showing the median (middle line), quartile range (box), min/max (whiskers), and outliers (crosses).
3.4 Effects of Order on Ratings in Experiment 1 As the perceptual listening test was quite long (the mini-mal listening time for 27 sounds, each with 6 stimuli and one original, is already 27 · 7 · 7 s = 22 min, the actual test time would be closer to 35 min), the question is if partici-pants change their rating behaviour over time, because the prolonged concentration while listening and rating leads to fatigue.
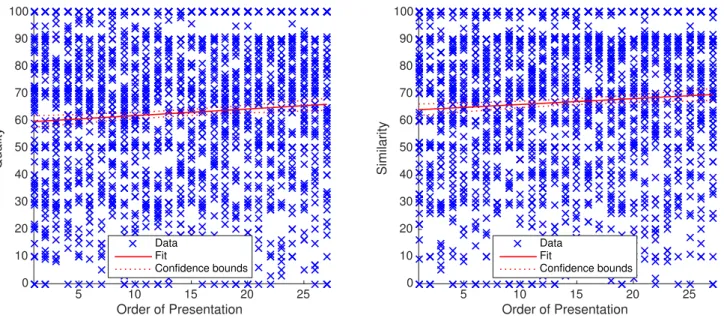
Figure 2 shows the linear regression fit for all ratings for all synthesised stimuli. The quality ratings show a slight correlation significant at the 1% level with p = 0.0008. The slope models a 0.24 and 0.22 increase in quality and similarity rating, respectively, per presentation order.
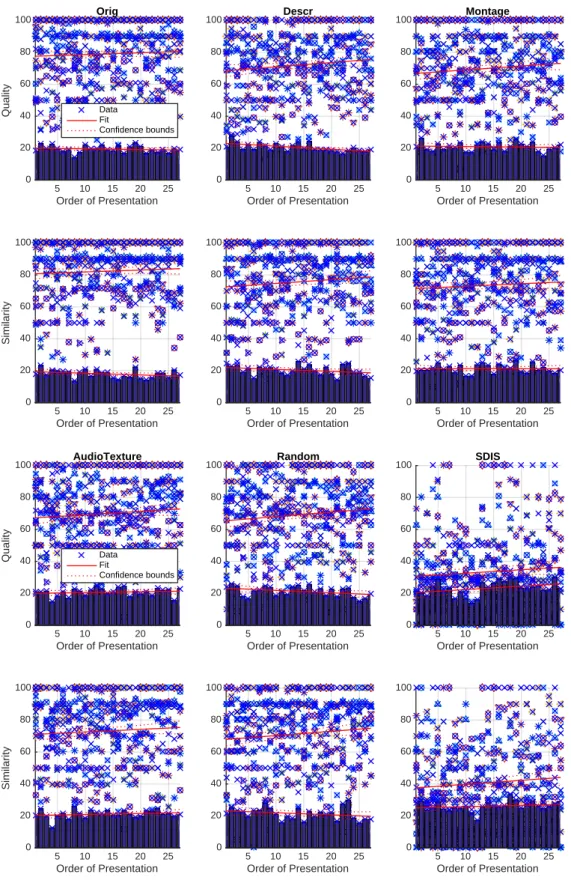
Figure 3 shows, for each stimulus type, a linear regres-sion fit of the ratings versus the order of presentation of the sound example. We do observe a general trend for the ratings to rise towards the end of the test. For Descr and Random, the model is significant at the 5% level for qual-ity ratings, for similarqual-ity ratings just above 5%, and for Montagequality rating at the 10% level. However, only a small fraction of the data is explained by the order, which is good, since we can conclude that the subjects in the test really made an effort to rate the stimuli with concentration and dedication throughout the long perceptual test.
The effect of presentation order is associated to a 0.24 slope that corresponds to a model difference of 6.5 rating points between the first and the last example. For the De-scrand Random quality ratings, we found a 0.27 and 0.28 slope, respectively, that corresponds to a difference of 7.5 points.
Figure 3 also shows the standard deviation of ratings for each stimulus type over order of presentation, and a linear regression fit. These fits show in general a falling trend (the subjects converging towards common values), except for algorithm SDIS, which stands out also because it is always rated much lower.
3.5 Hypotheses for Experiment 1
The fact that the rise in ratings is only statistically signifi-cant for some of the algorithms, and only for their respec-tive quality ratings, hints at a possible accustomation of the listeners to the artefacts of some of the algorithms.
4. EXPERIMENT 2
Data set 2 is from a psychoacoustic listening test [3] ex-amining the unpleasantness of wind buffeting noises in the interior of 19 car models. The cars were recorded in a wind
Order of Presentation 5 10 15 20 25 Quality 0 10 20 30 40 50 60 70 80 90 100 Data Fit Confidence bounds Order of Presentation 5 10 15 20 25 Similarity 0 10 20 30 40 50 60 70 80 90 100 Data Fit Confidence bounds
Figure 2. Scatter plots and linear regression fit of all 1215 ratings of experiment 1 for synthesised sounds, explained by order of the sound example. The parameters of the regression models can be found in table 2.
Quality Similarity
slope p-value R2 adj. R2 slope p-value R2 adj. R2
Global 0.24 0.0008 0.51% 0.46% 0.22 0.0030 0.40% 0.36% Orig 0.11 0.3385 0.21% -0.02% 0.12 0.2680 0.28% 0.05% Descr 0.27 0.0366 1.00% 0.77% 0.24 0.0604 0.81% 0.58% Montage 0.24 0.0673 0.77% 0.54% 0.16 0.2402 0.32% 0.09% AudioTexture 0.21 0.1057 0.60% 0.37% 0.17 0.2163 0.35% 0.12% Random 0.28 0.0388 0.98% 0.75% 0.27 0.0516 0.87% 0.64% SDIS 0.21 0.1537 0.47% 0.24% 0.25 0.1383 0.50% 0.28%
Table 2. Linear regression fit results for experiment 1: slope of the regression line m, p-value of the regression model, and percentage of the variation
explained by the model R2and adjusted R2.
tunnel under three different conditions of a buffeting gen-erating device. The test duration was 36 min on average (from 10 to 97 min), and each subject gave 121 ratings in 11 sets of 11 sounds. The experiment design foresaw a lower and an upper anchor reference recording that was present in each set of sounds to rate. In the following we will examine the mean of these ratings only as this elimi-nates the possibly confounding factors of the 19 different car models and 3 experimental conditions.
Note that the original rating of “unpleasantness” on a range from 0 to 1 has been inverted and rescaled here to a “pleasantness” rating from 0 to 100 to align with the more-is-better valence of experiment 1.
slope p-value R2 adj. R2 Global 0.01 0.9127 0.00% -0.02% lower anchor -0.86 0.0001 84.04% 82.27% upper anchor -0.12 0.7146 1.56% -9.38%
Table 3. Linear regression fit results for experiment 2: slope of the re-gression line m, p-value of the rere-gression model, and percentage of the
variation explained by the model R2and adjusted R2.
α Global 0.7681 lower anchor 0.9373 upper anchor 0.8900
Table 4. Inter-rater reliability of experiment 2 (standardized Cronbach’s α) for all ratings, and per condition.
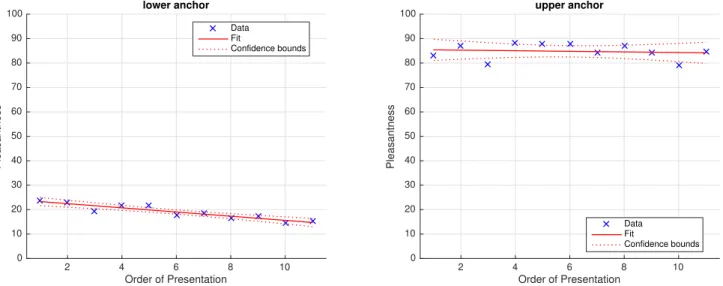
While the global results in table 3 show that the randomi-sation evens out the ratings, the regressions for the anchor sounds, visible in figure 4, show no duration effect for the upper anchor, but a highly significant downwards trend of the pleasantness rating for the lower anchor, that makes for a theoretical difference of 9.5 points between the first and last example.
4.1 Hypotheses for Experiment 2
The sound stimuli for this experiment were all real record-ings of car interiors, therefore the hypothesis for exper-iment 1 of accustomation to artefacts of synthesis algo-rithms can not apply. We hypothesise instead that the downward trend of the pleasantness rating for the lower anchor is due to accumulation of annoyance with the
par-Order of Presentation 5 10 15 20 25 Quality 0 20 40 60 80 100 Orig Data Fit Confidence bounds Order of Presentation 5 10 15 20 25 Similarity 0 20 40 60 80 100 Order of Presentation 5 10 15 20 25 0 20 40 60 80 100 Descr Order of Presentation 5 10 15 20 25 0 20 40 60 80 100 Order of Presentation 5 10 15 20 25 0 20 40 60 80 100 Montage Order of Presentation 5 10 15 20 25 0 20 40 60 80 100 Order of Presentation 5 10 15 20 25 Quality 0 20 40 60 80 100 AudioTexture Data Fit Confidence bounds Order of Presentation 5 10 15 20 25 Similarity 0 20 40 60 80 100 Order of Presentation 5 10 15 20 25 0 20 40 60 80 100 Random Order of Presentation 5 10 15 20 25 0 20 40 60 80 100 Order of Presentation 5 10 15 20 25 0 20 40 60 80 100 SDIS Order of Presentation 5 10 15 20 25 0 20 40 60 80 100
Figure 3. Per-stimulus scatter plots and linear regression fit of ratings of experiment 1 explained by order, overlaid with bar plots of standard deviation and linear regression fit.
Order of Presentation 2 4 6 8 10 Pleasantness 0 10 20 30 40 50 60 70 80 90 100 lower anchor Data Fit Confidence bounds Order of Presentation 2 4 6 8 10 Pleasantness 0 10 20 30 40 50 60 70 80 90 100 upper anchor Data Fit Confidence bounds
Figure 4. Scatter plots and linear regression fit of the two reference sounds 3 main conditions of experiment 2, rating explained by order of presentation of the anchor sounds. The parameters of the regression model can be found in table 3.
ticularly bad sound of this car, while the upper anchor’s much more pleasant sound didn’t provoke annoyance in the long term.
5. CONCLUSIONS AND FUTURE WORK From the analysis of the two data sets we can conclude that there can be effects of changes in the rating behaviour of the subjects in perceptive listening tests over the duration of the tests. These effects vary depending on the type of stimuli and setup of the test. Although randomisation of the order of presentation cancels out these effects for cal-culation of the mean score for the stimuli, if we were to understand them better, we might reach more contrasted results of the tests, or could devise ways of designing the tests in order to minimise these effects. More research and the analysis of more data sets is necessary to see if the find-ings presented here generalise to other experiments and se-tups.
For further work, we could record more precisely the sub-ject behaviour (listening activity and timing), and finally, a closer observation of the physiological and mental state of subjects while taking the test, e.g. via EEG, EMG, or heart rate sensors, could reveal relations between attention signals derived from the sensor data and the hypothesised effects of test duration.
References
[1] The PHYSIS consortium, “Evaluation of example-based sound texture synthesis algorithms of the ph-ysis project,” JASA, 2016, in preparation.
[2] D. Schwarz, A. Roebel, C. Yeh, and A. LaBur-the, “Concatenative Sound Texture Synthesis Meth-ods and Evaluation,” in submitted to DAFx, 2016. [3] G. Lemaitre, C. Vartanian, C. Lambourg, and
P. Boussard, “A psychoacoustical study of wind buf-feting noise,” Applied Acoustics, vol. 95, 2015.
[4] S. Bech and N. Zacharov, Perceptual audio evaluation-Theory, method and application. John Wiley & Sons, 2007.
[5] V. Pulkki and M. Karjalainen, Communication Acoustics: An Introduction to Speech, Audio and Psy-choacoustics. John Wiley & Sons, 2015.
[6] R. Schatz, S. Egger, and K. Masuch, “The impact of test duration on user fatigue and reliability of subjec-tive quality ratings,” J. Audio Eng. Soc, vol. 60, no. 1/2, pp. 63–73, 2012.
[7] P. L. Ackerman and R. Kanfer, “Test length and cog-nitive fatigue: An empirical examination of effects on performance and test-taker reactions.” Journal of Experimental Psychology: Applied, vol. 15, no. 2, p. 163, 2009.
[8] S. O’Leary and A. Roebel, “A montage approach to sound texture synthesis,” in EUSIPCO, Lisabon, Por-tugal, 2014.
[9] ——, “A two level montage approach to sound tex-ture synthesis with treatment of unique events.” in Digital Audio Effects (DAFx), Erlangen, Germany, 2014.
[10] W.-H. Liao, A. Roebel, and W.-Y. Su, “On the mod-eling of sound textures based on the STFT represen-tation,” in Digital Audio Effects (DAFx), Maynooth, Ireland, 2013.
[11] W.-H. Liao, “Modelling and transformation of sound textures and environmental sounds,” PhD Thesis, Universit´e Pierre et Marie Curie, Jul. 2015.
[12] D. Schwarz and S. O’Leary, “Smooth granular sound texture synthesis by control of timbral similarity,” in Sound and Music Computing (SMC), Maynooth, Ire-land, Jul. 2015.
[13] D. Schwarz, “State of the art in sound texture synthe-sis,” in Digital Audio Effects (DAFx), Paris, France, Sep. 2011.