Publisher’s version / Version de l'éditeur:
Vous avez des questions? Nous pouvons vous aider. Pour communiquer directement avec un auteur, consultez la première page de la revue dans laquelle son article a été publié afin de trouver ses coordonnées. Si vous n’arrivez pas à les repérer, communiquez avec nous à [email protected].
Questions? Contact the NRC Publications Archive team at
[email protected]. If you wish to email the authors directly, please see the first page of the publication for their contact information.
https://publications-cnrc.canada.ca/fra/droits
L’accès à ce site Web et l’utilisation de son contenu sont assujettis aux conditions présentées dans le site LISEZ CES CONDITIONS ATTENTIVEMENT AVANT D’UTILISER CE SITE WEB.
Paper (National Research Council of Canada. Institute for Research in
Construction), 1988
READ THESE TERMS AND CONDITIONS CAREFULLY BEFORE USING THIS WEBSITE. https://nrc-publications.canada.ca/eng/copyright
NRC Publications Archive Record / Notice des Archives des publications du CNRC :
https://nrc-publications.canada.ca/eng/view/object/?id=9961598f-f1ac-42b9-8bcf-d40cf2d046bd
https://publications-cnrc.canada.ca/fra/voir/objet/?id=9961598f-f1ac-42b9-8bcf-d40cf2d046bd
NRC Publications Archive
Archives des publications du CNRC
For the publisher’s version, please access the DOI link below./ Pour consulter la version de l’éditeur, utilisez le lien DOI ci-dessous.
https://doi.org/10.4224/40001421
Access and use of this website and the material on it are subject to the Terms and Conditions set forth at
Properties of building materials
S e r
TH1
1N 2 1 d
National Research
Conseil national
c .
o3
*I
Council Canada
de recherches Canada
BLDG
-
Institute for
lnstitut de
Research in
recherche en
Construction
construction
Properties of Building Materials
by T.Z. Harmathy
Appeared in
The SFPE Handbook of Fire Protection Engineering 1988
Section 1, Chapter 26
p. 1-378
-
1-391
(IRC Paper No. 1580)
NRCC 301
10
N R C-
CISTIABSTRACT
Thermal and mechanical properties at elevated temperatures are given for various building
materials. The thermal properties include thermal conductivity, specific heat, thermal
expansion and density. The mechanical properties include strength and modulus of
elasticity of the materials. Creep is also discussed. The various materials considered are
lightweight and normal weight concrete, steel, claybrick, wood and gypsum.
& s u d
-. - -
-L'auteur dCcrit les
ce
hers materiaux de
construction aux temp
!xarninCes sont les
suivantes
:
conducti~
lrmique et masse
volurnique. Les car
nce et le module
d'ClasticitC. On traite
nt les Mtons lkger
et de poids normal, 1'2
-. - - -.Section
llchapter
26
PROPERTIES
OF
BUILDING
MATERIALS
Tibor
Z.
Warmathy
Homogeneous materials, i.e., materials that have the same composition and properties in all their volume ele- ments, are nrely found in nature. Most construction mate- rials are heterogeneous, yet their heterogeneity i s often glossed over when dealing with practical firesafety prob- lems.
The heterogeneity of concrete is easily noticeable. Other heterogeneities related to the microstructure o f mate- rials,
LC.,
their grain and pore structures, are not detectable by the naked eye. The microstructure depends greatly onr
he way the materials are formed. In general. those materialsformed by solidification from a melt show the highest degree of homogeneity. The result of the solidification is normally a
polycqsralline material, which comprises polygonal grains of crystals of random orientations. Severe cold-working in metals may produce an elongated grain structure and crys- tals with preferred orientataons.
I f cooled rapidly, some nonmetallic materials may as- sume an amorphous or glassy structure. Glassy materials have a liquidlike, grainless microstructure with low crystal- line order. On heating they will go through a series of phases of decreasing viscosity.
Synthetic polymers
are
made up of very large mole- cules. In the case of thermoplastics, on heating the molecu- lar chains become more mobile relative to one another. The material softens, much like glass. I n thermoset materials. cross-bonds between the molecular chains prevent the loos- ening of the molecular structure and any change into a liquidlike state.Some building materials are formed from a wet. plastic mass or from compacted powders by firing. The resulting product is a polycrystalline solid with a well-developed pore structure.
Two important building materials. concrete and gyp- sum. are formed by mixing finely ground powders (and aggregates) with water. The mixture solidifies by hydration. The cement paste in a concrete has a hidhly complex
Dr. Tibor 2. Hannathy i s Head of the Fire Research Section. Institute of Research in Construct~on, National Research Council of Canada. His research has centered on materials science and the destructive potential of compartment fires.
microstructure that is interspersed with very fine. elaborate pores.
Most building materials can be treated as isotropic rnaterials. i.e., as though they possessed the same properties in all directions. Among their properties. those that are well-defined by the composition and phase are structure- insensitive. Some others depend on the microstructure of the solid or on its previous history. These properties are struc- ture-sensitive.
POROSITY
AND
MOISTURE
SORPTION
What i s commonly referred to as a solid is actually all the material within the visible boundaries of a solid object. Clearly. i f the solid is porous-and most building materials are-the so-called solid consists of at least two phases: a solid-phase matrix. and a gaseous phase (namely, air), in the pores within the matrix. Usually, however, there is also a liquid or liquidlike phase present: moisture either adsorbed from the atmosphere to the pore surfaces, or held in the pores by capillary condensation. This third phase is always present i f the pore structure is continuous; discontinuous pores (like the pores of some foamed plastics) are not readily accessible to atmospheric moisture.
The pore structure of materials is characterized by two properties: porosiry.
P
(m'lm'), which is the volume fraction of pores within the visible boundaries of the solid: and specijic surface. S im'/m3). the surface area of the pores per unit volume of the material. For a solid with continuous pore structure. the porosity i s a measure of the maximum amount of water the solid can hold when saturated. The specific surface and (to a lesser degree) porosity together determine the moisture content the solid can hold in equilibrium with given atmospheric conditions.'The sorption isotherm shows the relationship at con- stant temperature between the equilibrium moisture content of a porous material and relative atmospheric humidity. A sorption isotherm usually has two branches: an adsorption branch. obtained by monotonically increasing the relative humidity of the atmosphere from 0 to 100 percent through very small equilibrium steps: and the desorption branch. obtained by monotonically lowering the relative humidity from 100 to 0 percent. Derived experimentally, the sorption
isotherms offer some Insight into the nature of the material's pore structure.
For heterogeneous materials consisting of solids of different sorption characteristics (e.g., concrete. consisting of cement paste and aggregates), the sorption isotherms can be estimated' using the simple mixture rule (with j = I; see Equation I).
Among the common building materials. only concrete (or more accurately, the cement paste in the concrete) and wood, because of their large specific surfaces, can hold water in amounts substantial enough to be taken into con- sideration in fire performance assessments.
MIXTURE RULES
Some properties of materials of mixed composition or mixed phase can be calculated by simple rules i f the material properties for the constituents are known. The simplest mixture rule2 is
From the point of view of the role materials play in the structural performance of buildings in fire. materials canxbe grouped as follows:
I. Group L (load-bearing materials): materials designed to carry high stresses. usually in tension. Clearly, for group
L materials. the mechanical propenies related to their behavior in tension are of pr~ncipal interest to the de-
signer.
2.
Group UI(load-bearinglinsulating
materials): materials designed to carry moderate stresses and, in fire. to provide insulation 10 groupt
materials. For group L'Imaterials. both the rnechanlcal propenles (retated mainly to behavior in compre~s~on) and the thermal properties are of interest.
3. Group I (insulating materials): materials not designed to carry load. Their role in fire i s to resist heat transmission through building elements and/or to provide insulation to group L materials. For group I materials, only the thermal properties are of interest.
where s is a material property for the composite. T, is that for the composite's ith constituent, vi (m3/m') is the volume fraction of the ith constituent in the composite, and (has a value between -I and +I.
Hamilton and Cosser' recommended the following rather versatile formula for two-phase solids
The number of building materials has been increasing dramatically during the past few decades. By necessity, only a few of those commonly used will be discussed in this chapter
in
some detail. These materials are: in gmup L.structuml steel and prestressang steel; i n
group LA,
con- crete, brick, and wood: and in group I. gypsum.BUILDING MATERIALS AT
ELEVATED TEMPERATURES
where
Here. phase 1 must dways
be
the
principal continuous phase. n is a function of the phase distribution geometry and. in general, has to be determined experimentally. With n -r=
and n = t,
EquationZ
converts to Equation I with ( = 1 and5
=-
I, respectively. Withn
=
3, a relation is obtained for a two-phase system where the discontinuous phase consists o f spherical inclusions.'By repeated application. Equations 2 and 3 can be extended to a three-phase system.' e.g., to a moist, porous solid, which consists of three essentially continuous phases (the solid matrix, with moisture and air in its pores).
SURVEY OF BUILDING MATERIALS
There
arecombustiblr
andnoncombustible
building materials. To a deslgncr concerned wtth the structural per-formance of a bullding dunng a
fire,
the mechan~cal and thermal properties of these materials art of pnnclpal Inter- est. Yet, combustrble bu~ldrng materfals may become ~ p - ntled, and thereby the positlvc role assigned to them by destgn (i.e., function~ng asstmctural
eicments of the 'build- ing), may change into a negatlve role: becoming fuel and adding to the seventy of fire. Informatton on [hose proper-ties of cambustlble building malenals that are retated to the latter role 1s w ~ t f u l l y inadequate and
will.
~n all Itkcllhood. remain outside the scope of any comprehenslve handbook on fire science for some ttme to come.While calculation techniques for prcdicring the process of deterioration of constructions in fire have become highly sophisticated in recenr years. research related to rupplving input information into these calculations has not kept pace. The designer of the firesafety features of buildings will find that information on the propenies of building materials for the temperature range of interest. 20
ro
700°C. is difficult to uncover. .Most building materials are not stable throughout this temperatun range. On heating they undergo physico- chemical changes, accompanied by transformations in their microstructure, and. at the same time. changes in their properties. A concrete at 5 W C is completely ddfennt from the same material at room temperature.Clearly, the generic information available on the p r o p erties of building materials at room temperature is sddom applicable in firesafety design. Progress in materials science will
mark
true progress infire
science dunng the next few decades.REFERENCE CONDITION
Most building materials are porous and therefore capa- ble of holding a certain amount of moisture, depending on atmospheric conditions. Since the presence of moisture may have a significant and often unpredictable effect on the properties of materials at any temperature below 100°C. it is imperative to conduct all property tests on specimens brought into a moistureless "reference condition" by some drying technique prior to the test. The reference condition is normally interpreted as that attained by heating the test specimen in an oven at 105°C until its weight shows no change. A few building materials, however, among them all gypsum products, may undergo irreversible physicochemi- cal changes when held at that temperature for an extended period. To bring them to a reference condition, specimens of
0
-1
L 0 . s STRAIN, EFig. 1-26.1. Stress-strain curve (strain rate is roughly constant). these materials should be heated in a vacuum oven at some lower temperature level (e.g., at 40°C in the case of gypsum products).
MECHANICAL PROPERTIES
Stress-Strain Curve
The mechanical properties of solids are usually derived from conventional tensile or compressive tests. Figure
I-
26.1, shows the variation of stress, o(MPa). with increasing deformation (or strain), E ( d m ) , while the material is de-
formed (strained) at a more or less constant rate (i.e., constant crosshead speed), usually of the order of 1 mdmin.
Modulus of Elasticity, Yield Strength,
Ultimate Strength
Section 0-e of the curve in Figure 1-26.1 represents the elastic deformation of the material, which is instantaneous
wd reverstble.
The
modulus of elasticity,E (MPa),
is the slope of that section. Between pointse
and u the defoma- tlon IS plastrc, nonrecoverable, and quasi-~nstantaneous. Theplastic
bthavior of the matenal is characterized by the yreldstrength at 0.2 percent offset. a,
(MPa).
and the ultimate strength. uu tMPa). After some localrzed ncck~ng ( ~ d u c t ~ o n of cross-sectional m a ) . the matenal ruptures at polnt r . The modulusof
elastlc~ty 1s more or Less a structure-tnsensit~ve ProF'enY.For steels of similar metallurgical charactenstics. the stress-straln curve can be reproduced at room temperature at a reasonable tolerance and the shape of the curve does not depend on the crosshead speed (within limits). At elevated temperature, the material undergoes plastic deformation even at constant stress, and the e-r section of the stress- strain curve depends markedly on the crosshead speed.
Creep
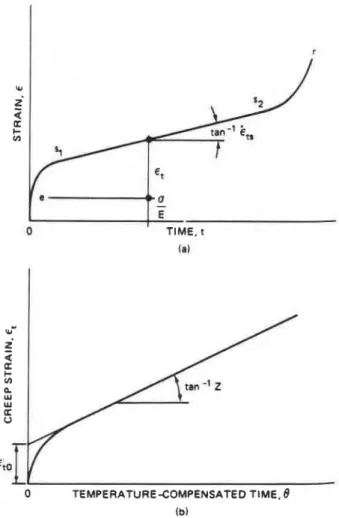
The time-dependent plastic deformation of the material is referred to as creep strain, and is denoted by r , (rnlm). In a creep test the variation of E, is recorded against time, r (h).
at constant stress (more accurately, at constant load) and at constant temperature, T
(K).
A typical strain-time curve is shown in pan a of Figure 1-26.2. The total strain isThe 0-e section of the stress-time curve represents the instantaneous elastic (and recoverable) part of the curve; the rest is creep, which is essentially nonrecoverable. The creep is fast at first (primary creep. section e-s, in Figure 1-26.2). then proceeds for a long time at an approximately constant rate (secondary creep, section s,-s,), and finally accelerates until rupture occurs (tertiary creep, section s2-r). The curve becomes steeper if the test is conducted either at a higher load (stress) or at a higher temperature.
Don's creep concept6 is particularly suitable for dealing with deformation processes developing at varying tempera- tures. Don eliminated the temperature as a separate vari- able by combining it with time
where 9 is temperature-compensated time (h),
iW
is the activation energy of creep [Jl(kmol)], andR
is the gas constant [J/(kmol)K].I
-
E
I 0 TIME, t { r lo
TEMPERATURECOMPENSATED TIME,e
(b)Fig. 1-26.2. (a) Scmin-time curve; 7
=
constant, a constant (b)From a practical point of view, only the primary and secondary creep are of importance. I t has been shown7,' that the creep strain in these two regimes can be satisfactonly described by the following equation
or approximated by the simple formula
where
Z
is the Zener-Hollomon parameter (h-I), and E, isanother creep parameter (rnlm), the meaning of which is explained in part (b) of Figure 1-26.2. The Zener-Hollomon parameter is defined as9
where i,, is the rate of secondary creep (h-'), at tempera- ture.
T.
The two creep parameters,Z
andem,
are funct~ons of the applied stress on!y (i.e.. independent of the tempera- ture).For most materials creep becomes noticeable only if the
temperature is higher than about one-third of the melting temperatute. The creep of concrete at room temperature ts due to the presence of water in ~ t s mi~rostructure.'~ Mukad- dam and Breslerl' and Schneider" described procedures for comlatlng experimental creep data lor concrete at moder- ately elevated and high temperatures, respecttvely.
THERMAL PROPERTIES
Dilatometric Curves
The dilatometric curve is a record of the fractional change of a linear dimension of a solid at steadily increasing or decreasing temperature. With mathematical symbolism. the dilatometric curve is a plot of
At!
-
against Tfa
where
1
C = I-
C,, and P and &are the changed a& original dimensions of the solid (m), respectively, the latter usually taken at room temperature.AC
reflects not only the linear expansion or shrinkage of the ma~crial, but also the dimen- sional e&!s broughL on by possible physicochemical changes ("reactions." in a generalized sense).The heating of the solid usually takes place at an agreed-upon rate, SQClmin as a rule. Because the physico- chemical changes proceed at a finite rate and some of them
are
irreversible, the di!atometric curves obtained by hearing the material rarely coincide with those obtained during the cooling cycle. Sluggish reactions maybring
abouta
steady rise or decline in the slope of the dilatometric c u n e ; fast reactions may appear as discontinuities in the slope. Heating the material ata
rate higher than YCtrnin usually causes the reactions to shift to higher temperatures and to develop faster.Most of the dilatometric curves to be shown were recorded and reported earlier.'' A horizontal dilatometric apparatus was used, made to the design of the British Ceramic Research Association by a British manufacturer
and modified to make it suitable for automatic operation."
The sample was 76.2 mm long and about 13 by 13 mrn in cross secrion. It was subjected to a small spring load which
varied dunng the test. Unfonunately, even this small load caused creep shrinkage wlth those materials that ended to soften at higher temperatures. Funhermore. since the appa- ratus drd not provide a means for placing the sample In
a
nitrogen atmosphere. in certain cases ox~dation may also have had some effect on the shape of the curves.
Thermogravimetric Curves
The thermogravimetric curve is a record of the frac- tional variation
of
the mass of a solid at steadily increasing or decreasing temperature. Again, with mathematical symbol- ism. a thermogravimetric curve is a plot ofwhere
M
andM,,
are the changed and original masses of the solid (kg), respectively, the latter usually taken at room temperature. If the curve is obtained by heating the solid, the agreed-upon rate of heating is, again, YClmin.The thermogravimetric curves reflect reactions accom- panied by loss or gain of m u s but. naturally. do nor reflect changes in the ma~erids' microstructure or crystalline order.
MIM,
=1
i s the thermogravimetric curve for a chemically inert material. Aga~n, an s c n a s e in the rate of heating usually causes the chemical reactions to shift to higher temperatures and to develop faster.The thermogravimetric curves to be shown were ob- tained by a DuPont 951 thermogravimetric analyzer," using specimens of 10 to 30 mg in mass, placed in a nitrogen atmosphere. The rate of temperature rise was S°C/min."
Density, Porosity
The density, p (kg/m3), in oven-dry condition, is the mass of a unit volume of the material, comprising the solid itseif and the gas-filled pores. Assuming that the material is isotropic with respect to its dilatometric behavior, its density 3t any temperature can be calculated from the thermogravi- metric and dilatometric curves.
where p, is the density of the solid at the reference temper- ature (usually room temperature), and the T subscript indi- cates values pertaining to temperature
T
in the thermograv- imetric and dilatometric records.The mixture rule in its simplest form (Equation 1 with
J = I ) applies to the density of composite solids.
where the i subscript relates to information on the ith component.
If,
as usual, the composition is given in mass fractions rather than volume fractions, the volume fractions are to be calculated as1-382
FUNDAMENTALS
where wi is the mass fraction of the ith component (kglkg). True density, p, (kglm3), is the density of the solid in a poreless condition. Many building materials are nonexistent in such condition, and therefore p, may be a theoretical value derived on crystallographic considerations, or determined by some standard technique, e.g.. ASTM C-135.16 The relationship between the porosity and density is
The overall porosity of a composite material consisting of porous components is
where again the i subscript relates to the ith component of the material.
Calorimetric
Curves
A calorimetric curve describes the variation with tem- perature of the apparent specific heat of a material at constant pressure, c,
(Jikg
K).
The apparent specific heat is defined aswhere
h
is enthalpy (Jkg), and the p subscripts indicate the constancy of pressure. If the heating of the solid is accom- panied by physicochemical changes ("reactions"), the en- thalpy becomes a function of the degree of convenion from the reactant(s) into the product(s),6
(dimensionless). For any temperature range where conversion takes plac~,'.~' i.e., for 0 s f sI
where
Fp
is the specific heat for that mixtureof
reactants and (sol~d) products that the matenal cons~stsof
at a grven stage of the conversion, charactenzed by4,
and1W,
i s the latent heat associated withthe
conversion(Jlkg).
As this equation and Figure 1-26.3 show. i n temperature intervals o f phys~cochemrcal ~nstab~lity the apparent spec~fic heat conslsts of sensible heat and latent heat contnbuttons. The latter contnbutron will result in a peak in the calonmet- nc curve; a maxlmum
d
the reaction 1s. endothermic. mlnl- mumif
i t is exothemc.I n heat Row studies it is usually
the
pc, product rather than c, that IS needed as Input information,Tbs
product IS refemd l oas
"volumetric" spec~iic heat.For a long tlme adiabatic calorimetry was the principal methcd to study
the
shape of the c, versusT
relatronship.Today.
ditrcrcntial scannlng calorimetry(DSC)
IS the most-
TEMPERATURE. T Fig. 1-26.3. The apparent s p c i j k heat.
commonly used technique for mapping the curve in a single temperature sweep at a desired rate of heating. Unfortu- nately, the accuracy of the DSC technique in determining the sensible heat contribution to the apparent specific heat may not be particularly good (sometimes it may be as low as 220
percent).
The rate of heating is. again, usually S°C/min. At higher heating rates the peaks in the DSC curves tend to shift to higher temperatures and become sharper.
Materials that undergo exothermic reactions may yield negative values in the calorimetric curve. A negative value for c, indicate's that at the applied (and enforced) rate of heating, the rate of evolution of reaction heat exceeds the rate of absorption of sensible heat by the material. I n natural processes the apparent specific heat can never be negative. because the heat evolving from the reaction is either scat- tered to the surroundings, or i f absorbed by the material. causes a very fast temperature rise. I f the heat of reaction is not very high, obtaining nonnegative values for c, can be achieved by suitably raising the scanning rate. For this reason. some materials undergoing exothermic reactions must be tested at rates of heating higher than 5"Clmin. often as high as SO°C/min.
Some of the information in this section was developed with the
aid
of a DuPont 910 differential scanning calori- meter."." The samples were of a mass of 10 to 30 mg and were placed in a nitrogen atmosphere. The rate of tempera- ture rise was usually S°C/min.I f experimental information is not available, the c, versus 7 relation can be calculated from data on heat capacity and heat of formation, tabulated in a number of The specific heat of compounds not listed in handbooks can often be estimated with the aid of the Neumann-Kopp law concerning the additivity of heat capac- ities. Examples of such calculations can be found in Ref. 5 where, based on handbook data, information is developed for the apparent specific heat versus temperature relation for three cement pastes and four concretes.
THERMAL CONDUCTIVITY
Heat transmission solely by conduction can occur only in poreless. nontransparent solids. I n porous solids (most building materials) th; mechanism o f hiat transmission is a combination of conduction. radiation, and convection. Thethermal conductivity for such solids is, in a srricr sense. merely a convenient empirical factor that makes it possible
to describe the heat transmission process with the aid of the Fourier law. That empirical factor will depend on the con- ductivlty of the solid matrix as
wcH
as on the pomsity and pore size of the solid. At blgher temperarurcs, because o i the increas~ng importance of radiant heat transmission through the pores, conductivity becomes sensitive to the tempera- ture gradient.Measured values o f the thermal conductivity depend on the temperature gradient employed in the test. and therefore great discrepancies may be found in thermal conductivity data reponed by various laboratories. A thermal conduciiv- ity vaiue yielded by a particular technique is. in a strict sense. applicable only to heat Row processes similar to that employed in the technique used.
Experimental data indicate that porosity i s not a greatly complicating factor as long as it is not larger than about 0. I. With insulating materials, however. the poroji~y may be 0.8
or higher. Conduction through the solid matrix
may
be an insignificant pan of the overall heat transmission process; using the Fourier law of heat conduction in analyzing heat transmission may Iead to deceptive conclusions.If
the solid i s not oven-dry, any temperature gradient init will create a migration of moisture, mainly by an evapo- ration-condensation mechanism." The migration
of
mois- ture is usually but not necessarilyin
the direction of heat flow, and manifests itselfas
an Increase lor decrease)in
the apparent thermal conductivity o f the solid. Furihennorc. even oven-dry solids may undergo decomposition (mainly dehydration) reactions at higher temperatures. The sensible heat carried by the gaseous decomposition products as they move in the pores adds to the complexity of the heat flow process. At present them is no way of satisfactorily accwnt- ing lor these mass transfer processes in studies of heat flow processes occurring under fire conditions.The thermal conductivity of layered, multiphase solid mixtures depends on whether the phases lie in the direction of, or normal to, the direction of heat flow. The simple mixture rule is applicable, with
5
= I in the former case and5
=
-
1 i n the latter. Thus. in those two limiting casesand the subscripts 1 and 2 relate to the contlnuour and drscont~nuous phases, respect~vely. When both pha\er are essent~all!: contlnuous, as w ~ t h most porous mater1al.i 1 ~ 1 t h alr as the second phase), a lower value of n seems to be apvl~cable:' about n = 1.5. I f the conduct~vtty of arr IS
negllglbly small In companqon w ~ t h that of the sold. the following IS a good approxrmation
where k, i s the conductivity of the solid itself ( W / m K ) . At higher temperatures. however. the pores become conductive because of radiation. The thermal conductivity i s customar-
ily expressed as a sum of two terms
where
and k, is the so-called radiant conductivity (W/m
K).
u i s the Stefan-Boltzmann constant(W/rn'K4).
d , is the characteris- tic pore size (m). and F is a constant characteristic of the material and the pore geometry (dimensionless).''The thermal conductivity of solids is a structure-sensi- live property.
If
a solid is crystalline, its conductivity is relatively h~gh at room temperature but gradually decreases as the temperature rises.If,
on the other hand. it is predom- inantly amorphous. its conductivity ts low at room tempcr-ature and Increases slightly with temperature. The conduc- tivity of porous crystatline materials may also increase at very h~gh temperatures because
of
the radiant conductivity of the pores.Unfortunately, to the author's knowledge. no scanning rechniquc IS ava~fable for the acquisition of a continuous
thermal conductrvity versus temperature curve from a single test. Such a curve must be est~mated from the resutts of tests conducted at various temperature levels. Speclal problems anse In the temperature intervals o f physicochemical insta-
and
where k and
ki
arc [he thermal conductivities of the mixture and its constituents (WlmK).
respectively.There
1s
substantial evidence-'." that Equations 2 and 3.with
n
= 3, arc applicable coany
two-phase material con- sisting of a continuousand
a discont~nuous solid phase. irsespcct~ve of the geometryof
the discont~nuous phase.v,kl
+
av, k, k = 01 + where 3k a s - Zk,+
k,
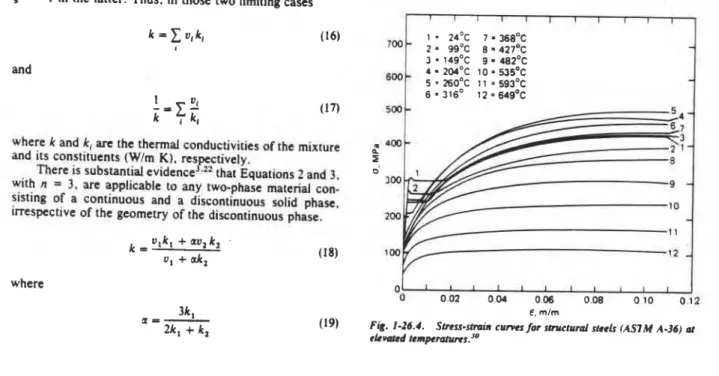
00 ~ " ' J 0.02 0.04 0.06 0.08 0 10 0.12 E, mlrnFig. 1-26.4. Strtss-strain c u m s for stnuturd steels (ASIM A-36) at
bility. Both the steady-state and variable-state techniques of measuring thermal conductiv~ty requite the stabilization of
either a temperaturr k v c l or a temperature distnbufion. and therefore a cenain mrcrostructural condition in the specimen pnor to the test. The test results can be viewed as potnts on acontlnuous thermal conduct~vity versus temperature
curve
obtained by an imaginary scanning technique performed atan
extremely slow scannrng r a k Since each pomt penains to a more ar less stab~lized microstructural partem. them I STEMPERATURE. OC
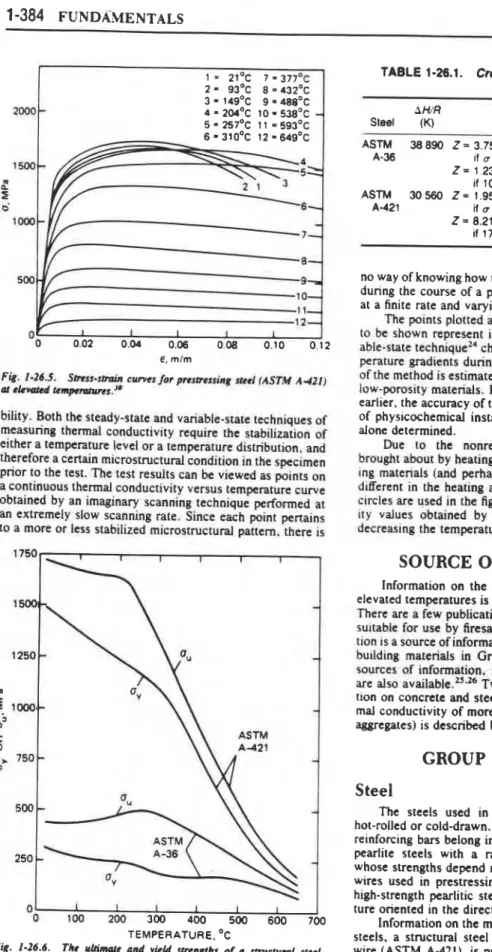
Fig. 1-26.6. The ulrirnarc and yield strengths of a smcturcrl steel (ASTM A -36) and o prestressing steel (ASTM AdZl).'O
TABLE 1-26.1. Creep Pmpertks of TWO Typic81
Stesls AH/R
4
a) Steel (K) (h-') (d~rnenaonless) ~ t d d ASTM 38 890Z
= 3.75 x 10Bd c0 = 1.03 x 10-'6' 75 A-36 11 u s 103 Z = 1.23 x 10'eeOOLUo 11 103 < u s 310 ASTM 30 560Z
= 1.95 x lbd E~ = 92.6 x 1 0 - " 8 ~ ~ A-421 11 u c 172 2 = 8.21 x 1 0'3e00'4s0 1 f 1 7 2 C o s 6 9 0no way of knowing how the thermal conductivity would vary during the course of a physicochemical process developing at a finite rate and varying microstructure.
The points plotted as open or solid c~rcles in
the
figures to be shown represent information developed using a vari-able-sutc techniquex' characterized by relatively s m d tcm- peraturc gradients during the measurtrnents. The accuracy of the
mtrhod
is estimated lo be about 2 7 percent for stable. low-mrosity malcrials. Because of the difficulties described earlier, the accuracy of this method in temperature intervals of physicochemical instability cannot be firmly stated, let alone determined.Due to the nonreversible microstructural
changes
brought about by heating. the thermal conductivityof
build- ing materials (and perhaps most other materials) i s usually diKerent In the hcating and cooling cycles.Open and
solid c ~ r c l t s are u x d In the figures to identify thermal conductiv- ity values obtained by stepwise increasing and stepwist dccrcas~ng the temperature of the sample. respectively.SOURCE OF INFORMATION
lnformation on the properties of building materials at elevated temperatures is scattered throughout the literature.
There
art a few publications, however, thatare
panicularly sultablc for use by hresaftty specialists.One
such publica- uon 15a
source of information on the thermal propcrtlcs of 3 1 building materials in GroupsLfl
andI."
Comprehensive sources of tnlormatron, spceihcally on concrete and stcd.are also a v a r l a b ~ e . ~ . ~ ~ T w o reponst' a v e much rnforma- tlon on concrete and steel; finally, information on the ther- mal conductiv~ty of more than 50 rocks (potential concrete aggregates) 1s described by Birch and Clark.29
GROUP L MATERIALS
Steel
The steels used in the building industry are either hot-rolled or cold-drawn. The structural steels and concrete reinforcing bars belong in the first group. These are ferrite- pearlite steels with a randomly oriented grain structure whose strengths depend mainly on the carbon content. The wires used in prestressing steels are cold-drawn, and are high-strength pearlitic steels with an elongated grain struc- ture oriented in the direction of the cold work.
Information on the mechanical properties of two typical steels, a structural steel
(ASTM
A-36) and a prestressing wire(ASTM
A-421). is presented in Figures 1-26.4 through 1-26.6 and Table 1-26.1.'" Figures 1-26.4 and 1-26.5 arePROPERTIES OF BUILDING MATERIALS
1-385
DL'
1 I I I tt
0 lpo 2w 300 400 500 600 7 0 0
TEMPERATURE, OC
Fig. 1-26.7. The effecr of lrmperature on rht maddns of elosriciry of (1) stmchMl sue&'' and (2) rcmfoming barsJ1
stress-strain curves at room temperature and many elevated
temperature levels. Figure 1-26.6 shows the effect of tem-
perature on the yield and ultimate strengths for these two
steels as evaluated from the stress-strain curves. Table
1-26.1 lists the material constants needed to describe the
creep behavior of Jhe two materials. Since creep is a very
structure-sensitive property, the creep constants may differ
significantly even for steels with similar characteristics at
room temperature.
The modulus of elasticity is about 198
( 23)
xi d MPa
for a variety of common steels at room temperature. Figure
1-26.7 shows its variation with temperature for structural
steels3' and for steel reinforcing bars." (E, in the figure is
the modulus of elasticity at room temperature.)
Among the thermal properties of steel, thermal expan-
sion is of interest in the design for firesafety. The thennal
expansion is a structure-insensitive property. The dilatomet-
ric curve shown in Figure 1-26.8 is applicable to all common
steels. Notable in the curve is a sudden decline at about
700°C. associated with the austenitic transformation of steel.
-
-
-
-
760'~-
-
-
-
0 0.004 0 0 0 8 0.01 2 E, mlmFig. 1-26.9. Siress-strain curves for a figheight masonty concrere at
elcvolcd rempcndure~.~~
GROUP
L/I
MATERIALS
Concrete
The term concrete covers a large number of different
materials, with the single common feature that they are
formed by the hydration of portland cement. Since the
hydrated cement paste amounts to only about 25 volume
percent of the materials present, the properties of concrete
may vary widely with the aggregates used.
Concretes are usually subdivided into two major
groups: normal-weight concretes with densities usually in
the 2200 to 2400 kglm' range, and lightweight concretes with
densities less than approximately 1850 kg/m3. Firesafety
specialists again subdivide the normal-weight concretes into
TEMPERATURE. OC Fig. 1-26.8. Dihotnelric curve for srrrl.
TEMPERATURE, O C
Fig. 1-26.10. The effecr of tempetwwc on the d u l u of elosrir?? of concws with wiow aggregates."
1-386
FUNDAMENTALS
O' UNSTRESSEO RESIDUAL.
-
2 0 4t
]
AVG. I N I T I A L 0, = 26.9 MPI -\ Y
!
O omo
mu 6OO &W TEMPERATURE. O CFig. 1-26.11. The effect of temperature on the compressive strength of o nor&-weigh# concrete with siliceous aggregate."
silieews and carbonate
aggregate
concretes according to the composition of the pnnctpal aggregates used.Among the mechanrcal properties
of
concrete. a consid- etable amount of informat~on IS ava~lable on the variat~on of modulus of elasticity and ultimate compressive strength ofthe
material, while a limited amount of tnfomation i s aua~l- able on the complete stress-strain curves. Figure 1-26.9 shows the stress-stramcurvcs
for a I~ghtwerght concrete with expanded shale aggregate at room tcmpcrature and a few elevated temperature I c v e l ~ . ~ ' Theshapc
ofthe
curves may depend on the time of heating the test speclrncn at the large1 tempraturc level before the compression test.Schnerde? and Anderbcrg and ~helandersson~' stud-
ied the stress-strajn curves of normal-weight concrete at
elevated lempcratures under a number of lortd~ng conditions. The modulus nf elasticity may vary over a wide range.
from
I8 000 to 36 000 MPa, dependent mainly on rht com-position
of
rhc concmte. Using an optical method. CruxMfound that the decl~m of the modulus of tlast~city w ~ t h temptmturc docs not depend stgnificantfy on the type of
aggscgate. (See Figure 1-26, t0; E, in the figure is
the
modulus
d
cIasticity at morn temperature.) Otherresearch-
ers"." found little
change
up to about 2WC.The
ult~mntt strength of concrele may alsa vary o w awide mge, and is inffucnccd by such factors as age,
nature
and size
of aggregate, amount of aggregate. and water to cement ratio. For normal-weight concretes the strength i s0 200 400 600 800
TEMPERATURE. OC
Fig. 1-26.12. The effect of temperature on the compressive smngth of a n o d - w e i g h t concrete with carbotwa aggregate."
1 0 0 8
-
0 04--
d
-
UNSTRESSED.
RESIDUAL 0 3 ~ 4 - ISANOEDIA V G INITIAL 0, OF "UNSANDEO" CONCRETE
-
1 7 9 M P ~ ' \ AVG INITIAL O,, OF "SANDED" CONCRETE 26 9 MPa1 i I I 1
2W 4Do 6W BW
TEMPERATURE. *C
Fig. 1-26.13. The effect of temperature on the compressive strength of two lightweight concretes.
'"
usually between
20
and 60 MPa, and for lightweight con- cretes between 13 and 45 MPa.The variation of ultimate compressive strength with temperature is shown in Figures 1-26.11 and 1-26.12 for normal-weight concretes with siliceous and carbonate aggre- gates, respectively. and in Figure 1-26.13 for two lightweight concr~tes.'~ [(IT,), in the figures is the ultimate strength at room temperature.] The specimens were heated to the target temperature either without load (curve "unstressed"), or with a superimposed load amounting to 40 percent of the ultimate strength (curve "stressed"). I n a third series of tests the specimens were heated to the target temperature. then cooled to room temperature, stared at 75 percent relative humidity for six days, then tested (curve "un-
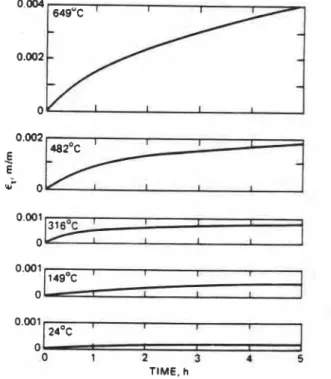
TIME. h
Fig. 1-26.14. Creep of o carbonate owregat8 concrete ad wiocu
lenrprratw levels (apprird smo: 12.4 MPo; conpnssive sbength of the moteriol ad room tempsrature: 27.6 M P ~ ) . ~
PROPERTIES OF BUILDING MATERIALS
1-387
4015 " l " ' ' r r ~ ' ~
0 100 200 300 400 500 800 700 800 90010Wll0012OO
TEMPERATURE. OC
Fig. 1-26.15. Dihlomebic curves for two n o d - w e i g h t and IWO
lightweight co~)crrtrs." ( I ) N o d - w e i g h t c o n c w with siliceous ag-
gregate; (2) N o d - w e * concrete w d C&MU aggmgate; (3)
Lightweight conenu with expanded shale aggregate; an$ (4) Light- weigh concrete with pumice aggmgau.
stressed residual"). It was noted that the original strength of
concrete between 27.6 and 44.8
MPa
had little effect on the
percentage decline of strength with the rise of temperature.
Further information on the strength of concrete at
elevated temperatures is a ~ a i l a b l e . ~ ~ * ~ ' . ' ~ - ~ ~
Some information on the creep of concrete at elevated
temperatures is available from the work of Schneider12 and
C r ~ z . ~ ~
The creep curves shown in Figure 1-26.14 are those
recorded by Cruz for a normal-weight concrete with carbon-
ate aggregates.
The
dilatometric curves of
twonormal-weight concretes
(withsiliceous
and
carbonateaggregates) and
two
light-weight concretes (with
expanded
shaleand pumice aggre.
gates)
are
shown
bFigure
136.14.''These
cuncs wereobtained
mthe
course
of
a comprehensive study
peeformedon 16
concretes. The
typeof
aggregateapparently has
a
@catinfluence
on the shape of
the curves.The results of dilatometric and thermogravimetric tests
were' combined to calculate the density for these same
concretes. The variation with temperature of the density of
l l ~ o ! i 3 b 0 ik
sh
7 mibo
A
t il ~ l ! mTEMPERATURE. OC
Fig. 1-26.16. Density oj IWO ~ d - w e i g k and two I'ght~eight concre&a." (1) N o d - w e i g h t concrrtr with siliceow aggregate; (2) N o d - w e i g h t concr& with C&MU -gate; (3) Lighrwcigkl concrete with ex- s h b aggregate; an$ (4) Lightweight concrete with pumice aggreglrr.
L I I I
1
0 200 400 600 800 TEMPERATURE. OC
Fig. 1-26.17. Usud mngrs f o r t h volumerrie spc@ heas of normal- weight and lightweight concretes.'
the
four concretes in Figure
1-26.15 isshown
in Figurc 1-26.16.The partial decomposition
of aggregate isresponsi-
ble for a
substantial
drop(above
7 K ) in tkdcnsiry
of
concrctts made with
carbonate aggregates.
The
apparent specific heat
ofvaious concretes
wasstudied h l h
thtorctically'
and e~perirnentdly.~'The usual
range
of variation
ofthe volumetric specific heat
(i.t.,rhe
product
pc ) fornormal-weight and lightweight concretes is
shown in
&ure 1-26.17. Thusinformarion. derived by com-
bin~ng thermodynamic
data
withthermogravimetric obser-
varions.
has since
b e dconfirmed by diaerential
scanningcalorimetry. ExpcrirnmtaI data
on a
fewconcretes and
someof (heir constituents IS
available."
Since approximately 75 percent of a concrete consists of
aggregates, it is not surprising that the thermal conductivity
of a concrete depends mainly on the nature of its aggregates.
In general, concretes made with dense crystalline aggregates
show higher conductivities than those made with amorphous
or
aggregates. Among common aggregates
has
the highest conductivity, and therefore concretes made with
siliceous aggregates
a&on average more conductive than
those made with carbonate aggregates.
- -
If'
I
Yv v
Enab
v3
1.5 4 r' 2 h I I I II
0 200 400 6W B(XI TEMPERATURE. OCFig. 1-26.18. T h e d condyca'vil~ of four " b t U g " concr&s and
some u p e r i r n e ~ themal c o n d r r c l i ~ dcto.' Triangles reprrsenl mr-
wus g m d concretes; solid cirebs arc u p a d s&g concretes; sqrrorrs
1-388
FUNDAMENTALS
0.70
0 100 200 300 400 500 600 700 8M1 900 to00 TEMPERATURE, OC
Fig. 1-26.19. Dihromebic and thermogmvirrubic curves /or a clay brick."
Derived h m theoretical considerations.' the four solid curves in Figure 1-26.18 represent the variation of the thermal conductivity of four concretes.
Two
concretes [Nos. I and 21 represent lrmiting cases among normal-weightconcretes, and the other two concretes (Nos. 3 and 4) among lightwe~ght concretes. Figure 1-26.18 also contains some
0 1 1 , 1 1 1 1 I 1
0 tW 200 300 400 500 600 700 800 900 1000
TEMPERATURE, OC
Fig. 1-26.20. Apponnt specifi heor of a clay brick."
0
0
0 100 200 300 400 500 600 700 800 900 loo0 TEMPERATURE. OC
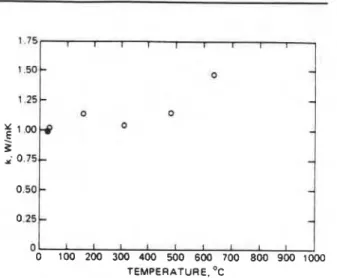
Fig. 1-26.21. Thermal conductivirp of a clay brick." Open circler ¬e points in the heating cycle; solid circle ir afir cooling.
experimental data that indicate that the upper limiting case is probably never reached with aggregates in common use, and that the thermal conductivity of lightweight concretes may be somewhat higher than predicted using theoretical consid- erations.
Further experimental information on the thermal con- ductivity of some normal weight13." and many lightweight concretes" is available.
Brick
The density of bricks range from 1600 to 2500 kg/m3, depending on the raw materials and the bring process. which together determine the porosity of the brick. Their strength may also vary over a wide range, from 10 to 110 MPa. dependent again on these two factors. Since. owing to the presence of mortar joints, brick walls rarely display a strength much over IS MPa, they are usually not considered for important load-bearing roles
in
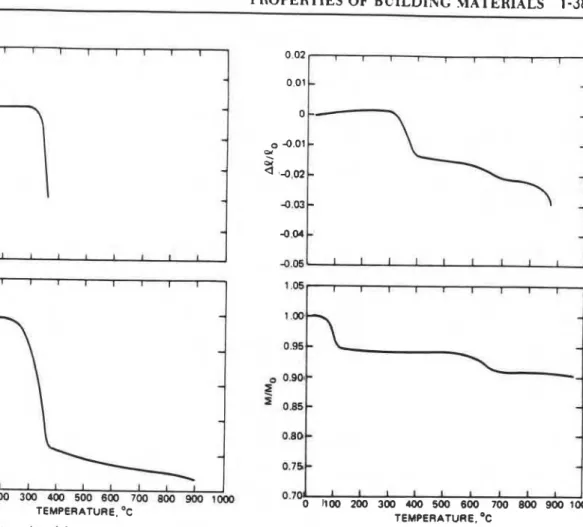
buildings. Consequently, there has been little interest in the mechanical properties of bricks at elevated temperatures.The dilatometric and thermogravimetric curves for a clay brick of 2180 kg/m3 density are shown in Figure 1-26.19. The variation of its specific heat and thermal conductivity
0 2 - \ \
-0. I 1 I 1 I
50 1 00 150 200 250 300
TEMPERATURE. 'C
Fig. 1-26.22. The effect of t e ~ ~on the modulus o/ elorlidY r e
PROPERTIES OF BUILDING MATERIALS
1-389
-
0 1 r 1 1 1 1 1 1 1 1
I
0 100 200 300 400 500 600 700 800 900
?OW
TEMPERATURE. OCFig. 1-26.23. Dihlornebk and thennogmvinrbic curves of pine."
with temperature is shown in Figures 1-26.20 and 1-26.21, respectively. l3
Wood
The density of soft woods used in the construction industry ranges from 300 to 490 kg/m3 in oven-dry condition. Their modulus of elasticity is usually between 6.5 x
lo3
and 11.0 x 10' MPa, and their strength in compression (parallelTEMPERATURE. OC
Fig. 1-26.24. Apparen~ spcJSc hrar of p i d J
0.70
]
0 I100,
200 300,
,
,
400,
500.
600,
700,
800,
900I
1000TEMPERATURE. OC
Fig. 1.26.25. Dibromebic and t L m o g m v M curves for a upsum
b o d . IJ
to grain) between 20 and 45
MPa.
Figure 1-26.22 shows the variation of the modulus of elasticityand
compressive strength of ovendry, clear wood with temperature."-"[E,
and (u,,),, in the figure are modulus of elasticity at room temperature and compressive strength at room temperature, respectively.]TEMPERATURE, OC
PROPERTIES OF BUILDING
MATERIALS
1-391
13. T.Z. Harmathy. DRB Paper No. 1080. NRCC 20956. National Research Council of Canada. Ottawa (1983).
14. T.Z. Harmathy. J. Am. Concr. Insr., 65. 959 (I%&.
15. 951 Thermogravimetric Analyser (TGA), DuPont Instruments, Wilmington ( 1977).
16. Test Method C135-66, Annual Book of ASTM Standards, Amer- ican Society for Testing and Materials. Philadelphia (1986). 17. T.Z. Harmathy and L.W. Allen, J. Am. Concr. lnst., 70. 132
(1973).
18. 910 Diferenrial Scanning Calorimeter
(DCS),
DuPont Instru- ments. Wilmington (1977).19. J.H. P e w , ed., Chemical Engineers' Handbook. McGraw-Hill, New York (1950).
20. W. Eitel, Thermochemcial Methods in Silicate Invesrigarion,
Rutgen
Univ..
New Brunswick (1952).21. T.Z. Hannathy. 1 &
EC
Fundamen., 8, 92 (1969).22. D.A. DeVries. The Thermal Conductivity of Granular Materi- als, Bulletin. Institut International du Froid, Paris (1952). 23. W.D. Kingcry. lnrroduction ro Ceramics. John Wiley and Sons,
New York (1960).
24. T.Z. Hannathy.
J.
Appl. Phys., 35. 1190 (1964).25. Guide for Determining the Fire Endurance of Concrere Ele- mmrs. American Concrete Institute. Detroit (1982).
26.
I.D.
Bennetts. Reporr No. MRUPS23/81/001. BHP Melbourne Research Laboratories, Melbourne ( 1981).27. U . Schneider, ed., Properties of Marerials or High Tempera- tures--Concrete. Kassel
Univ..
Kassel. Gennany (1985). 28. Y . Anderberg. Behavior of Steel at High Temperarures, PrelimReport. RlLEM Committee. (1983).
29.
F.
Birch and H.Clark,
Am. J. Sci., 238, 542 (1940).30.
T.Z.
Hannathy and W.W. Stanzak, in ASTM STP464.
Amer- ican Society for Testing and Materials, Philadelphia (1970). 31. European Recommendarions for the Fire Safety of Steel Struc-tures , European Convention for Construction Steelwork. ~ e c h . Comm. 3. Elsevier. New York (1983).
32. Y . Anderberg. "Mechanical Properties of Reinforcing Steel at Elevated Temperatures." Tekniska Meddelande, nr. 36. Swe- den (1978).
33.
T.Z.
Hannathy andJ.E.
Berndt. 3. Am. Concr. Insr., 63. 93 (1964).34. U . Schneider. Fire Marts., 1, 103 (1976).
35. Y. Anderberg and S. Thelandersson, Bulletin 54. Lund Institute of Technology, Sweden (1976).
36. C.R. Cruz, J. PCA Res. Devel. Labs., 8, 37 (1966).
37. J.G. Saemann and G.W. Washa. J. Am. Concr. Inst., 54, 385 (1957).
38. M.S. Abrams, in Temperature and Concrere. SP25, American Concrete Institute, Detroit (1971).
39. N.G. Zoldnen. Research Report No. 64. Dept. Mines Technol- ogy Surveys, Ottawa (1960).
40. H.L. Malhotra. Magazine Concr. Res.. 8, 85, London (1956). 41. C.R. Binner, C.B. Wilhe, and P. Miller, Declassified AEC
Report No. HKF-I, U.S. Atomic Energy Commission, Wash- ington (1949).
42. H. Weigler and R. Fisher, Bullerin No. 164, Deutscher Auss- chuss fur Stahlbeton, Berlin (1964).
43. C.R. Cruz, J. PCA Res. Devel. Labs.. 10, 36 (1968).
44. C.C. Gerhards. Wood and Fiber. 14, 4 (1981). 45. E.L. Schaffcr, Wood and Fiber, 9. 145 (1977).
46. E.L. Schalier, Res. Paper FPL 450. U.S. Dept. Agriculturel Forest Science, Madison ( 1984).
47. T.Z. Harmathy, in ASTM STP 301, American Society for Testing and Materials. Philadelphia (1961 ).
48. P. Ljunggren. J. Am. Ceram. Soc., 43, 227 (1%0).
49. R.R. West and W.J. Sutton, J. Am. Ceram. Soc., 37, 221 (1954).