HAL Id: hal-00530359
https://hal.archives-ouvertes.fr/hal-00530359
Submitted on 28 Oct 2010
HAL is a multi-disciplinary open access
archive for the deposit and dissemination of
sci-entific research documents, whether they are
pub-lished or not. The documents may come from
teaching and research institutions in France or
abroad, or from public or private research centers.
L’archive ouverte pluridisciplinaire HAL, est
destinée au dépôt et à la diffusion de documents
scientifiques de niveau recherche, publiés ou non,
émanant des établissements d’enseignement et de
recherche français ou étrangers, des laboratoires
publics ou privés.
A two-state model analysis of the melting of sodium
clusters: Insights in the enthalpy-entropy compensation
Sébastien Zamith, Fabien Chirot, Jean-Marc l’Hermite
To cite this version:
Sébastien Zamith, Fabien Chirot, Jean-Marc l’Hermite. A two-state model analysis of the melting of
sodium clusters: Insights in the enthalpy-entropy compensation. EPL - Europhysics Letters, European
Physical Society/EDP Sciences/Società Italiana di Fisica/IOP Publishing, 2010, 92 (1), pp.13004.
�10.1209/0295-5075/92/13004�. �hal-00530359�
epl draft
A two-state model analysis of the melting of sodium clusters:
Insights in the enthalpy-entropy compensation
S. Zamith1,2, F. Chirot3and J.-M. L’Hermite1,2
1 Universit´e de Toulouse ; UPS ; 118 route de Narbonne, F-31062 Toulouse, France 2 CNRS ; Laboratoire Collisions Agr´egats R´eactivit´e, IRSAMC ; F-31062 Toulouse, France
3 LSA, Universit´e de Lyon - UCBL and CNRS, UMR 5180, 43 Bd. du 11 novembre 1918, Villeurbanne, F-69622,
France
PACS 36.40.Ei – Phase transitions in clusters
PACS 82.60.Fa – Heat capacities and heats of phase transitions
Abstract. - Experimental melting temperatures and associated latent heats of size-selected
sodium clusters are analyzed in the frame of a two-state model of melting. The strong varia-tions of these quantities as a function of size make clusters an excellent benchmark for testing speculative ideas about melting. The relation between cohesive energy of clusters and their la-tent heat of melting is demonstrated, and a correlation between cohesive energy and vibrational frequency in the solid state is found. It is shown that this relation may throw light on the enthalpy-entropy compensation, which is observed in a variety of systems undergoing a first-order phase transition. A relation is established between the Lindemann melting criterion, the variation of the vibrational frequency with the cohesive energy, and the enthalpy-entropy compensation.
Introduction. – New experimental methods for mea-suring melting temperatures and latent heats of fusion of size selected clusters have been reported during the last decade. Na [1–3], Sn [4], Ga [5], NaCl [6] and Al clusters [7] have been investigated. Three different methods have been developed for this purpose, all based on the measure-ment of the variation of the heat capacity with tempera-ture. In the first one, clusters internal energy is charac-terized through their photofragmention patterns [1, 2]. In the second method, the internal energy is deduced from collision induced fragmentation patterns [8]. The third method, developed in our group, consists in measuring the mean number of atoms that can be stuck onto a size selected cluster as a function of its initial temperature [3]. It is now demonstrated that clusters of tens of atoms can undergo first order melting transitions. Melting tempera-tures are generally expected to decrease with size, due to increase of the surface/volume ratio [9]. Sn [10] and Ga [8]clusters do not obey this rule, owing probably to differ-ent structures for small clusters and bulk material. In all these studies, a striking feature is the strong variation of both melting temperature and latent heat with size. The melting temperature of sodium clusterscan vary by tens of kelvin from one size to the next, and the latent heat can be multiplied by a factor of several units [3,11]. These strong
variations are essentially ascribed to the variation of sta-bility related to the geometrical structure of the clusters [11, 12], but theoretical calculations show that electronic effects may also play a non negligible role [13].
Beyond the intrinsic interest of measuring unknown properties of peculiar systems, size selected clusters are also a powerful benchmark system to investigate the foun-dations of phase transitions, since some properties (the binding energy per atom for instance) can be varied by merely changing the size under study, without any other change in the system.
An amazing and strong correlation has been observed between the entropy of melting and the latent heat of melt-ing: Sodium [14], aluminum [7] and gallium [15] clusters clearly exhibit such a correlation, which has been sug-gested to be quite general [7] although no quantitative explanation has been proposed up to now.
The experimental melting properties of sodium clusters are analyzed in this paper in the frame of a simple two-level melting model. This model, close to the one intro-duced by Bixon and Jortner [16], establishes relations be-tween melting temperature, latent heat of fusion, cohesive energy and mean vibrational frequency of the cluster. A qualitative interpretation of the relation between these pa-rameters is suggested by our analysis:
S. Zamith et al. h l /2 L melt /p E 0 h S /2 h l h S
Fig. 1: Two-level description of melting.
1. The latent heat of melting is related to the cohesive energy of the cluster (which had already been suggested in other studies [15, 17])
2. The melting temperature increases with the latent heat. It is due, together with remark 1), to the fact that more energy is required to destroy (liquefy) more stable structures.
3. However, the melting temperature does not increase with the cohesive energy as strongly as it would do with-out any change among the other parameters. The energy increase is actually compensated by a decrease of the melt-ing entropy. This property is not restricted to the area of cluster physics. It is called ”entropy-enthalpy compensa-tion” and has been observed in a variety of systems that undergo a first order phase transition [18, 19]. Within our model, this compensation is interpreted as follows: The larger cohesive energy of the most stable solid structures is compensated by a lower entropy, due to an increase of the mean vibrational frequency in the deeper potential en-ergy well of these most stable solid clusters. The higher vibrational frequencies of these strongly bound systems lead to lower vibrational densities of state, resulting in lower entropy of the solid that favors the transition to the liquid state at a lower temperature.
The first two remarks, that concern the relation between the latent heat of melting of clusters and their cohesive energy, had already been made in previous studies [7, 20]. The new pointhereis the establishment of a quantitative relation (the idea had been qualitatively suggested [7, 21]) between the enthalpy-entropy correlation and the correla-tion between the depth of the potential well in which the atoms move inside the cluster (i.e. the cohesive energy per atom) and the mean vibrational frequency in the solid state.
The two-state description of melting. – A con-siderable computational effort has been devoted to the analysis of melting transitions in clusters, especially since Haberland and coworkers [1] have published experimen-tal data for sodium clusters. Theseresults,together with recent data obtained in our group [3], concern sizes from about 30 to several hundred atoms. Almost all the
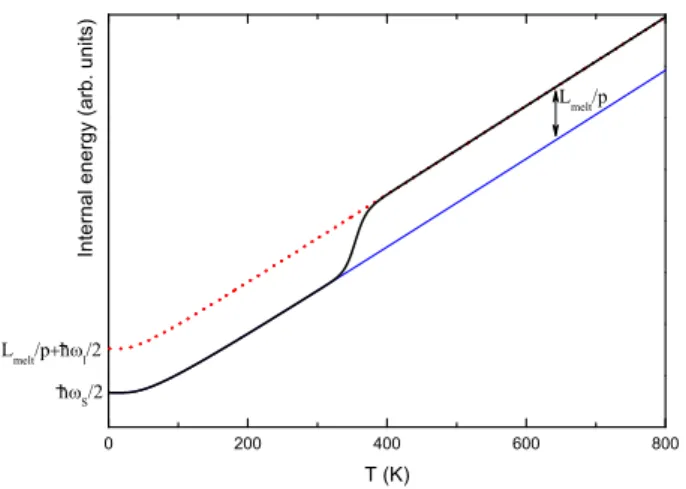
the-0 200 400 600 800 L melt /ph l /2 L melt /p I n t e r n a l e n e r g y ( a r b . u n i t s) T (K) h S /2
Fig. 2: Internal energy per degree of freedom in the frame of the two-levels model. The bottom curve (thin blue line) corresponds to the solid state alone. The dotted red curve is the liquid state alone. The black thick curve is the internal energy obtained by using eq. 2 and 3.
oretical work that aims at reproducing the thermody-namic properties of clusters are Monte Carlo or Molecu-lar dynamics simulations, which requirecomputing a huge amount of trajectories and cannot deal with such a number of particles without simplifying the problem a lot. This results in discrepancies in the predicted values both for the melting point and the latent heat, which may strongly de-pend on the model used (see [22] for sodium clusters). On the other hand, a few authors tried to build simple analyt-ical models to account for some general features of melting in clusters [16, 23]. In [16], the melting phenomenon in clusters is analyzed by consideringthe liquid as an excited manifold with an energy gap above the solid ground state. Both solid and liquid are described in the harmonic ap-proximation and are characterized by two different effec-tive frequencies. In this kind of model, configurational and vibrational entropies are considered separately, according to the superposition approximation [24].
In our model, both the solid and the liquid states are de-scribed by harmonic oscillators with their own frequencies
ωS and ωl. A cluster is considered as a set of p = 3n− 6
(p is the number of degrees of freedom of the system of atoms) independent oscillators. The liquid ground state is shifted with respect to the solid ground state by the energy gap E0. This model for the solid is nothing but the
Ein-stein model for crystals. The use of a harmonic oscillator model for the liquid is more questionable. Some authors consider the melting of clusters as a transition from a sin-gle ground state to a multitude of isomers, in particular for rare gases [16]. In this case, the unique frequency for the liquid is considered as an average value of the mean frequency of all these isomers. Furthermore, a number of widely (and successfully) used models that describe liq-uid clusters evaporation, as the Weisskopf model [25, 26], are derived from a similar assumption. In [27], a model is developed in order to analyze the thermal broadening
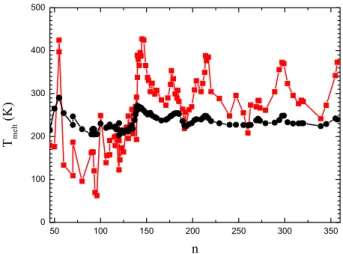
40 60 80 100 120 140 160 180 200 220 240 260 280 300 T e x p ( K ) n
Fig. 3: (Color online) Melting temperatures of sodium clusters. Our results (squares) are plotted with the ones of ref. [11] (open circles).
of plasmon resonances in metal clusters. Effective vibra-tional frequencies are derived for liquid sodium clusters from an approximation of the nuclei motion as calculated in the jellium approximation. Effective harmonic oscilla-tor hamiltonians were also used for nuclei [28] and electron shells [29]. In agreement with these authors, the liquid state is described by oscillators with a single frequency
ωl, which represents an effective description of cluster
de-formation modes. Since the liquid is not structured, its characteristics are not likely to vary abruptly from one size to another. We consider the frequency ωl as fixed,
whereas the frequency of the solid ωs is allowed to vary.
Thus, only two free parameters are allowed to vary with the size of the cluster, namely E0 and ωs.
The two-level modelis sketched in fig. 1. Every degree of freedom is considered as a quantum harmonic oscilla-tor, with a frequency ωs for the solid, ωl for the liquid.
The quantum ground state of the liquid is shifted by E0
with respect to the ground state of the solid. The parti-tion funcparti-tion for an harmonic oscillator in the canonical ensemble is given by:
zl,s= exp(−β¯hωl,s/2)(1− exp(−β¯hωl,s))−1 (1)
where β = (kBT )−1, and the total partition function for
a cluster is:
Z = zsp+ zpl exp(−βLmelt) (2)
where Lmeltis the latent heat of melting (see Fig. 1).
The average energy is obtained as:
E =−∂lnZ
∂β (3)
and the heat capacity is:
C(T ) = dE/dT. (4)
The internal energy E and the heat capacity C(T ) are numerically evaluated. We have plotted in fig. 2 the in-ternal energy per degree of freedom obtained from Eq. 3
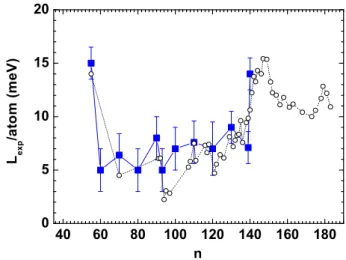
40 60 80 100 120 140 160 180 0 5 10 15 20 L e x p / a t o m ( m e V ) n
Fig. 4: (Color online) Latent heat of fusion of sodium clusters. Our results (squares) are compared with the ones of ref. [11] (open circles).
together with the internal energies one would obtain with the liquid or solid states alone. Asymptotically the energy difference between the liquid and the solid is simply the latent heat of melting per degree of freedom Lmelt/p. The
relation between the latent heat Lmeltand the energy gap
between the ground liquid and solid states E0is given by:
E0= Lmelt/p− 1/2(¯hωs− ¯hωl). (5)
Experimental melting temperatures and latent heat of melting of sodium clusters. – Data from two experiments are presented. In the first one [11], the photofragmentation pattern of thermalized clusters is an-alyzed: The number of photoevaporated atoms is used as a measurement of the internal energy E of the cluster. This quantity is recorded as a function of its initial tem-perature T , and the caloric curve C(T ) is deduced. A peak is observed in the caloric curvewhenmelting occurs. The melting point is the maximum of the peak, and the latent heat its area. In our experiment, atoms are stuck onto mass selected clusters. By counting, as a function of its initial temperature, the maximum number of atoms that can be attached on a cluster,the caloric curve is con-structed[3]. The melting temperature and the latent heat of melting are deduced from the position and the area of a peak in the caloric curve. The data from both experiments
(see fig. 3 and 4) are in good agreement.
Analysis of the experimental results using the two-state model. – Our analysis consists in deducing, from the experimental melting temperatures Texp(n) and
latent heats Lexp(n), the two parameters E0 and ωs for
each cluster sizeas follows: first, the vibrational frequency in the liquid state is kept constant at ωl= 2.3 1012s−1[30].
The caloric curves are calculated from numerical evalua-tion of eq. 4 and the melting temperature Tmelt is
de-duced from the maximum of C(T ). We vary ωs and set
S. Zamith et al. 0 1 2 3 4 5 0 50 100 150 200 250 300 350 400 0 1 2 3 4 Na + 110 C ( k B / d e g r e e o f f r e e d o m ) Na + 140 C ( k B / d e g r e e o f f r e e d o m ) T (K)
Fig. 5: Experimental (squares) and calculated (lines) caloric
curves for N a+110 (bottom) and N a+140 clusters (top).
each size, a unique couple {E0, ωs} is determined from
the two experimental dataLexp(n)and Texp(n). Caloric
curves obtained this way are shown in fig. 5 together with experimental ones. Surprisingly, this simple model repro-duces nicely the size dependant width of the peaks in the caloric curve.
Cohesive energy and latent heat of melting. –
The correlation between the latent heats of melting of clusters and their cohesive energies has already been pointed out in the case of aluminum clusters [17]. The co-hesive energy, defined as the energy required to transform a solid cluster into gas, can be decomposed in two com-ponents: the energy required for the solid to liquid tran-sition, in other word the latent heat of melting Lmelt(n),
plus the energy required to evaporate the atoms from the liquid cluster, in other words the latent heat of evapo-ration Levap(n). Since the liquid is not structured, the
latent heat of evaporation per atom Levap(n)/n is not
ex-pected to vary abruptly from one size to another. The variationswith the sizeof the cohesive energy is thus ex-pected to come from the variations of the latent heat of melting Lmelt(n)/n. This assumption has been confirmed
for aluminium clusters and is expected to apply also for sodium clusters [17]. However, in order to compare di-rectly the latent heats of melting to the cohesive energies, it is necessary to remove from the cohesive energies the latent heat of evaporation, which varies smoothly. The la-tent heat of evaporation Levap(n) is expected to decrease
with the size; this is qualitatively easily understood since
50 100 150 200 250 300 350 1 2 3 4 5 6 E 0 ( m e V / d e g r e e o f f r e e d o m ) n
Fig. 6: Comparison of the cohesive energies from Ref. [31]
(black line) and the energy gap E0deduced from the two-level
model (circles). We have subtracted a smooth size dependant
contribution: 1.113n− 1.137n2/3from the calculated cohesive
energies.
the relative number of atoms at the surface of the clus-ter, which are less bound, increases as the size decreases, but the exact scaling law cannot be determined accurately since it depends on the geometry of the cluster. In fig. 6, the values of E0(n), the solid to liquid energy gap,
de-duced from the experiments using the two-level model are compared to the cohesive energy calculated by Noya and co-workers [31] using a Murrell-Mottram potential, where a smooth component has been removed from the cohesive energies. This component, corresponding to the latent heat of evaporation,is arbitrarily chosen in order to opti-mize the matching between theory and experiment. The variations of E0(n) nicely follow the variations of the
theo-retical cohesive energy. This result confirms, as expected, that the structural properties of solid sodium clusters are largely responsible for the variations of their latent heat of melting.
Vibrational frequency and entropy of melting. –
The vibrational frequencies of solid N a+n clusters ωs(n)
are represented in fig. 7 as a function of the energy gap
E0(n). There is a strong correlation between these two
parameters. This correlation is also a correlation between the energy of melting Lmelt(n) and the entropy of melting
∆S(n). As a matter of fact, the linear relation between ∆S(n) and ωs(n) is easily demonstrated using the usual
relation:
Lmelt(n) = Tmelt(n)∆S(n). (6)
Combining eq. 5 and 6 one gets:
∆S(n) = p(E0+ 1/2(¯hωs− ¯hωl))/Tmelt. (7)
Consequently, within the frame of the two-level model of melting, the correlation between E0(n) and ωs is
equiva-lent to a correlation between energy and entropy of melt-ing. This energy-entropy correlation had already been
ob-0 1 2 3 4 1.0 1.1 1.2 1.3 s / l E 0 (meV/degrees of freedom)
Fig. 7: Correlation between the energy gap E0 and the ratio
of the vibrational frequencies ωs/ωl.
served, including for sodium clusters [14], but did not re-ceive interpretation. Here this issue is reduced to a link between the depth of a potential well (i.e. E0) and a
vi-brational frequency. Energy-entropy correlation has been observed not only for melting transition in sodium, alu-minium and gallium clusters [7, 14, 15], but is also a gen-eral feature of many chemical reactions and processes in biological systems [18,19,21]. It has been pointed out that in some cases the entropy-enthalpy correlation is likely to be an experimental artifact [32, 33], however this criticism does not concern experiments in which the melting entropy and the melting enthalpy are determined independently [33], which is the case in calorimetry experiments.
This effect is often called energy-entropy compensation. The main effect of this relation between entropy and en-ergy is indeed to reduce the variations of the melting tem-peratures as the energy change in the transition varies. In our case for instance, if the energy parameter E0(n) varies
without any change in the frequency ωs(n), the variations
of melting temperatures from one size to another would be enhanced by a factor of almost 5 (see fig. 8): there is a damping effect on the melting temperature variations, due to an increase of vibrational frequency together with an increase of cohesive energy. The physical reason for this behavior may be understood as follows: as the bind-ing forces become stronger, the potential well responsible for the cohesion of the systems in the solid state becomes deeper, thus its curvature and the gap between adjacent vibrational levels increase. As a consequence, the energy required to liquefy the system increases, and so does the melting temperature. However, the density of vibrational levels in the solid state decreases whereas the density of states in the liquid state does not vary. The entropic com-petition between solid and liquid becomes more favorable to the liquid, then reducing themelting temperature.
This damping effect on the melting temperatures can be further illustrated in the classical limit wherean analytical
50 100 150 200 250 300 350 0 100 200 300 400 500 T m e l t ( K ) n
Fig. 8: Melting temperatures obtained when ωsis set constant
(squares) or is allowed to vary (circles). The amplitude of
vari-ation of the melting temperatures is strongly reduced when ωs
varies from one size to another due to energy-entropy compen-sation.
expression can be derived for the melting temperature [34]:
Tmelt= E0/(pkBln(ωs/ωl)) = Lmelt/∆S. (8)
The above mentioned entropic competition between solid and liquid is here directly revealed by the expression ∆S =
pkBln(ωs/ωl).
Links with the Lindemann criterion. – In 1910 Lindemann introduced a criterion for predicting the melt-ing temperatures of crystals [35]. This criterion states that melting occurs when the root mean square (rms) displace-ments δx = √x¯2 of the atoms around their equilibrium
position exceeds a given value. This value is of the order of 10% of the internuclear distance.
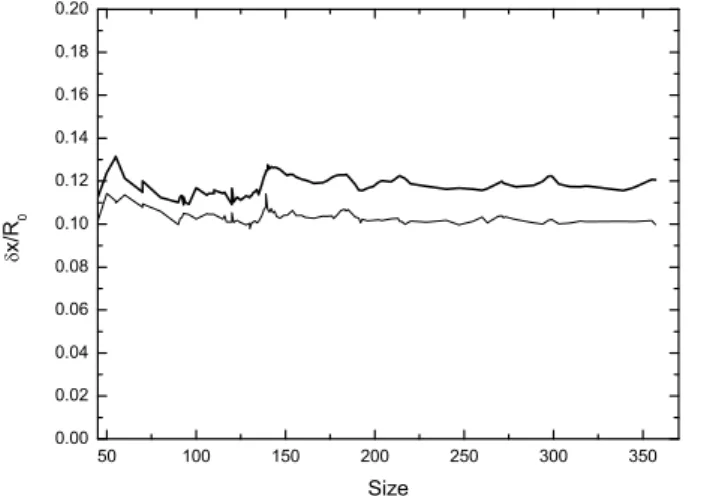
Within the frame of our model, it is easy to deduce from the experimental melting temperatures the widthδof the harmonic well at the melting point (see fig. 1). δ can be considered either as the width of the solid well δs or the
liquid well δl: δs= 2 √ 2E(Tmelt)/(pmωs2), (9) δl= 2 √ (2E(Tmelt)− L)/(pmωl2). (10) The rms displacement is δs,l/ √ 2. The quantity δx/R0 = δs,l/ √
2/R0, representing the Lindemann criterion, is
dis-played for all cluster sizes in fig. 9, where R0≈ 3.5 ˚A is the
mean equilibrium bond length in sodium clusters [36]. It is almost constant, very close to the mean value 10%. The standard deviation of δx/R0 is about 0.5%. The
corre-sponding energy fluctuations (0.2%) are only of the order of 0.05 meV per degree of freedom, much smaller than the variations of E0and ¯hωs, which indicates that δx/R0
S. Zamith et al. 50 100 150 200 250 300 350 0.00 0.02 0.04 0.06 0.08 0.10 0.12 0.14 0.16 0.18 0.20 x/ R 0 Size
Fig. 9: Lindemann criterion at the melting energy for the liquid well (thick line) and the solid well (thin line).
Conclusion. – The size dependence of melting tem-peratures and latent heats of sodium clusters have been analyzed in the frame of a simple two-level model. As in the case of aluminium and gallium clusters, the latent heat is shown to be closely related to the cohesive energy of the clusters. In order to reproduce experimental results, the mean vibrational frequency in the solid state, which is a free parameter, must vary. There is a strong correla-tion between this frequency and the cohesive energy. In the frame of the model, the entropy change upon melt-ingis linearly related to the vibrational frequency in the solid state. The frequency-cohesive energy correlation is thus similar to the more general energy-entropy correla-tion observed for various chemical reaccorrela-tions. This allows suggesting that energy-entropy compensation may be due to the relation between the strength of the interaction and the increase of the vibrational frequency, which lowers the entropy in the solid state, then favors the transition to the liquid state at a lower temperature.
∗ ∗ ∗
We thank P. Labastie and F. Calvo for stimulating dis-cussions.
REFERENCES
[1] Schmidt M., Kusche R., Kronm¨uller W., von
Is-sendorf B. and Haberland H., Phys. Rev. Lett. , 79 (1997) 99.
[2] Schmidt M., Kusche R., von Issendorf B. and Haberland H., Nature (London) , 393 (1998) 238. [3] Chirot F., Feiden P., Zamith S., Labastie P. and
L’Hermite J.-M., J. Chem. Phys. , 129 (2008) 164514. [4] Breaux G., Neal C., Cao B. and Jarrold M., Phys.
Rev. B , 71 (2005) 073410.
[5] Breaux G., Cao B. and Jarrold M., J. Phys. Chem.
B , 109 (2005) 16575.
[6] Breaux G., Bernischke R. and Jarrold M., J. Chem.
Phys. , 121 (2004) 6502.
[7] Neal C., Starace A. and Jarrold M., Phys. Rev. B ,
76 (2007) 054113.
[8] Breaux G. A., Benirschke R. C., Sugai T., Kinnear B. S. and Jarrold M. F., Phys. Rev. Lett. , 91 (2003) 215508.
[9] Labastie P. and Calvo F., in Thermodynamics and
Solid-Liquid Transition, Nanomaterials and Nanochem-istry, edited by C. Br´echignac C. H. and Lahmani M., (Springer, New York) 2007.
[10] Shvartsburg A. A. and Jarrold M. F., Phys. Rev.
Lett. , 85 (2000) 2530.
[11] Haberland H., Hippler T., Donges J., Kostko O., Schmidt M. and von Issendorf B., Phys. Rev. Lett. ,
94 (2005) 035701.
[12] Aguado A. and Lopez J. M., Phys. Rev. Lett. , 94 (2005) 233401.
[13] Ghazi S. M., Lee M.-S. and Kanhere D. G., J. Chem.
Phys. , 128 (2008) 104701.
[14] Schmidt M., Donges J., Hippler T. and Haberland H., Phys. Rev. Lett. , 90 (2003) 103401.
[15] Breaux G., Hillman D., Neal C., Benirschke R. and Jarrold M., J. Am. Chem. Soc. , 126 (2004) 8628. [16] Bixon M. and Jortner J., J. Chem. Phys. , 91 (1989)
1631.
[17] Starace A. K., Neal C. M., Cao B., Jarrold M. F., Aguado A. and Lopez J. M., J. Chem. Phys. , 129 (2008) 144702.
[18] Wetswell M., Searle M., Wales D. and Williams D., J. Am. Chem. Soc. , 117 (1995) 5013.
[19] Williams D., O’Brien D. and Bardsley B., J. Am.
Chem. Soc. , 123 (2001) 737.
[20] Neal C. M., Starace A. K. and Jarrold M. F., J.
Am. Soc. Mass. Spectrom. , 18 (2007) 74.
[21] Mark S. Searle M. S. W. and Williams D. H., J.
Chem. Soc., Perkin Trans. 2 , (1995) 141.
[22] Calvo F. and Spiegelmann F., J. Chem. Phys. , 112 (2000) 2888.
[23] Poland D., J. Chem. Phys. , 126 (2007) 054507. [24] Wales D. J., Energy Landscapes (Cambridge University
Press) 2003.
[25] Weisskopf V., Phys. Rev. , 52 (1937) 1937. [26] Engelking P. C., J. Chem. Phys. , 87 (1987) 936.
[27] Bertsch G. F. and Tom´anek D., Phys. Rev. B , 40
(1989) 2749.
[28] Nilsson S., K. Dansk. Vidensk. Selsk. Mat.-Fys. Medd.
N, o. 16 (1955) 29.
[29] Clemenger K., Phys. Rev. B , 32 (1985) 1359.
[30] de Heer W. A., Knight W. D., Chou M. Y. and Co-hen M. L., Electronic shell structure and metal clusters in Solid State Physics, edited by Seitz F. and Turnbull D., Vol. 40 (Academic, New York) 1987 p. 93.
[31] Noya E. G., Doye J. P., Wales D. J. and Aguado A.,
Eur. Phys. J. D , 43 (2007) 57.
[32] Sharp K., Protein Science , 10 (2001) 661. [33] Cornish-Bowden A., J. Biosci. , 27 (2002) 121. [34] Calvo F., Doye J. P. K. and Wales D. J., J. Chem.
Phys. , 114 (2001) 7312.
[35] Lindemann F., Z. Phys. , 10 (1910) 609.
[36] Poteau R. and Spiegelmann F., J. Chem. Phys. , 98 (1993) 6540.