HAL Id: hal-02638867
https://hal.inrae.fr/hal-02638867
Submitted on 28 May 2020
HAL is a multi-disciplinary open access
archive for the deposit and dissemination of
sci-entific research documents, whether they are
pub-lished or not. The documents may come from
teaching and research institutions in France or
abroad, or from public or private research centers.
L’archive ouverte pluridisciplinaire HAL, est
destinée au dépôt et à la diffusion de documents
scientifiques de niveau recherche, publiés ou non,
émanant des établissements d’enseignement et de
recherche français ou étrangers, des laboratoires
publics ou privés.
Penicillium expansum growth and patulin production:
effect of temperature, pH, and water activity
Joanna Tannous, Ali Atoui, André El Khoury, Ziad Francis, Isabelle P.
Oswald, Olivier Puel, Roger Lteif
To cite this version:
Joanna Tannous, Ali Atoui, André El Khoury, Ziad Francis, Isabelle P. Oswald, et al.. A study
on the physicochemical parameters for Penicillium expansum growth and patulin production: effect
of temperature, pH, and water activity. Critical Reviews in Food Science and Nutrition, Taylor &
Francis, 2016, 4 (4), pp.611-622. �10.1002/fsn3.324�. �hal-02638867�
Introduction
Filamentous fungi are broadly dispersed throughout the environment and are responsible for the spoilage and poisoning of several food matrices. The most common and widespread mycotoxigenic fungi are mainly triggered by the genera: Aspergillus, Fusarium, and Penicillium (Sweeney and Dobson 1999; Binder et al. 2007). Within the latter genus, Penicillium expansum is one of the most studied species (Andersen et al. 2004). Penicillium
expansum is a wound parasite fungus that invades fruits
via injuries, caused by unfavorable weather conditions before harvest (hail, strong wind) or by rough handling, harvesting, and transport (Sanderson and Spotts 1995). This ubiquitous fungus commonly found on pome fruits causes a serious postharvest disease known as blue mold rot and produces significant amounts of patulin, giving rise to substantial fruit losses and serious public health issues (Moake et al. 2005). Patulin is known to have potent cytotoxic, genotoxic as well as immunotoxic effects
A study on the physicochemical parameters for Penicillium
expansum growth and patulin production: effect of
temperature, pH, and water activity
Joanna Tannous1,2,3, Ali Atoui4,5*, André El Khoury1, Ziad Francis1, Isabelle P. Oswald2,3, Olivier Puel2,3 & Roger Lteif1
1Unité de Technologie et Valorisation Alimentaire, Centre d’Analyses et de Recherche, Université Saint-Joseph, Campus des Sciences et Technologies, Mar Roukos, Mkallès, P.O Box 11- 514, Riad El Solh, 1107 2050 Beirut, Lebanon
2Research Centre in Food Toxicology, INRA, UMR 1331 Toxalim, 180 Chemin de Tournefeuille, F-31027 Toulouse Cedex, France 3Université de Toulouse III, ENVT, INP, UMR 1331, Toxalim, F-31076 Toulouse, France
4Laboratory of Microorganisms and Food Irradiation, Lebanese Atomic Energy Commission-CNRS, P.O. Box 11-8281, Riad El Solh, 1107 2260 Beirut, Lebanon
5Department of Biology, Faculty of Sciences, Laboratory of Microbiology, Lebanese University, Hadath Campus, Beirut, Lebanon
Keywords
Growth rate, patulin production, Penicillium
expansum, pH, predictive mycology,
temperature, water activity
Correspondence
Ali Atoui, Lebanese Atomic Energy Commission-CNRS, P.O. Box 11–8281, Riad El Solh, 1107 2260 Beirut, Lebanon. Tel: +961 1 450 811; Fax: +961 1 450 810; E-mail: a.atoui@cnrs.edu.lb
Funding Information
The research work was financially supported by the National Council for Scientific Research (CNRS), Lebanon and the Research Council of Saint-Joseph University (Lebanon).
Received: 14 August 2015; Revised: 5 November 2015; Accepted: 11 November 2015
Food Science & Nutrition 2016; 4(4):
611–622
doi: 10.1002/fsn3.324
Abstract
Penicillium expansum is among the most ubiquitous fungi disseminated
world-wide, that could threaten the fruit sector by secreting patulin, a toxic secondary metabolite. Nevertheless, we lack sufficient data regarding the growth and the toxigenesis conditions of this species. This work enables a clear differentiation between the favorable conditions to the P. expansum growth and those promis-ing for patulin production. A mathematical model allowpromis-ing the estimation of the P. expansum growth rate according to temperature, aW, and pH, was also developed. An optimal growth rate of 0.92 cm/day was predicted at 24°C with pH level of 5.1 and high aW level of 0.99. The model’s predictive capability was tested successfully on artificial contaminated apples. This model could be exploited by apple growers and the industrialists of fruit juices in order to predict the development of P. expansum during storage and apple processing.
even at relatively low exposure levels (Puel et al. 2010). Therefore, the European Union has fixed a maximum tolerated level of 50 μg/kg for fruit juices and derived products and 25 μg/kg for solid apple products. The maximum level allowed for apple products intended for infants and young children was set at 10 μg/kg (European C, 2003, 2006).
The understanding of P. expansum physiology under controlled experimental conditions may help forecast its behavior in natural conditions and predict its potential risks on the fruit sector and consumer health. In the last decades, predictive microbiology has emerged to be a useful tool in food industry used to predict the behavior of microorganisms through the development of several mathematical models capable of describing the responses of these pathogenic organisms to particular environmental conditions (Ross and McMeekin 1994; Fakruddin et al. 2011). Although it was more commonly used to control the bacterial growth (Gibson et al. 1988; Baranyi and Roberts 1994; Gaillard et al. 1998; Juneja et al. 2007), the situation has changed and this tool was lately employed in the modeling of fungal growth as well. The fungal proliferation and mycotoxin synthesis in foodstuffs are subject to multiple physicochemical parameters. The water activity (aW), and the temperature adopted during the storage period deemed as the most imperative ones (Holmquist et al. 1983; Dantigny et al. 2005; Bryden 2007). Likewise, other intrinsic factors, particularly the pH of the product, can largely affect the mold development (Rousk et al. 2009). The combination of these physico-chemical parameters along with the usage of modeling techniques might be helpful to control the fungal growth and subsequently the biosynthesis of mycotoxins.
A growing number of studies are available in the lit-erature dealing with the predictive modeling approach of fungi (Valık et al. 1999; Panagou et al. 2003; Parra and Magan 2004; Tassou et al. 2007; Garcia et al. 2011). For
P. expansum in particular, few studies have been conducted
to characterize the growth and the toxigenesis conditions of this species despite its large implication in foodstuff contamination. The growth rate of P. expansum has been studied as function of the storage temperature, the aW and the oxygen levels (Lahlali et al. 2005; Marín et al. 2006; Baert et al. 2007a; Judet- Correia et al. 2010).Moreover, its patulin production capacity has been independently assessed as a function of temperature, pH, and fruit varie-ties (Morales et al. 2008; Salomao et al. 2009). All these studies lack sufficient information about the simultaneous effects of such parameters on P. expansum growth and its patulin production capability. In this regard, it is worth mentioning that the most suitable conditions for the fungal growth may not be the optimal conditions for mycotoxin production, thus it is not possible to predict the latter
from the kinetic growth data. Moreover, the interactive effects of different sets of abiotic factors cannot be pre-dicted by such types of studies.
With these perspectives, this study was undertaken to firstly determine in vitro the individual effects of three major physicochemical parameters; the temperature, pH, and aW on both the growth and patulin production by the blue- rot ascomycetous fungus, P. expansum. These data were subsequently invested in the development of a mathematical model which enables accurate prediction of optimal and marginal conditions for P. expansum growth.
Experimental
Fungal isolate
This study was carried out on one strain of P. expansum, initially isolated from grapes in the Languedoc Roussillon region of France. The strain was previously characterized by DNA sequencing of the ITS gene region and deposited in ARS collection (USDA, Peoria, IL) as NRRL 35695. The strain was formerly confirmed as a patulin- producer (Tannous et al. 2014).
Experimental setup
Inoculum preparation
The investigated strain was subcultured on Potato Dextrose Agar (PDA) medium (Biolife, Milano, Italy) and incubated at 25°C to obtain a heavily sporulating culture. The conidial suspension was prepared by washing the surface of the fresh, mature (7- day- old colony) culture with 10 mL of sterile distilled water amended with Tween 80 (0.05%, v:v) and by gently rubbing with a sterile loop. The spores’ concentration was reckoned by microscopy using a Neubauer counting chamber, and then adjusted to 105
spores/μL.
Growth media and incubation conditions
All the assays were conducted on the synthetic Czapek Glucose agar medium in order to minimize other sources of variation that could be encountered on natural media and to identify clearly the effects of temperature, pH, and aW. This medium has already been proven to be a favorable substrate for P. expansum growth and patulin production (data not shown).
The overall assayed conditions were five temperatures, three pH levels, and four aW values. Six separate replicate Petri plates were used for each temperature, aW, and pH value, three of which were overlaid with sterilized cel-lophane disks to ensure a good separation between myce-lium and agar. This will allow an accurate estimation of
the mycelial mass and the amount of patulin produced on agar medium (Reeslev and Kjoller 1995; Tannous et al. 2014).
In all the experimental conditions, media were centrally inoculated with 106 spores from the spore suspension.
For temperature investigations, the synthetic Czapek glu-cose agar medium was prepared based on the formulation reported by Puel et al. (2005). The inoculated Petri plates were incubated at 30, 25, 16, 8, and 4°C in high preci-sion (±0.1°C) for 2 weeks.
The synthetic Czapek glucose agar medium was also used for assessing the effect of aW on the growth and patulin production by P. expansum. The unmodified medium (aW 0.99) was adjusted to aW levels of 0.95, 0.90, and 0.85 by adding increasing amounts of glycerol. Water activities were subsequently determined with the HygroLab 2 water activity indicator (Rotronic, Hauppauge, NY). Petri plates of the same aW value were separately enclosed in polyethylene bags to prevent water loss. The inoculated Petri plates were incubated at 25°C for 2 weeks.
The pH surveys were also conducted on Czapek glucose agar incubated at a constant temperature of 25°C for only 7 days. The pH of the medium was adjusted to 2.5, 4, and 7 using two buffer solutions (Citric acid (0.5 mol/L): Potassium Hydrogen Phosphate (0.5 mol/L)) in the respec-tive combinations 49 mL: 2 mL, 30.725 mL: 38.55 mL, and 8.825 mL: 82.35 mL, for a total volume of 250 mL of medium. These pH values were chosen as they cover the pH range found in different eating- apple and cider apple varieties. The final pH of the medium was verified using a pH- meter with special probe for alimentary articles by Hanna instruments (Tanneries, France).
Growth and lag phase assessment
After inoculation, agar plates, harvested without cellophane disks, were checked on a daily basis to perceive if visible growth had started. As soon as a visible growth has begun,
P. expansum growth was monitored by diameter
measure-ments along two perpendicular directions, at regular time intervals. The lag phase (time required for growth) was evaluated and the radial growth rate (cm/day) was obtained from linear regression slopes of the temporal growth curves. Measurements were carried for an overall period of 14 days for the temperature and aW surveys and 7 days only for the pH surveys.
Fungal growth was also evaluated with regard to biomass (mg dry weight). After the appropriate incubation period, the mycelia developed on the surface of agar plates topped with cellophane disks were scratched with a scalpel, col-lected, and dried at 80°C until a constant weight, cor-responding to the dry biomass weight, was obtained.
Patulin extraction and HPLC analysis
After the appropriate incubation period (7 days for the pH assays and 14 days for the temperature and aW assays), the agar medium was scraped off the Petri dishes overlaid with sterile cellophane, cut into strips, mixed with 50 mL of ethyl acetate (Sigma- Aldrich, Saint- Quentin Fallavier, France) and macerated with agitation (250 rpm) at room temperature on an orbital shaker (Ningbo Hinotek Technology, Zhejiang, China). The contact time was 2 days. The organic phase was then filtered through Whatman Grade 413 filter paper (Merck, Darmstadt, Germany) and evaporated to dryness under liquid nitrogen. The dried residue was dissolved in 2 mL of methanol and then filtered through a 0.45 μm syringe filter (Navigator, Huayuan Tianjin, China) into a clean 2 mL vial. One hundred microliter aliquots of these extracts were injected onto the Waters Alliance HPLC system (Saint- Quentin- en- Yvelines, France) for the quantitative determination of the patulin concentration. The patulin was detected with a Waters 2998 Photodiode Array Detector, using a 25 cm × 4.6 mm Supelco 5 μm Discovery C18 HPLC Column (Sigma- Aldrich) at a flow rate of 1 mL/min. A gradient program was used with water (Eluent A) and acetonitrile HPLC grade (eluent B) and the following elu-tion condielu-tions: 0 min 5% B, 16 min 2% B, 20 min 60% B, 32 min 5% B. The presence of patulin was moni-tored at a 277 nm wavelength. A calibration curve was constructed with patulin standard (Sigma- Aldrich) at concentrations ranging from 0.05 to 10 μg/mL. Accordingly, the patulin concentrations were determined and results were expressed in ppm. The LOD and LOQ of the method were calculated using the slope (S) of the calibration curve, obtained from linearity assessment, and the standard devia-tion of the response (SD). These values were determined as follows: LOD = 3.3 × SD/S, LOQ = 10 × SD/S. Model development
Growth rate experimental data were implemented in a home developed C++ language program that is able to interpolate between various points in different or multiple dimensions. Effects of the different parameters (tempera-ture, pH, and aW) on the P. expansum growth rate were taken into account according to the experimental points already obtained. Thus, the effect of each of these param-eters was considered on its own calculating the growth ratio factor effect obtained from the experimental data. The program proceeds as a simultaneous interpolator between the different data points and the effect ratios of each parameter on the growth rate. Therefore, the program allows us to estimate the growth rates (expressed in cm/ day) for fixed temperature, aW, and pH values depending
on the variations defined by the input data. The model took into account the latency phase versus the tempera-ture, which was modeled by a 4th degree polynomial
equation:
(1) where T is the temperature parameter expressed in Degree Celsius (°C).
Likewise, the latency versus the aW was taken into account to fit the following power equation:
(2) where aw represents the water activity of the medium.
In the both latency phase fits, the correlation parameter
R2 was higher than 0.97 showing a good accuracy of the
fitting procedure.
The P. expansum diameter growth (cm) versus time should theoretically follow a linear regression while con-sidering the variation in each of the temperature, aW, and pH parameters. Therefore, a Pearson chi- squared test was performed confirming that our hypothesis is true for over 99.9%. Thus, the slope and the intercept dependen-cies on each of the previously mentioned parameters were calculated according to the available experimental points.
Growth slope and intercept dependencies on temperature were fit into the following 4th degree polynomial
equations:
(3)
(4) The growth slope and intercept dependencies on aW were fit into the following equations:
(5)
(6) And the growth slope dependency on pH was fit into the following equation, considering the value for intercept as null:
(7) All slope and intercept fits were convergent to more than 99% with the experimental points.
In order to analyze the simultaneous effect of the dif-ferent parameters, growth rate values were calculated for an aW level of 0.99 and a pH of 4 (reference values) using the temperature’s formula given by equations (3) and (4). Using these equations the growth rate (cm/day)
can be calculated for different temperature values. Using the same method of proceeding we can use equations (5) and (6) to calculate the effect of the aW on the growth rate and the equation (7) to analyze the effect of the pH. If two or more parameters are to be changed at the same time, the temperature effect is taken into account first, and then the obtained growth rate is further modi-fied by the second parameter effect. The modification is a simple ratio factor that is applied to the growth rate following temperature change. Therefore, the effects of the aW and the pH were implemented as a diameter ratio factor. Each factor was calculated by dividing the diameter obtained for a desired parameter value by that obtained for the experimental values that we considered as a reference.
Finally, a routine test of the different values combina-tions of pH, T, and aW was carried out in order to retrieve the highest growth rate and its relative optimal parameters to obtain such a result.
Validation of the predictive model in vivo In order to assess the validity of the predictive model in natural conditions, three apple varieties (Golden Delicious, Granny Smith, and Royal Gala) with different initial pH values (Table 1) were used. As previously described by Sanzani et al. (2012), apples were surface- sterilized using a 2% sodium hypochlorite solution and rinsed with water. Apples were then injured using a sterile toothpick to a depth of approximately 0.5 cm, and the wounded sites were inoculated with a 10 μL droplet of the P. expansum conidial suspension at a concentration of 105 conidia/μL.
The infected apples were then incubated for 2 weeks under three different temperatures (4°C, 25°C, and 30°C). The set of experimental conditions used to check the predic-tive capability of the model are given in Table 1. Duplicate analyses were performed on each set of conditions.
The diameters of the rotten spots were measured daily and the experimental growth rates were estimated. To
Latency(days) =5.10−5
T4−0.0039T3+0.1126T2
−1.8349T + 11.613
Latency (days) = 0.9046a−12.98
w Slope(cm/day) = − 3.10−5 T4+ 0.0015T3− 0.0291T2 +0.2402T − 0.368 Intercept (cm) =10−5 T4− 0.0006T3+ 0.006T2 +0.0536T − 0.8269
Slope (cm/day) = 5.2634aw−4.46936
Intercept (cm) =3.94927.102a3 w−1.014943.10 3a2 w +8.61994.102a w−2.41545.10 2 Slope (cm/day) = 0.0578pH2 +0.584pH − 0.5947
Table 1. Validation set of conditions of the predictive model for
Penicillium expansum growth and patulin production.
Apple variety Temperature (°C) Water activity pH
Golden Delicious 4 0.98 3.5–3.6 25 0.98 3.5–3.6 30 0.98 3.5–3.6 Granny Smith 4 0.98 3.1–3.2 25 0.98 3.1–3.2 30 0.98 3.1–3.2 Royal Gala 4 0.99 4.1–4.2 25 0.99 4.1–4.2 30 0.99 4.1–4.2
evaluate the performances of the developed model, the observed and predicted values were compared by plotting predicted growth rates against the experimental values. Statistical analysis
All values are stated as mean ± SEM unless otherwise indicated. For statistical analysis, the one- way analysis of variance (ANOVA) was used (*P < 0.05; **P < 0.01; ***P < 0.001).
Results and Discussion
Studies on the growth and patulin
production by P. expansum under different conditions
Colony diameters were measured on a daily basis and plotted against time. For all the tested conditions, the growth curves based on colony diameters were typical of a linear fungal growth after a short lag period ranged from 1 to 7 days (Baert et al. 2007a). However, it is worth mentioning that the fungal growth was in some cases limited by the Petri plates’ dimension. In such cases, growth curves lose their linear appearance just after reach-ing the limitreach-ing diameter value (~7 cm) (Figs. 1A, 3A). Under each culture condition, the patulin content was quantified by HPLC and expressed in ppm.
Temperature effect
Since in many cases, apples and other fruits are stored in refrigerators (at 4°C) or in plastic barrels outdoors where temperatures of 25–30°C are very common, the temperature analysis were performed within a 4 to 30°C range. The investigated strain of P. expansum was able to grow in the temperature range studied at unmodified
aW and pH (Fig. 1A). Interestingly, the strain displayed a different colonial morphology under the five tested temperatures. At 8°C and 16°C, green colony with white margins and yellow to cream reverse side was observed, whereas at 25°C, the fungus showed green conidia with dull- brown color on reverse. An unusual morphology of the fungus was perceived at 30°C; the colonies grew verti-cally and stayed smaller than 3 cm, with serrated edges (Fig. 2). These morphological changes noticed following the incubation under various temperatures have been linked to stress response in other filamentous fungi (Verant et al. 2012).
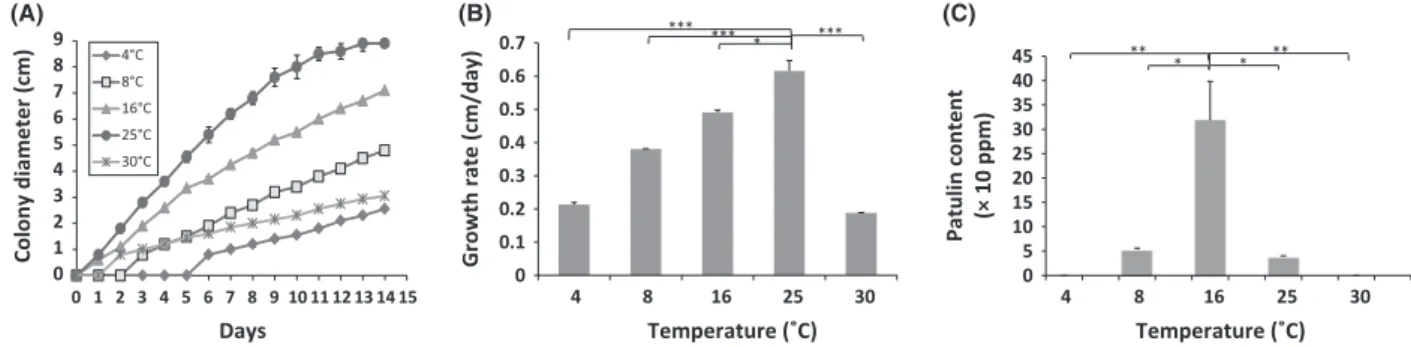
The optimal temperature for the growth of this strain of P. expansum was around 25°C, at which the fungus exhibited the shortest lag phase and the most important colony growth (8.9 cm), at the end of the incubation period (Fig. 1A). This observation is in accordance with the literature data that describes also an optimum growth temperature for this species near 25°C (Pitt et al. 1991; Lahlali et al. 2005; Baert et al. 2007a; Pitt and Hocking 2009). Lag phases prior to growth increased when tem-perature varied from optimum to marginal conditions; a lag phase of 6 and 3 days was noticed at the lowest temperatures of 4°C and 8°C, respectively, besides a 2- day- latency period perceived at the highest studied tem-perature (30°C) (Fig. 1A). This result supports the predic-tion of Baert et al. (2007a) that cold storage does not prevent the fruit deterioration by P. expansum, but just delays it.
The colony growth rates were calculated as the slope of the linear segment of each growth curve. The growth rate of P. expansum as a function of temperature appears to have a bell- shaped distribution with an optimum at 25°C and an experimentally determined value of 0.67 cm per day (Fig. 1B). The growth features of P. expansum were also evaluated in terms of fungal biomass develop-ment. The highest mycelia dry weight of 160 ± 15 mg
Figure 1. Growth curves (A), radial growth rates (cm/day) (B), and patulin production (ppm) of Penicillium expansum NRRL 35695 on Czapek glucose
agar medium under different temperatures. Five different temperatures were tested (4°C, 8°C, 16°C, 25°C, and 30°C) with pH and aW values fixed to 5.2 and 0.99, respectively. The results shown are the mean of three technical replicates for each condition. The standard errors of the mean (SEM) are represented by error bars: *P < 0.05; **P < 0.01; ***P < 0.001.
0 1 2 3 4 5 6 7 8 9 0 1 2 3 4 5 6 7 8 9 10 11 12 13 14 15 4°C 8°C 16°C 25°C 30°C Days Colony diameter (cm) (A) 0 0.1 0.2 0.3 0.4 0.5 0.6 0.7 4 8 16 25 30 Temperature (˚C)
Growth rate (cm/day)
(B) (C) 0 5 10 15 20 25 30 35 40 45 4 8 16 25 30 Patulin conten t (× 10 ppm ) Temperature (˚C) *** * *** *** * ** ** *
per 20 mL of Czapek glucose medium was obtained at 25°C, followed by 16°C (130 ± 0 mg), 30°C (120 ± 10 mg) and 8°C (60 ± 10 mg). The lowest mycelia dry weight of 10 ± 0 mg was perceived at 4°C.
Patulin was identified by its retention time (9 min) and its UV spectra according to an authentical standard and quantified by measuring peak area according to the constructed standard curve of 0.919% coefficient of vari-ation. The values of limit of detection (LOD) and limit of quantification (LOQ) for patulin were 0.04 μg/mL and 0.1 μg/mL, respectively. The patulin production by
P. expansum exhibited also a marked temperature-
dependent variability. The histogram of patulin production versus temperature seen in Figure 1C has a characteristic bell shape. The highest patulin concentrations were attained at 16°C. However, a further increase in temperature to 25°C and 30°C caused a decrease in patulin production.
These data matched a previous study of Paster et al. (1995) that compared patulin production on apples kept at vari-ous storage temperatures of 0, 3, 6, 17, and 25°C. In this study, the highest patulin concentration was found at 17°C. Our results are also in perfect agreement with those of Baert et al. (2007b) that showed a higher patulin pro-duction at low temperatures. However, they contradict many other studies that have reported a stimulation of the patulin production by this fungus by increasing the temperature (McCallum et al. 2002; Salomao et al. 2009). These results proved that temperature plays a role in patulin accumulation but not in a determinant way, other extrinsic and intrinsic factors appear to interact.
A comparison of the obtained bell- shaped dependencies of the P. expansum growth rates and patulin levels as a function of temperature (Fig. 1B and C) revealed that the temperature ranges required to produce patulin were
Figure 2. The colony appearance (surface and reverse) of Penicillium expansum isolate NRRL 35695 after 14 days of growth on Czapek glucose agar
media under a wide range of temperatures.
T = 8°C T = 4°C
T = 16°C T = 25°C
different and more restrictive than those for growth. Similar results have been reported for other fungal species. The
Fusarium molds associated with the production of
tri-chothecene (T- 2 and HT- 2 toxins) have been reported to grow prolifically at temperatures ranging between 25 and 30°C with a low production of mycotoxins. However, high levels of mycotoxins were produced at low tempera-tures (10 to 15°C), associated with a reduced fungal growth (Nazari et al. 2014). Similarly, the optimal temperature for Fumonisin B1 production was lower than the optimal temperature for the growth of Fusarium verticillioides and
Fusarium proliferatum (Marin et al. 1999). Another example
of a narrower range of temperatures for toxin production when compared with fungal growth is shown by the accumulation of ochratoxin in barley by Penicillium
ver-rucosum. The growth of this species was conceivable at
temperatures fluctuating between 0°C and 31°C, whereas the ochratoxin A production was only detected in the temperature range 12–24°C (Northolt et al. 1979).
Effect of water activity
The aW of fresh fruits falls in the range 0.97–0.99. Though that patulin was also detected in dried fruits (Karaca and Nas 2006; Katerere et al. 2008) with aW values less than 0.90, analyses were carried out over an aW range 0.85–0.99. The Figure 3A shows the mean diameters of P. expansum, measured at different controlled aW, along culturing time. This species displayed an optimum growth at the highest
aW of 0.99, with the shortest lag phase and the most important colony growth (8.3 cm) after incubation period. For this highest value of aW, the fungus recorded the highest growth rate (0.6 cm per day). A drastic decrease in the P. expansum growth rate was observed by lowering the aW from 0.99 to 0.85, using glycerol as humectant (Fig. 3B). The P. expansum isolate displays a different mycelial mass production in the Czapek glucose medium with modified aW. After 14 days, the highest production
of fungal dry mass was obtained at the aW of 0.95 (400 ± 50 mg dry weight per 20 mL of medium), fol-lowed by 0.99 (201 ± 10 mg) and 0.90 (105 ± 15 mg). A weak mycelium growth (1.1 ± 0 mg fungal dry weight) was reported at the minimal aW tested. In literature, the minimal aW for the germination of this species ranges between 0.83 (Mislivec and Tuite 1970) and 0.85 (Judet- Correia et al. 2010), depending on the strain. As it can be observed, the mycelial dry weight estimated at the 0.95 aW is approximately twice the value found at 0.99
aW. However, the fresh mycelial weight was significantly greater at the highest aW value (data not shown).
The patulin production was also significantly affected by the water availability in the medium. No patulin was produced at an aW of 0.85 throughout the incubation period. On the other hand, traces of patulin were detected after 14 days of culture, when the fungus was grown at the two aW values of 0.90 and 0.95. A significant increase in the patulin production by P. expansum was perceived at the aW of 0.99 (Fig. 3C). These findings on the impact of aW on the patulin production by P. expansum are consistent with the two ancient studies reporting that the minimal aW that allows patulin production by this fungus is of 0.95 (Lindroth et al. 1978; Patterson and Damoglou 1986).
As previously outlined for the temperature analysis, the
aW conditions that promote patulin production were also more restrictive than those allowing growth. Although there were no significant differences in terms of P.
expan-sum growth at both water activities 0.95 and 0.99, the
patulin production was significantly stimulated at 0.99, whereas only traces of patulin were detected at 0.95 (Fig. 3B and C).
Effect of pH
As several previous studies have reported a decrease in the pH of the medium during P. expansum growth, the
Figure 3. Growth curves (A), radial growth rates (cm/day) (B), and patulin production (ppm) of Penicillium expansum NRRL 35695 on Czapek glucose
agar medium under modified water activity. Four different water activities were tested (0.85, 0.90, 0.95, and 0.99) with pH and temperature values fixed to 5.2°C and 25°C, respectively. The results shown are the mean of three technical replicates for each condition. The standard errors of the mean (SEM) are represented by error bars: *P < 0.05; **P < 0.01; ***P < 0.001.
0 1 2 3 4 5 6 7 8 9 0 1 2 3 4 5 6 7 8 9 10 11 12 13 14 15 aw 0.85 aw 0.90 aw 0.95 aw 0.99 0 2 4 6 8 10 12 14 16 18 20 0.85 0.9 0.95 0.99 *** ** ** Patulin content (ppm ) aW aW (C) (A) (B) Days Colony diameter (cm) 0 0.2 0.4 0.6 0.8 1 0.85 0.9 0.95 0.99
Growth rate (cm/day)
** ***
pH assays were conducted on an overall incubation period of 7 days, in order to reduce pH fluctuations. This pH decrease is due to organic acids (gluconic acid) produc-tion, that lower the pH to values in which patulin is more stable (Baert et al. 2007b; Morales et al. 2008; Barad et al. 2013). In our study, the pH of the medium was recorded at the end of the experiment. The initial pH 7 slightly decreased to 6 along 7 days experiment; however, the two pH 2.5 and 4 were maintained constant at the initial value throughout the incubation period. The ability to change the ambient pH in order to generate a more suitable growing environment has been described for other fungal species and was shown to occur in either direction. Some necrotrophic species like Alternaria alternata (Eshel et al. 2002) or Colletotrichum gloeosporioides (Kramer- Haimovich et al. 2006) can alkalize the host tissue by secreting ammonium, whereas other species can acidify the medium by secreting organic acids, like oxalic acid in the case of Botrytis cinerea (Manteau et al. 2003).
Under the different pH tested in our study, the lag phase periods were estimated to 1 day of culture from the linear regression curves for colony radius plotted versus time (Fig. 4A). It was also found that the growth rate of P. expansum as a function of pH is bell- shaped with a maximum estimated value of 0.9 cm per day at pH 4 (Fig. 4B). Regarding, the mycelium dry weights, there were no significant differences between the three tested pH levels. Similarly, Morales et al. (2008) found that the
P. expansum growth, estimated in terms of fungal biomass,
was unaffected by the fruit juice initial pH.
The pH of the medium showed a significant effect on the ability of this fungus to produce patulin. The lowest patulin production was reported at pH 2.5, whereas the highest patulin level was detected at pH 4. The patulin- producing capacity of P. expansum decreased when the pH of the medium increased from 4 to 7 (Fig. 4C). These results are comparable with those presented in previous
studies. Damoglou and Campbell (1986) have previously reported that the pH range 2.8–3.2 resulted in less patulin accumulation by P. expansum compared to the pH range 3.4–3.8. While assessing the patulin accumulation in both apple and pear juices at different pH, Morales et al. (2008) have also observed an increase in patulin production by raising the pH from 2.5 to 3.5. The small amounts of patulin found at pH 2.5 are most probably due to a low production rather than to low stability of patulin. In the study of Drusch et al. (2007), the patulin stability was assessed over a wide pH range. Data from this study indicate that patulin is highly stable in the range pH 2.5–5.5. However, a greater decrease in the patulin con-centration to 36% of the initial concon-centration was observed at neutral pH (Drusch et al. 2007).
Mathematical modeling of P. expansum growth
The growth data modeled in this work comprised the latency phase and the growth curves of P. expansum strain NRRL 3565 at five temperatures, four aW, and three pH. Mycelial extension of colonies against time was almost invariable showing a straight line, after an initial lag period. The growth rates expressed in cm per day were calculated as the slope of the regression curves. The growth rates recorded under the different conditions (data presented above) were used as inputs to calculate the design param-eters of equations (3–7).
The presented calculation approach has undergone a first mathematical validation, confirming that the dif-ferences between the theoretical values predicted by the model and the data obtained under the conditions used to build the model are not significant. The Figure 5 shows the effects of temperature, aW and pH on growth rate (expressed in cm/day) obtained using the approach described in this study. The surfaces generated by the
Figure 4. Growth curves (A), radial growth rates (cm/day) (B), and patulin production (ppm) of Penicillium expansum NRRL 35695 on Czapek glucose
agar medium under modified pH. Three different pH values were tested (2.5, 4, and 7) with temperature and aW values fixed to 25°C and 0.99, respectively. The results shown are the mean of three technical replicates for each condition. The standard errors of the mean (SEM) are represented by error bars: *P < 0.05; **P < 0.01; ***P < 0.001. 0 1 2 3 4 5 6 7 0 2 4 6 8 pH2.5 pH4 pH7 (A) (B) (C) Days Colony diameter (cm) 0 0.1 0.2 0.3 0.4 0.5 0.6 0.7 0.8 0.91 2.5 4 7
Growth rate (cm/day)
pH ** ** 0 50 100 150 200 250 300 350 400 2.5 4 7 ** ** Patulin content (×10 ppm ) pH
model data summarizes all the growth rate values pre-dicted under combined temperature and aW (at a fixed pH 4), combined pH and temperature (at a fixed aW of 0.99), and combined pH and aW (at a fixed tem-perature of 25°C). The fixed values are those for which the effect of the other combination of factors on P.
expan-sum growth is visualized the best. The model predicts
that the optimal conditions for P. expansum growth were a temperature of 24°C, an aW value of 0.99, and a pH value of 5.1. The predicted growth rate at optimal con-ditions was 0.92 cm/day. The minimal concon-ditions for
P. expansum growth as predicted by the model were a
temperature of 3°C, an aW value of 0.85, and a pH value of 2. Under these combined set of conditions, a slowdown of growth to almost zero level is predicted by the model.
The experimental validation of the P. expansum growth model was carried out on apples. The objective was to test whether the performance of the predictive model may be low in a realistic situation or not. This validation led to acceptable results under most of the conditions. The growth of the fungus on apples was in general slower than predicted by the model (Fig. 6). However, using the Pearson product- moment correlation coefficient, a value of 0.96 was found between the experimental and predicted growth rate values. The difference between the predicted and observed growth rates on apple is most probably due to the apple itself, which might be a stress factor for the fungus. Such stress factors include the intact tissue structure of the apple, which must be degraded in order to enable mold development to occur and which causes a reduced O2 availability within the fruit. A similar result
Figure 5. Three- dimensional response surfaces showing the expected growth rates (cm/day) determined by the developed model as a function
between temperature and aW (A), temperature and pH (B), and pH and aW (C). The graph A correspond to a fixed pH value of 4, the graph B to a fixed aW value of 0.99 and the graph C to a fixed temperature of 25°C.
Figure 6. Comparison of the predicted and the observed Penicillium expansum growth responses on apples. The experimental growth rate values are
shown in histograms ( ), whereas the predicted values are represented by black triangles (▲). The experimental growth rate values are the average of two replicates for each condition with the standard deviations shown as error bars.
0 0.1 0.2 0.3 0.4 0.5 0.6 0.7 0.8 7˚C 25˚C 30˚C
Growth rate (cm/day
) Golden Delicious 0 0.1 0.2 0.3 0.4 0.5 0.6 0.7 7˚C 25˚C 30˚C
Growth rate (cm/day
) Granny Smith 0 0.1 0.2 0.3 0.4 0.5 0.6 0.7 0.8 0.9 7˚C 25˚C 30˚C
Growth rate (cm/day)
Royal Gala
(A) (B)
was observed in a previous study investigating the effect of temperature on P. expansum growth in both Apple Puree Agar Medium (APAM) and apples (Baert et al. 2007a). Our results obtained from in vivo experiments indicate that the employment of the developed modeling approach, to assess the combined effect of temperature,
aW and pH on the growth responses of P. expansum could be satisfactory. However, the risk in using the described model in real situations may lie in the difference in the initial inoculum size and the unrealistic constant condi-tions of temperature and moisture content.
A review of the literature reveals that certain mathemati-cal models were developed to describe and predict the
P. expansum growth under different environmental
condi-tions. The combined effects of temperature and aW on the growth rate of P. expansum were previously studied and modeled by Lahlali et al. (2005) on PDA medium. In their study, the data obtained with both sorbitol and glycerol as humectant were modeled by means of the quadratic polynomial model. In agreement with our find-ings, it was shown that P. expansum grows best at tem-peratures ranging from 15 to 25°C and at an aw ranging from 0.960 to 0.980. The growth rate and the lag time for six P. expansum strains were modeled as a function of temperature by Baert et al. (2007a) on APAM. In accordance with our results, the optimal temperature for growth varied between 24°C and 27°C depending on the strain. A similar modeling study was later conducted on both malt extract agar (with a pH value of 4.2 and an
aW of 0.997) and on simulating yogurt medium (Gougouli and Koutsoumanis 2010), where a Cardinal Model with Inflection (CMI) was used. The optimal temperature for
P. expansum growth was determined as 22.08°C, which
was close to that predicted by our model. Moreover, the predicted growth rate (0.221 mm/h, the equivalent of 0.55 cm/day), was lower than that expected in our study. Another predictive study was conducted by Judet- Correia et al. (2010) using the Cardinal Model with Inflection. The objective of the latter was to develop and validate a model for predicting the combined effect of temperature and aW on the radial growth rate of P. expansum on PDA medium. The optimal conditions estimated by this study on Potato Dextrose were 23.9°C for temperature and 0.981 for aW. These estimated values are close to those predicted in the present work. However, the optimal growth rate expected was remarkably lower. This difficulty in comparing the growth rates is obviously due to the fact that the isolates in the study of Judet- Correia et al. (2010) were grown on PDA, whose composition differs from that of Czapek glucose agar.
The importance of this study resides in the fact that it takes into account the three key growth factors (Temperature, aW and pH) unlike the previously conducted
studies that did not consider more than two exogenous factors. It is also worth mentioning that the effect of the latter factor on P. expansum growth has never been mod-eled before. In addition to its growth modeling approach, this study considers the distinction between the favorable conditions for growth and those for toxigenesis of
P. expansum.
It remains to note that this predictive model is built up based on the data on one P. expansum strain (NRRL 35695). As previously reported by McCallum et al. (2002),
P. expansum isolates exhibit different growth rates. In
this regard, it will be interesting to evaluate the ability of this model to extrapolate to other strains within the same species. Ultimately, the extent to which the model can be applied to other inoculum sizes, other growth media and fluctuating temperatures is to be determined in future validation studies for extrapolation.
Conclusion
The findings in this study provide a considerable insight and a very interesting and informative comparison of the growth rate and patulin production of P. expansum regard-ing three eco- physiological factors mainly involved in the proliferation of pathogenic fungi.
In the present work, a predictive model was also devel-oped as a tool to be used for the interpretation of
P. expansum growth rate data. Within the experimental
limits of temperature, pH and aW, this model was able to predict the colony radial growth rates (cm/day) along a wide combination of culture conditions. Furthermore, the validation showed that the model can predict the growth of P. expansum under natural conditions on apples, with an acceptable accuracy. To conclude, the developed mathematical model for predicting the P. expansum growth on a laboratory scale can be used as a tool to assess the risk of P. expansum in fruit juices industry by predicting conditions over which the P. expansum growth in food matrices might be a problem.
Acknowledgments
The authors express their gratitude to C. Afif from the Department of Chemistry at Saint Joseph’s University for his kind cooperation in achieving the HPLC analyses. The research work was financially supported by the National Council for Scientific Research (CNRS), Lebanon and the Research Council of Saint- Joseph University (Lebanon).
Conflict of Interest
References
Andersen, B., J. Smedsgaard, and J. C. Frisvad. 2004.
Penicillium expansum: consistent production of patulin,
chaetoglobosins, and other secondary metabolites in culture and their natural occurrence in fruit products. J. Agric. Food Chem. 52:2421–2428.
Baert, K., A. Valero, B. De Meulenaer, S. Samapundo, M. M. Ahmed, L. Bo, et al. 2007a. Modeling the effect of temperature on the growth rate and lag phase of
Penicillium expansum in apples. Int. J. Food Microbiol.
118:139–150.
Baert, K., F. Devlieghere, H. Flyps, M. Oosterlinck, M. M. Ahmed, A. Rajković, et al. 2007b. Influence of storage conditions of apples on growth and patulin production by Penicillium expansum. Int. J. Food Microbiol. 119:170–181.
Barad, S., S. B. Horowitz, I. Kobiler, A. Sherman, and D. Prusky. 2013. Accumulation of the mycotoxin patulin in the presence of gluconic acid contributes to pathogenicity of Penicillium expansum. Mol. Plant Microbe Interact. 27:66–77.
Baranyi, J., and T. A. Roberts. 1994. A dynamic approach to predicting bacterial growth in food. Int. J. Food Microbiol. 23:277–294.
Binder, E. M., L. M. Tan, L. J. Chin, J. Handl, and J. Richard. 2007. Worldwide occurrence of mycotoxins in commodities, feeds and feed ingredients. Anim. Feed Sci. Technol. 137:265–282.
Bryden, W. L. 2007. Mycotoxins in the food chain: human health implications. Asia Pac. J. Clin. Nutr. 16:95–101. Damoglou, A. P., and D. S. Campbell. 1986. The effect of
pH on the production of patulin in apple juice. Lett. Appl. Microbiol. 2:9–11.
Dantigny, P., A. Guilmart, and M. Bensoussan. 2005. Basis of predictive mycology. Int. J. Food Microbiol.
100:187–196.
Drusch, S., S. Kopka, and J. Kaeding. 2007. Stability of patulin in a juice- like aqueous model system in the presence of ascorbic acid. Food Chem. 100:192–197. Eshel, D., I. Miyara, T. Ailing, A. Dinoor, and D. Prusky.
2002. pH regulates endoglucanase expression and virulence of Alternaria alternata in persimmon fruit. Mol. Plant Microbe Interact. 15:774–779.
European C. 2003. Commission regulation (EC) No 1425/2003 of 11 August 2003 amending regulation (EC) No 466/2001 as regards patulin. Off. J. Eur. Union L 203:1–3.
European C. 2006. Commission Regulation (EC) No 1881/2006 of 19 December 2006 setting maximum levels for certain contaminants in foodstuffs. Off. J. Eur. Union L 364:5–24.
Fakruddin, M., R. M. Mazumdar, and K. S. B. Mannan. 2011. Predictive microbiology: modeling microbial responses in food. Ceylon J. Sci. Biol. Sci. 40:121–131.
Gaillard, S., I. Leguérinel, and P. Mafart. 1998. Model for combined effects of temperature, pH and water activity on thermal inactivation of Bacillus cereus spores. J. Food Sci. 63:887–889.
Garcia, D., A. J. Ramos, V. Sanchis, and S. Marín. 2011. Modelling the effect of temperature and water activity in the growth boundaries of Aspergillus ochraceus and
Aspergillus parasiticus. Food Microbiol. 28:406–417.
Gibson, A. M., N. Bratchell, and T. A. Roberts. 1988. Predicting microbial growth: growth responses of
Salmonellae in a laboratory medium as affected by pH,
sodium chloride and storage temperature. Int. J. Food Microbiol. 6:155–178.
Gougouli, M., and K. P. Koutsoumanis. 2010. Modelling growth of Penicillium expansum and Aspergillus niger at constant and fluctuating temperature conditions. Int. J. Food Microbiol. 140:254–262.
Holmquist, G. U., H. W. Walker, and H. M. Stahr. 1983. Influence of temperature, pH, water activity and antifungal agents on growth of Aspergillus flavus and
A. parasiticus. J. Food Sci. 48:778–782.
Judet-Correia, D., S. Bollaert, A. Duquenne, C. Charpentier, M. Bensoussan, and P. Dantigny. 2010. Validation of a predictive model for the growth of Botrytis cinerea and
Penicillium expansum on grape berries. Int. J. Food
Microbiol. 142:106–113.
Juneja, V. K., M. Valenzuela Melendres, L. Huang, V. Gumudavelli, J. Subbiah, and H. Thippareddi. 2007. Modeling the effect of temperature on growth of
Salmonella in chicken. Food Microbiol. 24:328–335.
Karaca, H., and S. Nas. 2006. Aflatoxins, patulin and ergosterol contents of dried figs in Turkey. Food Addit. Contam. 23:502–508.
Katerere, D. R., S. Stockenström, and G. S. Shephard. 2008. HPLC- DAD method for the determination of patulin in dried apple rings. Food Control 19:389–392.
Kramer-Haimovich, H., E. Servi, T. Katan, J. Rollins, Y. Okon, and D. Prusky. 2006. Effect of ammonia production by Colletotrichum gloeosporioides on pelB activation, pectate lyase secretion, and fruit pathogenicity. Appl. Environ. Microbiol. 72:1034–1039.
Lahlali, R., M. N. Serrhini, and M. H. Jijakli. 2005. Studying and modelling the combined effect of temperature and water activity on the growth rate of
P. expansum. Int. J. Food Microbiol. 103:315–322.
Lindroth, S., A. Niskanen, and O. Pensala. 1978. Patulin production during storage of blackcurrant, blueberry and strawberry jams inoculated with Penicillium expansum mould. J. Food Sci. 43:1427–1429.
Manteau, S., S. Abouna, B. Lambert, and L. Legendre. 2003. Differential regulation by ambient pH of putative virulence factor secretion by the phytopathogenic fungus Botrytis cinerea. FEMS Microbiol. Ecol. 43:359–366.
Marin, S., N. Magan, J. Serra, A. J. Ramos, R. Canela, and V. Sanchis. 1999. Fumonisin B1 production and growth of Fusarium moniliforme and Fusarium proliferatum on maize, wheat, and barley grain. J. Food Sci. 64:921–924. Marín, S., H. Morales, A. J. Ramos, and V. Sanchis. 2006.
Evaluation of growth quantification methods for modelling the growth of Penicillium expansum in an apple- based medium. J. Sci. Food Agric. 86:1468–1474. McCallum, J. L., R. Tsao, and T. Zhou. 2002. Factors
affecting patulin production by Penicillium expansum. J. Food Prot. 65:1937–1942.
Mislivec, P. B., and J. Tuite. 1970. Temperature and relative humidity requirements of species of Penicillium isolated from yellow dent corn kernels. Mycologia 62:75–88. Moake, M. M., O. I. Padilla-Zakour, and R. W. Worobo.
2005. Comprehensive review of patulin control methods in foods. Compr. Rev. Food Sci. Food Saf. 4:8–21. Morales, H., G. Barros, S. Marín, S. Chulze, A. J. Ramos,
and V. Sanchis. 2008. Effects of apple and pear varieties and pH on patulin accumulation by Penicillium
expansum. J. Sci. Food Agric. 88:2738–2743.
Nazari, L., E. Pattori, V. Terzi, C. Morcia, and V. Rossi. 2014. Influence of temperature on infection, growth, and mycotoxin production by Fusarium langsethiae and F.
sporotrichioides in durum wheat. Food Microbiol.
39:19–26.
Northolt, M. D., H. P. Van Egmond, and W. E. Paulsch. 1979. Ochratoxin A production by some fungal species in relation to water activity and temperature. J. Food Prot. 42:485–490.
Panagou, E. Z., P. N. Skandamis, and G.-J. Nychas. 2003. Modelling the combined effect of temperature, pH and
aW on the growth rate of Monascus ruber, a heat- resistant fungus isolated from green table olives. J. Appl. Microbiol. 94:146–156.
Parra, R., and N. Magan. 2004. Modelling the effect of temperature and water activity on growth of Aspergillus
niger strains and applications for food spoilage moulds.
J. Appl. Microbiol. 97:429–438.
Paster, N., D. Huppert, and R. Barkai-Golan. 1995. Production of patulin by different strains of Penicillium
expansum in pear and apple cultivars stored at different
temperatures and modified atmospheres. Food Addit. Contam. 12:51–58.
Patterson, M., and A. P. Damoglou. 1986. The effect of water activity and pH on the production of mycotoxins by fungi growing on a bread analogue. Lett. Appl. Microbiol. 3:123–125.
Pitt, J. I., and A. A. D. Hocking. 2009. Fungi and food spoilage, 3rd edition. Springer, United States.
Pitt, J. I., R. A. Spotts, R. J. Holmes, and R. H. Cruickshank. 1991. Penicillium solitum revived, and its role as a pathogen of pomaceous fruit. Phytopathology 81:1108–1112.
Puel, O., S. Tadrist, P. Galtier, I. P. Oswald, and M. Delaforge. 2005. Byssochlamys nivea as a source of mycophenolic acid. Appl. Environ. Microbiol. 71:550–553. Puel, O., P. Galtier, and I. P. Oswald. 2010. Biosynthesis
and toxicological effects of patulin. Toxins 2:613–631. Reeslev, M., and A. Kjoller. 1995. Comparison of biomass
dry weights and radial growth rates of fungal colonies on media solidified with different gelling compounds. Appl. Environ. Microbiol. 61:4236–4239.
Ross, T., and T. A. McMeekin. 1994. Predictive microbiology. Int. J. Food Microbiol. 23:241–264. Rousk, J., P. C. Brookes, and E. Bååth. 2009. Contrasting
soil pH effects on fungal and bacterial growth suggest functional redundancy in carbon mineralization. Appl. Environ. Microbiol. 75:1589–1596.
Salomao, B., G. M. F. Aragão, J. J. Churey, O. I. Padilla-Zakour, and R. W. Worobo. 2009. Influence of storage temperature and apple variety on patulin production by
Penicillium expansum. J. Food Prot. 72:1030–1036.
Sanderson, P. G., and R. A. Spotts. 1995. Postharvest decay of winter pear and apple fruit caused by species of
Penicillium. Phytopathology 85:103–110.
Sanzani, S. M., M. Reverberi, M. Punelli, A. Ippolito, and C. Fanelli. 2012. Study on the role of patulin on pathogenicity and virulence of Penicillium expansum. Int. J. Food Microbiol. 153:323–331.
Sweeney, M. J., and A. D. W. Dobson. 1999. Molecular biology of mycotoxin biosynthesis. FEMS Microbiol. Lett. 175:149–163.
Tannous, J., R. El Khoury, S. P. Snini, Y. Lippi, A. El Khoury, A. Atoui, et al. 2014. Sequencing, physical organization and kinetic expression of the patulin biosynthetic gene cluster from Penicillium expansum. Int. J. Food Microbiol. 189:51–60.
Tassou, C. C., E. Z. Panagou, P. Natskoulis, and N. Magan. 2007. Modelling the effect of temperature and water activity on the growth of two ochratoxigenic strains of
Aspergillus carbonarius from Greek wine grapes. J. Appl.
Microbiol. 103:2267–2276.
Valık, L., J. Baranyi, and F. Görner. 1999. Predicting fungal growth: the effect of water activity on Penicillium
roqueforti. Int. J. Food Microbiol. 47:141–146.
Verant, M. L., J. G. Boyles, W. Jr Waldrep, G. Wibbelt, and D. S. Blehert. 2012. Temperature- dependent growth of Geomyces destructans, the fungus that causes bat white- nose syndrome. PLoS One 7:e46280.