HAL Id: halshs-02092097
https://halshs.archives-ouvertes.fr/halshs-02092097
Submitted on 7 Apr 2019HAL is a multi-disciplinary open access archive for the deposit and dissemination of sci-entific research documents, whether they are pub-lished or not. The documents may come from teaching and research institutions in France or abroad, or from public or private research centers.
L’archive ouverte pluridisciplinaire HAL, est destinée au dépôt et à la diffusion de documents scientifiques de niveau recherche, publiés ou non, émanant des établissements d’enseignement et de recherche français ou étrangers, des laboratoires publics ou privés.
Investment Strategy of Chinese Terminal Operators
along the “21st-Century Maritime Silk Road”
Liehui Wang, Yuanbo Zheng, César Ducruet, Fan Zhang
To cite this version:
Liehui Wang, Yuanbo Zheng, César Ducruet, Fan Zhang. Investment Strategy of Chinese Terminal Operators along the “21st-Century Maritime Silk Road”. Sustainability, MDPI, 2019, 11 (7), pp.2066. �10.3390/su11072066�. �halshs-02092097�
Sustainability 2019, 11, 2066; doi:10.3390/su11072066 www.mdpi.com/journal/sustainability
Article
Investment Strategy of Chinese Terminal Operators
along the “21st‐Century Maritime Silk Road”
Liehui Wang 1,2,3, Yuanbo Zheng 2, Cesar Ducruet 4 and Fan Zhang 1,2,*
1 Center for Modern Chinese City Studies, East China Normal University, Shanghai 200062, China; lhwang@re.ecnu.edu.cn 2 School of Urban & Regional Science, East China Normal University, Shanghai 200241, China; geo_zyb19950815@163.com 3 Future City Lab, East China Normal University, Shanghai 200241, China 4 French National Center for Scientific Research, UMR 8504 Géographie‐cités, F‐75006 Paris, France; ducruet@parisgeo.cnrs.fr * Correspondence: zhangfansuper007@163.com Received: 23 February 2019; Accepted: 1 April 2019; Published: 7 April 2019
Abstract: After the the Belt and Road initiative launched in 2013, Chinese terminal operators
invested in ports situated along the “21st‐ century Maritime Silk Road (MSR)”. Identifying which ports are important is made possible through applying complex network methods and GIS analysis. This paper thus identifies strategic hub ports and investment strategies along the MSR. Our main conclusions are as follows. (1) In 2017, the ports with the greatest contact with China were located in the Southeast Asian and European shipping areas. (2) The overseas invested terminals of Chinese terminal operators are mainly concentrated in European and the Mediterranean Sea. Although the connection between China and Southeast Asia is strengthening, terminal operations in Southeast Asia did not expand significantly in the past 12 years. (3) The ports of Singapore, Kelang, Manila (Asia), Rotterdam, Hamburg (Europe), Suez and Port Said (Mediterranean and Red Sea), Brisbane, Melbourne, and Sydney (Oceania) are the ports of major concern for current and future investment by Chinese terminal operators.
Keywords: Maritime Silk Road; port competition; terminal operators; terminal investment;
investment direction; shipping networks
1. Introduction
The Belt and Road refers to the “Silk Road Economic Belt” and “the 21st‐Century Maritime Silk Road”, aiming to strengthen links with infrastructure in Central Asia, Southeast Asia, and other regions. Since the initiative was proposed in 2013, many scholars have paid attention to it [1–3]. As important strategic nodes of the MSR and nodes of global trade circulation, ports play an important role in the economic development of countries along the MSR. The countries along the MSR differ greatly in infrastructure, especially in port and terminal facilities. This are reflected in the gap between African countries and European countries, especially Yemen and Syria in West Asia, and Sudan and Djibouti in Africa, where the efficiency of port logistics is generally low. Some countries with poor economic development and low levels of foreign trade tend to have low logistics efficiency of ports. It is due to insufficient national financial resources and the difficulty of implementing huge investment projects in ports, which leads to high transportation costs. In general, under “Belt and Road” strategy, there are great opportunities for Chinese terminal operators to invest, manage and operate overseas terminals. Therefore, the construction of container terminals along the MSR have attracted more and more attention from Chinese terminal operators. Among the world’s top ten terminal operators, there are three from China, namely Hutchison Ports (Hong Kong), COSCO Shipping Ports, and China Merchants. Although the pace of
internationalization of Chinese terminal operators starts relatively late, development speed faster. Especially in recent years, with the strategy of the Belt and Road and the enhancement of the strength of the terminal operators—represented by such as Hutchison Ports, COSCO Shipping Ports, and China Merchants—have accelerated the pace of investment in overseas terminals along this route. Under the background of the reform of state‐owned enterprises, the merger and reorganization of shipping companies, the integration of port resources, and the cross‐shareholding of port and shipping enterprises have prompted the concentration of state‐owned capital in important industries, and jointly invest overseas to improve external influence and control. Through the internationalization strategy, China will establish an international maritime gateway and logistics fulcrum. Meanwhile, the dividend of China’s port development will also benefit more countries and people along the MSR. However, there is a dearth of studies about which ports are closely connected with Chinese ports along the MSR, what the status of overseas investment by Chinese terminal operators is, and which direction is best for further investment.
Port cooperation is gradually becoming an important way of communication between China and the countries where the ports are located. Port cooperation not only brings economic benefits to both parties, but also to provide sea access for global trade in other countries. As the largest port country and the second largest economy in the world, Chinese port construction has been in the forefront of the world and continues to move around the globe [4]. This paper identifies the strategic hub ports along the MSR by route data, and analyzes the spatial distribution characteristics of overseas invested terminals of Chinese terminal operators represented by Hutchison Ports, COSCO Shipping Ports, and China Merchants Port. Studying which terminal operators operate the important hub ports and which important and potential ports have been (or not yet) invested by Chinese terminal operators provides new evidence on the specific role of Chinese terminal operators to grasp the development and investment trends of the terminals.
The rest of the paper is structured as follows. The literature review can be found in Section 2 as a means to clarify the specific context of MSR development and key concepts such as hubs and maritime networks. Section 3 consists of the research scope, data, and methodology. Section 4 will distinguish the important hub ports along the MSR. In Section 5, we will study the spatial distribution of terminals invested by Chinese terminal operators along the MSR. Investment direction of Chinese terminal operators will be studied in Section 6. Finally, conclusion and discussion can be found in Section 7. 2. Literature Review Chen and Huang et al. have defined the concept and spatial scope of the “21st‐Century Maritime Silk Road” [5–8]. Wang and Chen et al. studied the evolution and spatial pattern of China’s international maritime network and Southeast Asia’s maritime network under the background of the MSR [9,10]. Yuan and Zeng analyzed the optimal selection of regional hub ports, the spatial distribution characteristics of the ports, and the competitiveness and advantage evaluation of important ports along the MSR [11–13]. Liu analyzed the development mode of China’s coastal cities and ports under the background of MSR [14]. Liu and Qiu et al. studied the spatial‐temporal feature of investment and trade facilitation and its impact on trade along the MSR [15]. Cartographies of shipping networks have improved in recent years at various scales and historical periods [16], with particular attention to the Europe–Asia trunk line focusing on mega‐ships [17], the MSR’s spatial pattern [18] and connectivity in the Mediterranean [19]. Although there have been fewer qualitative descriptions and media reports, quantitative research has gradually increased on the MSR in the past two years, with most of those studies focusing on the spatial pattern of the MSR shipping network, the spatial distribution of ports, and the choice of hub ports along the MSR. Thus, there is a lack of research on the distribution of terminals invested by global and Chinese operators. In recent years, many articles have reviewed on the research progress of port geography [20– 24]. The latest review found that the main research topics in port geography were from “North America” and “container service” in 1967 to 1982, “deep water port”, “shipping market”, and “competition” in 1983–1998 to “port” and “network” in 1999–2013 [25]. The application of network
analysis method based on graph theory and the improvement of data availability in the research of port geography also promotes the research of shipping networks [4,26]. The shipping network has attained a relatively mature research format. With the changes in the port and shipping market, the research focus of port competition has gradually changed. Scholars have begun to pay attention to the impact mechanism of shipping and terminal companies on ports. Heaver believed that the terminal has become the basic unit of port research [27]. Song et al. argued that port development is increasingly determined by external factors, and port and shipping companies promote the development mechanism to be refined to terminals [28,29]. Tongzon believes that more than 80% of container cargo is handled by ship companies rather than ports [30].
According to the research by Drewry Shipping Consultants, the terminal operators refer to the operators with terminal operation in the major economic regions of the world [31]. Global terminal operators are defined by Bichou and Bell as companies involved in international port terminal operations with a view of establishing globe‐spanning network services [32]. Traditionally, a terminal company refers to a functional company that specializes in cargo handling, storage, and other transportation activities and that operates berths by utilizing various facilities and equipment in the port/terminal [33]. With the integration of modern logistics resources, shipping companies have begun to enter the terminal market extensively, and the traditional functional boundaries between companies engaged in marine cargo transportation and companies engaged in terminal handling are gradually blurred [34]. Therefore, there is no strict classification standard for the types of container terminal operators. Bichou and Bell [32] propose a classification of global port operators based on four types of market players: (a) terminal operating shippers mainly active in non‐containerized cargo operations; (b) terminal operating shipping lines with terminals operated on a dedicated or a common‐user basis; (c) terminal operating port authorities; and (d) terminal operating companies. Notteboom et al., drawing on previous studies, classified terminal operators into three categories: stevedores, maritime shipping companies, and financial holdings [35].
Meanwhile, scholars have studied terminal operators from different perspectives. Slack and Frémont have studied different strategies and reasons for terminal operators in different regions of North America and Europe from localization to globalization [36]. Olivier’s research found that the different entry conditions and working environments of the local market lead to the different degrees of participation of the global container terminal operators [37,38]. From the perspective of corporate geography, Notteboom and Rodrigue explored the regional characteristics of global terminal operators’ investment strategies [35]. Parola and Veenstra developed a measurement standard to compare the concentration of spatial coverage for shipping lines and container terminal operators [39]. Cullinane, who compared Port of Singapore Authority and Hutchison Ports, argued that the
network expansion of terminal operators is only active in some areas [40]. Parola and Notteboom analyzed the strategic factors of overseas investment of terminal operators through logistic regression analysis [41]. In summary, the research focused on the management, operation strategy, expansion mode of terminal operators or a container liner company routes distribution, often based on simple data display and text description. At the same time, it emphasizes the expansion process and case analysis of terminal operators. Quantitative methods remain lacking in analysis of the investment distribution network and investment choice of terminal operators, not only for the top terminal operators in the world, but also for the investment strategy of Chinese terminal operators.
3. Research Scope, Data, and Methodology
3.1. Research Scope
MSR is an open cooperation and communication network, without a clear spatial scope, However, the national development and reform commission issued specific documents entitled
“Promote the construction of the Silk Road Economic Belt and the vision and action of the maritime Silk Road in twenty‐first Century” in 2015 [42] and “Vision for maritime cooperation under the Belt and Road initiative” in 2017 [43], which proposed that three blue economic channels should be constructed, that
constructing of the China–Oceania–South Pacific blue economic channel; and actively promoting the construction of the blue economic channel connecting Europe through the Arctic Ocean. Therefore, this paper defines the spatial scope of the MSR as the following areas (Figure 1). Figure 1. The spatial scope of the MSR. In this paper, Chinese terminal operators are represented by Hutchison Ports, COSCO Shipping Ports, and China Merchants Port. These operators are currently ranked 4th, 5th, and 6th among the top 10 terminal operators in the world. Hutchison Ports is a global terminal operator coming from a stevedore background, who managed terminals as profit centers. It has invested in 61 terminals across 27 countries and regions so far. COSCO Shipping Ports is one of the most important terminal operators in China. With a maritime shipping background, it invested in port terminal facilities to support their maritime shipping business. Its terminal investment is mainly concentrated in China, but in recent years, it has accelerated the pace of overseas investment. Its terminal network has significantly expanded in 2016, mainly due to the integration of China Shipping Group’s assets in late 2015, thereby gradually being transformed into a pure terminal operator. China Merchants Port is a Chinese terminal operator with rapid development in recent years, and mainly focuses on China’s terminal investment. In recent years however, it expanded its portfolio to overseas terminals, with a particular emphasis on MSR terminals. Overall, it invested in 35 terminals in 14 countries and acquired the port of Newcastle in Australia in 2018, thus achieving its presence across all continents. These three terminal operators alone can basically reflect the overall investment pattern of Chinese terminal operators. 3.2. Research Data The data in this paper consists of two parts. The first consists in the route data of Chinese and MSR ports in 2005 and 2017 obtained from China Shipping Weekly, which details container port routes data between China and the rest the world. Information includes container ship’s destination port, departure and arrival time, vessel name and voyage, etc. Based on these data, a realistic container shipping network is constructed, which can identify the hub ports along the MSR. The second part is about the data of the three Chinese terminal operators, including the terminal operation information from respective official websites, annual reports (2005–2017) including information about their global shipping, and port development strategies. 3.3. Research Methodology There are many different centrality indicators in complex network research [44]. In recent years, many scholars have begun to apply various measures of centrality to analyze transportation networks to evaluate the status of nodes in the network as whole or at the level of nodes, such as degree centrality, closeness centrality, and betweenness centrality as the most common indicators
[45–51]. For example, Wang and Jin et al. measured the nodal centrality of individual cities in the air transport network of China with the indicators of degree, closeness, and betweenness[48]; Wang and Antipova et al. calibrated the street centrality according to a node’s closeness, betweenness, and straightness on the road network [47]; Wang and Hong measured the evolving features of the cross‐ strait container port system, by using analysis indicators such as degree, weighted degree, closeness centrality, betweenness centrality, and clustering coefficient [26]. However, the centrality indicators of degree, closeness, and betweenness represent a node’s location advantage as being directly connected to others, being accessible to others, and being the intermediary between others, respectively. Any central indicator can only reflect topological features, but not comprehensive, in order to comprehensively reflect the hub ability of the port, this paper draws lessons from Mo et al. on the study of China’s Airport network [52], who combined the above three indicators, and adopted the method of system centrality to quantify the hub ability of the ports along the MSR. 3.3.1. Degree Centrality A port’s degree centrality refers to the number of neighbor ports directly connected with the port. The greater the degree centrality of the port, the more its connectivity is diversified. Based on this indicator, Proctor and Loomis analyzed the structure of social networks with degree centrality [53], with concrete applications in the transport sector such as Shaw on major US passenger airlines [54], Wang et al. on key nodes in the MSR shipping network [55], and Zhong measuring railway accessibility in China [56]. It is calculated as
n i j j ij ik
n
DC
, 11
1
(1)where DCi represents the degree of node Vi. Considering the scale of the network, after
standardization, there is 0 ≤ DCi ≤ 1. The greater the DCi value, the stronger the centrality of the node.
3.3.2. Closeness Centrality
In the port system, closeness centrality refers to the sum of the shortest distance from a given port to all ports in the network. The greater the closeness centrality of a port, the greater the relative accessibility of the port, and the stronger the transshipment capacity. In the mid‐20th century, Shimbel used closeness centrality to describe network accessibility [57]. Garrison, a geographer, used similar indicators to analyze the connectivity of the US interstate highway system [58]. Pitts analyzed the importance of towns in medieval Russia based on the shipping trade network [59], while Wang analyzed the spatiotemporal evolution of China’s railway network in the 20th century [60]. It is calculated as 1 -i , 1
1
1
n j j ij id
n
CC
(2)where dij represents the shortest distance from node vi to vj. n − 1, which is not only about network
size but also represents the maximum value of node accessibility. After standardization, 0 ≤ CCi ≤ 1.
The greater the CCi value, the stronger closeness centrality of the node.
3.3.3. Betweenness Centrality
In the global shipping network, betweenness centrality refers to the number of shortest paths between all pairs of ports passing through a given port in the network, defined as ‘intermediacy’ in the transport. It mainly reflects the influence of nodes in the entire network, as high values often correspond to hubs or bridges [61]. In the mid‐20th century, scholars such as Bavelas Freeman, and Pitts proposed ideas about betweenness centrality and its calculation method [62–65] in various domains.
n k j j ij k ij n k j i kn
n
BC
, 1 , 1 23
2
2
>
(3)whereδij represents the total number of shortest paths dij from nodes vi to vj. BCk represents the
number of shortest paths through the given node Vk in theδij shortest path. After standardization,
there is 0 ≤ BCk ≤ 1. The greater the BCk value, the stronger the betweenness centrality of the nodes.
3.3.4. System Centrality The calculation formula of such a composite indicator is
)
1
(
)
(
1 i 2 i 3 i iw
DC
w
CC
w
BC
SC
(4) In the formula, we also consider the correlation between degree centrality (w
1) and closeness centrality (w
2), letw
1 +w
2 = 1 (0 ≤w
1 ≤ 1, 0 ≤w
2 ≤ 1), so thatw
1 =w
2 = 0.5. We also consider the polarization of betweenness centrality (w
3), wherew
3 = 1(0 ≤w
3 ≤ 1). So the final formula is)
1
(
)
5
.
0
5
.
0
(
i i i iDC
CC
BC
SC
(5) 4. Identification of Hub Ports along the MSR Based on the statistics of the routes between Chinese ports and the ports along the MSR in 2005 and 2017, and the calculation of complex network indices, this paper identifies which ports are closely related to China along the MSR, and then identifies strategic hubs, as a means to forecast which overseas terminals shall be invested by Chinese terminals operators.From the perspective of navigation areas, the distribution of hub ports is not balanced (Table 1). In terms of the number of ports, 102 ports along the MSR, Europe, Southeast Asia, and the Mediterranean had the largest number of ports connected with Chinese ports in 2005, with 20, 19, and 19 respectively. The number of ports connected with East Africa was the lowest, and only five ports being linked with Chinese ports. In 2017, there were 157 ports along the MSR, Southeast Asia and Europe are the most connected with Chinese ports, with 35 and 34 respectively, indicating that these two navigation areas keep their strategic linkage with China. Although the number of ports in the Mediterranean have increased slightly, its proportion declined significantly, from 18.63% in 2005 to 14.01% in 2017. The number of ports in West Asia, though, increased steadily, namely 22 ports connected with Chinese ports. Overall, East Africa remains the weakest connection, but the total number of ports connected with China has increased, from 5 ports in 2005 to 11 ports in 2017. The number of ports in Oceania increased from 13 in 2005 to 22 in 2017, which is the same as the number of ports in the Mediterranean.
Table 1. Hierarchical structure of the port system along the MSR.
In 2005 In 2017
Level Scores Number of
Ports Ports Scores
Number of Ports Ports 1 0.87– 1.20 2 Port Kelang; Singapore 0.67–1.20 1 Singapore 2 0.45– 0.86 10 Hamburg; Rotterdam; Sydney; Felixstowe; Antwerp; Auckland; Brisbane; Melbourne; Le Havre; Southampton 0.40–0.66 10 Manila; Port Kelang; Rotterdam; Tanjung Pelepas; Ho Chi Minh; Laem Chabang; Suez; Hamburg; Antwerp; Jakarta; 3 0.31– 0.40 28 Colombo; Damietta; Manila; Zeebrugge; Valencia; Wellington; Tauranga; Durban; Malta, etc. 0.30–0.39 29 Piraeus; Colombo; Davao; Felixstowe; Genova; Nhavasheva; Jebel Ali; Brisbane, etc. 4 0.25– 0.30 34 Laem Chabang; Mundra; Fos sur Mer; Lautoka; Suva; Aden; Taranto; Bandar Abbas, etc. 0.21–0.29 66 Zeebrugge; Lyttelton; Napier; Tauranga; Jidda; Algeciras; Cope Town; Cebu, etc. 5 0–0.24 30 Bintulu; Kota Kinabalu; Kuching; Gioia Tauro; Pontianak; Muara Harbour; La Spezia; Sibu, etc. 0–0.20 51 Port Sudan; Port Muhammad Bin Qasim; Gdansk; Aarhus; Rangoon; Viti Levu Island; Noumea; Lae, etc.
From the perspective of individual ports, many changes occurred in the past 12 years or so (Figure 2). Ports in Southeast Asia have become the most connected with China, more than those in Europe. On the one hand, based on the strengthening of trade and regional integration dynamics between China and Southeast Asian countries, the direct contact has increased. On the other hand, because a large number of ships connecting Europe, the Mediterranean, and other regions have been transshipped in Southeast Asia ports, this makes the hub degree of certain South Asian ports (e.g., Singapore) significantly improved or even inflated due to double counts and sea–sea transshipment. This explains a large part of why Southeast Asia gradually became the most important investment area for Chinese terminal operators. Conversely, the hub degree of Oceanian ports declined rapidly. For instance, Brisbane, despite its highest hub degree in this region, remains ranked in the third level while most other Oceanian ports are in the fourth and fifth level, thereby underlining that although the breadth of connection of China–Oceania has improved, the closeness of the connectivity has declined. As mentioned earlier, the hub degree of Mediterranean ports significantly improved, from the fourth and fifth level in 2005 to the third level in 2017, just like the connection with Chinese ports. The navigation areas of East Africa and West Asia not only have fewer port connections with Chinese ports, but also have the lowest level. However, the hub degree of the ports presents a trend of growth on the whole. (a) (b) Figure 2. Routes between China and other countries on the MSR in 2005–2017; (a) In 2005; (b) In 2017. From the perspective of ports, the hub port with the strongest connection with Chinese ports was Port Klang, followed by Singapore port, both of which belong to the first level in 2005. According to the 2004 Maritime Review, in order to maintain its competitiveness in transshipment business, Malaysia has lifted the coastal trade restrictions on major liner routes and allowed international liner shipping companies to load and transship at Malaysia’s secondary port (Port Klang). As a result, Port Klang became the hub port with the most connected with Chinese ports in 2005. In 2017, Singapore port took over Port Klang to become the hub port with the strongest connection with Chinese ports. The Port of Singapore is the largest transit port in the Asia‐Pacific region, with an important strategic position—west of the Straits of Malacca, the main shipping route between the Pacific Ocean and the Indian Ocean. Therefore, the Port of Singapore has always been in the first level. Manila’s port also exceeded Port Klang as a secondary hub port after Singapore in 2017. Mainly because Manila’s port is the largest and most modernized port in the Philippines, it is located on the East–West main routes or North–South main route in the world. In addition, Linchaban port, Ho Chi Minh City port, and Tanjung Pelepas port in Southeast Asia developed close shipping links with Chinese ports. The ports of Rotterdam, Hamburg, Antwerp, and Felixstowe are the ports with strongest connection with Chinese ports in the European and Mediterranean regions. Surprisingly, the port of Piraeus in Greece has improved significantly in the past 12 years, from 38 to 12, surpassing Valencia’s port and Port Said to become the highest‐ranking hub port in the Mediterranean. On the one hand, because of its superior geographical position—Port Piraeus is located with the Mediterranean Sea to the South and in the Balkans to the north—it is an important transportation hub in the Mediterranean. This deep‐
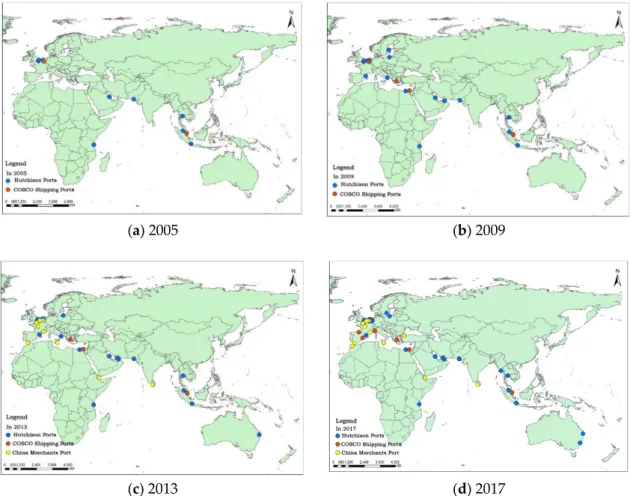
water port in the European region, closest to the Far East, is also one of the closest ports to the main route of the Suez Canal to Gibraltar on the European and the Mediterranean coast. On the other hand, after the port was taken over by China in 2010, China invested a large amount of capital and technology and abided by the EU and local laws and regulations. After the improvement of the port infrastructure by Chinese and Greek enterprises, the operation efficiency of the port increased, revitalizing the port and making its pivotal position increasingly prominent. Meanwhile, the Suez port in Egypt became the only port in the second level of West Asia, mainly due to its strategic location. 5. The Spatial Distribution of Terminals Invested in by Chinese Terminal Operators along the MSR The number of Chinese terminal operators investing in overseas terminals is on an increasing trend. Although ports invested by COSCO Shipping Ports and China Merchants Port concentrate in mainland China, those actors gradually expand their networks globally. In 2005, Chinese terminal operators still witnessed limited investment overseas, mainly in Europe and Southeast Asia. With the continuous development of trade and the proposal of the Belt and Road initiative in 2013, the pace of overseas investment continued accelerating. At present, the investment is mainly concentrated in Europe and the Mediterranean, although the number of terminals invested in Southeast Asia has increased to some extent, the growth rate is small. In terms of throughput, domestic terminals still occupy a dominant share of their overall activity. Yet, the proportion of container throughput of overseas terminals has increased year by year (Figure 3).
(a) Hutchison Ports
(b) COSCO Shipping Ports
(c) China Merchants Port Figure 3. Status of investment by Chinese terminal operators. Hutchison Ports is the first Chinese terminal operator to invest overseas. In 2005, the number of overseas terminals was higher than that of investment terminals in China, among which the number of terminals they invested in in China basically remained stable in the past 12 years, from 15 terminals to 14 terminals. Overseas investment outside the MSR has maintained a steady growth trend, with 9 terminals from 2005 to 2013, and increasing to 11 in 2013–2017(Figure 3a). The number of terminals (excluding China) invested in increased from 11 in 2005 to 28 in 2017 along the MSR, covering most regions (Figure 4), it has become the operator with the most investment terminals in the MSR among the three terminal operators. After the launch of the “Belt and Road” initiative in 2013, overseas investment mainly concentrated along the MSR, especially in Europe. In recent years, the throughput of invested terminals continuously grew, to such an extent that it is gradually approaching the throughput volume of mainland China’s terminals, it has increased from 16.13 million TEUs in 2005 to 35.4 million TEUs in 2017, accounting for 41.79%, much higher than the other two terminal operators. From the perspective of port investment, on the one hand, Hutchison Ports is committed to investing within economically developed countries, such as London Thames port, Felixstowe, Harwich international port, Rotterdam ECT Euromax, Amsterdam, etc. On the other hand, it is committed to investing in Southeast Asian terminals that are frequently connected with Chinese ports, such as Jakarta International Container Terminal and Koja Terminal in Indonesia, Myanmar International Terminal in Myanmar, etc. Meanwhile, it also pays attention to improving the layout of the terminal and balancing regional operational risks. The overseas investment terminal of COSCO Shipping Ports is complementary to its shipping business. The investment of the Chinese terminal accounted for the vast majority. Especially in 2005, COSCO Shipping Ports invested a total of 16 terminals, and the investment in China accounted for 14. During 2005–2013, investment in China showed a steady growth trend. From 2013 to 2017, it grew rapidly from 19 to 30. The number of terminals increased from 2 in 2005 to 10 in 2017 along the MSR, its growth is also mainly concentrated in 2013–2017(Figure 3b). Among the overseas terminals receiving investment, except Pusan port in South Korea and Seattle port in the United States, the rest of the terminals are distributed along the MSR. It initially began its own overseas expansion in Singapore and then gradually expanded to Europe, the Mediterranean, and East Africa. However, in recent years, COSCO shipping ports have focused on Europe and the Mediterranean, while Southeast Asia and East Africa have remained unchanged. These terminals either have vast hinterlands, such as the Rotterdam Euromax terminal and the Antwerp terminal, or have an important geographic position such as Port Said in Egypt, Piraeus in Greece, and the COSCO‐PSA Terminal in Singapore. As seen for Hutchinson, Mainland China’s terminal throughput still dominates COSCO’s activity and maintains a relatively rapid growth, it reached 86.5912 million TEUs in 2017, while at the same time, the share of overseas terminals—especially along the MSR—increased from 0.681 million TEUs in 2005 to15.10 million TEUs in 2017, and the proportion increased from 2.61% to 14.29%. Thus witnessing a global expansion of COSCO’s container terminal network.
(a) 2005 (b) 2009
(c) 2013 (d) 2017
Figure 4. Evolution of terminal investment along the MSR in 2005–2017.
The terminal investment of China Merchants Port in China increased from 6 in 2005 to 18 in 2017(Figure 3c), showing a steady growth trend and the growth rate was relatively fast concentrated in 2005–2009. Although China Merchants Port had not started to invest in overseas terminals before 2009, a total of 13 terminals were invested in along the MSR in 2017. This is mainly due to the help of the China–Africa Development Fund and the implementation of the “Belt and Road” initiative to accelerate the pace of internationalization. At the same time, due to the acquisition of 49% equity of Terminal Link by China Merchants Port in 2013, China Merchants Port indirectly invested more terminals in Europe. The main investment area of China Merchants is the MSR. Unlike Hutchison Ports and COSCO shipping ports, which are mainly concentrated in developed countries such as Europe and the Mediterranean, China Merchants Port’s direct investment is mainly concentrated in developing countries such as Africa and South Asia, while mainly focusing on potential future development opportunities offered by emerging markets and advantageous geographical locations. For example, China Merchants Group (Hong Kong, China) and Djibouti Port Co., Ltd. (Djibouti, Djibouti) jointly invested in the port of Djibouti. It is because of the important strategic position of the port, which is located on the west coast of the Gulf of Aden, lying on the boundary of three continents (Europe, Asia, and Africa) as the southern gate of the Red Sea, thus competing with existing ports such as Aden (Yemen) and Salalah (Oman). Similarly, investing in Tangier‐Med and Casablanca ports in Morocco has much to do with this growing market and strategic situation at the Gibraltar Straits, despite the earlier development of other hub ports such as Algeciras and Valencia in Spain. In these three regions, the number and throughput of investment terminals of China Merchants Port maintained a high consistency with COSCO shipping ports; namely, China is the first, the MSR are second, and other overseas regions are third, and the throughput of the terminals invested in in China was much higher than that of the other two regions. Although there is a certain gap between the total number of terminals invested in by China Merchants Port in China and COSCO shipping ports in 2017, the throughput is only slightly lower than that of COSCO shipping ports,
reaching 84.599 million TEUs. It also witnessed a significant increase in the throughput of invested terminals along the MSR, from 5.269 million TEUs in 2013 to 13.08 million TEUs in 2017, accounting for 12.31%.
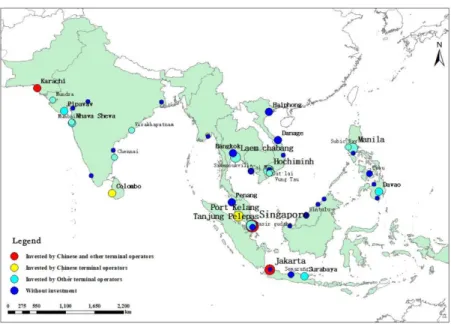
Although the terminal investment of the three Chinese terminal operators has different operational strategies, more than 70% of their overseas invested terminals are concentrated along the MSR (Figure 5), most of which covers the first two economic channels. The terminal investment of the three Chinese terminal operators has a high similarity with the top 10 terminal operators in the world along the MSR, that is, the European and Mediterranean are the main areas for them to invest in, and they have made a large amount of terminal investments in these navigation areas. At the same time, no attention has been paid to ports in countries such as Australia and New Zealand in Oceania. However, China’s three terminal operators are slightly less focused on investing in terminals in Southeast Asia and South Asia than other terminal operators in the world. Although other terminal operators in the world do not regard West Asia and East Africa as their key investment areas, China Merchants Port regards them as the key areas for future investment. Figure 5. Chinese terminal operators invested in terminals overseas in 2017. 6. Investment Direction of Chinese Terminal Operators 6.1. Southeast and South Asia The terminals invested in by Chinese terminal operators are concentrated in the navigation areas of Europe and the Mediterranean basin, and relatively fewer are in Southeast Asia. China Merchants Port have not even invested in Southeast Asia. Most of the investments in Southeast Asia terminals were completed in 2005 already and have not significantly expanded in the last 10 years (Figure 6). There are 35 ports in Southeast Asia that are closely connected with Chinese ports, and with the increase of direct and transit trade between China and Southeast Asia, the connection is gradually deepening. At the same time, Southeast Asia is relatively close to China and has a distance advantage, and most of this region is composed of developing countries which have plans of port construction, partly to palliate Singapore’s overwhelming dominance in this region. Indonesia planned to build itself into an ocean power through the construction of a ‘maritime highway’ and the New Priok port, which has become the new national strategy of Indonesia. Therefore, Southeast Asia had become the most important investment area for Chinese terminal operators. Among the three Chinese terminal
operators, only COSCO Shipping Ports and Port of Singapore Authority have jointly invested in a terminal in Singapore port. Only one operator, Hutchison Ports, has invested in Port Kelang, the other two are not involved, and the top 10 terminal operators (excluding China) in the world have not invested either. Although the three Chinese terminal operators have not invested in the port of Manila, both DP world and ICTSI (International Container Terminal Services Inc.) have invested there. Singapore, Port Klang, and Manila are the most important ports for Chinese terminal operators.
Figure 6. Spatial distribution of invested terminals in Southeast Asia and South Asia. Note: other
terminal operators refer to the top 10 terminal operators of the world, excluding the three Chinese operators.
Compared with Southeast Asia, South Asia has relatively few ports associated with Chinese ports, most of them locating in India, Sri Lanka, and Pakistan. By the end of 2017, COSCO Shipping Ports had not yet invested there, while Hutchison Ports and China Merchants Port invested in two terminals and one terminal respectively in this area. The port hub degree in South Asia is relatively low and the connection with Chinese ports is relatively weak. However, most South Asian ports have been invested in by global terminal operators, thus underlining their investment value. The port of Colombo in Sri Lanka is the port with the strongest connection with Chinese ports in South Asia. At present, only the investment of China Merchants Port, together with an 80% share of Hambantota port acquired by China Merchants Port in 2017, have realized synergy effects to unlock the potential of Sri Lanka to become a global shipping center. The port of Hambantota is known as the “the crossroads of the East”, where more than half of the world’s container cargo, one‐third of its bulk cargo, and two‐thirds of its oil are passing, so it is also known as “the heart of the Indian Ocean”. Therefore, strategic hub ports such as Colombo and Hambantota have also become the focus of Chinese terminal operators. 6.2. Europe and the Mediterranean Due to vast hinterlands, mature and open market environments, Europe and the Mediterranean have always been hotspots for investment by Chinese and other global terminal operators (Figure 7). At the same time, the number of ports connecting these regions with China is the largest. Although the hub degree of the ports in 2017 has declined since 2005, it still maintains a high level. Most of them are developed countries where decision‐making procedures, safety, environmental protection, and social welfare when it comes to terminal construction are sensible; notably in terms of dockworkers’ strikes. Among the three Chinese terminal operators, in addition to the Hutchison Ports which has the highest globalization level, COSCO Shipping Ports and China Merchants Port are still
mainly investing in Mainland China terminals, while overseas investment is still in a preliminary stage. Therefore, Chinese terminal operators should pay attention to the investment of terminals in this region, and they can invest in overseas terminals by means of mergers and acquisitions, etc., which can reduce investment risks to some extent.
Figure 7. Spatial distribution of invested terminals in Europe and the Mediterranean.
The ports of Hamburg and Rotterdam have very close shipping links with China. Yet, none of the three Chinese terminal operators have invested in Hamburg. Among the top 10 operators in the world, only Eurogate invested there. Hamburg and Rotterdam are also the targets of Chinese terminal operators. At the same time, there are more shipping routes between Le Havre, Felixstowe, Piraeus, Barcelona, Antwerp, and Chinese ports. The three terminal operators have invested in Antwerp, and China Merchants Port indirectly invested in Le Havre (France) through the acquisition of Terminal Link. The rest of these ports have not been invested in by the three Chinese terminal operators, so they can be the focus of investment for Chinese terminal operators.
6.3. Western Asia (Middle East) and East Africa
Although the number of ports connecting West Asia and East Africa with China is relatively small, the number of shipping links has been increasing in recent years. These areas are rich in mineral resources, have relatively insufficient port capacity, and have great potential for future port development. At the same time, most of them are developing countries, which are conducive to the investment of some Chinese port operators in the initial stage of overseas development. In recent years, China Merchants Port has expanded its overseas business mainly around developing countries such as Africa (Figure 8), so these places have also become key areas for investment.
Figure 8. Spatial distribution of invested terminals in West Asia (Middle East) and East Africa. Port Said, Jebel Ali, Durban, Dammam, Louis, Jeddah, and Cape Town ports are the important investment ports due to their important geographical location, which are important fulcrums along the MSR, such as Jeddah in the Red Sea. At present, apart from COSCO Shipping Ports, which holds 16.5% of the shares in Port Said, Hutchison Ports has invested in Daman Port, the rest of these ports have not been invested by Chinese terminal operators, and there is less investment from other foreign terminal operators. In the future, Chinese terminal operators should make full use of the market opportunities in West Asia and East Africa ports, and start to develop the transit business of bulk cargo, containers, rolling cargo (automobiles), oil and gas, etc. in West Asia and East Africa, and increase the number of terminal investment in this area. 6.4. Oceania Australia and New Zealand are the two major countries in this region (Figure 9). The shipping links between Chinese ports and Oceania are relatively strong, and the hub degree of the ports was relatively high in 2005. However, this relationship declined significantly in 2017. Figure 9. Spatial distribution of invested terminals in Oceania.
The ports of Brisbane, Melbourne, and Sydney in Australia are the most connected with China among other Oceanian ports. These ports have been invested by Chinese terminal operators. Chinese terminal operators can consider investing in New Zealand through equity participation or in partnership with local companies.
7. Conclusions
This paper is based on a mix of quantitative and qualitative research about a very ‘hot’ and current topic such as the emergence of a new Maritime Silk Road not unlike that of like 2000 years ago, mainly connecting Europe and Asia and centered upon a Chinese driver. This paper first analyzes routes data between China and the MSR in 2005 and 2017, and the terminal investment distribution and throughput of the main Chinese terminal operators. Our main conclusions are as follows. First, besides operational aspects, we also need to determine the changing spatial distribution of hub ports long the MSR. This is an addition to current debates about which ports should be selected (or not) as hubs to facilitate China’s dominance along this route. We could observe that ports with the greatest connectedness with Chinese ports are mainly located in Southeast Asia and Europe in 2017. Yet, regional shifts occurred in the past 12 years. Even Port Klang and Singapore have gradually lost connectivity between 2005 and 2017. East Africa and West Asia not only have fewer port connections with Chinese ports, but also belong to the lowest level in our results. Overall, the hub degree of all ports witnessed a growing trend. Hutchison Ports’ overseas investment in terminals started early, being more a Hong Kong than a mainland China actor, with no less than 61 terminals in 27 countries, with a growing emphasis on Europe in recent years. COSCO Shipping Ports currently invest in 48 terminals in 12 countries, but mainly in China. Recent years, however, witnessed its accelerated overseas investment mainly in Europe and the Mediterranean. In the same vein, China Merchants Port mainly invested in Chinese terminals during their initial phase, with a late and rapid investment in foreign terminals, especially along the MSR. It invested in 36 terminals in 15 countries across 6 continents, with direct investment mainly concentrated in developing countries. The overseas invested terminals of Chinese terminal operators are mainly concentrated at ports with either vast hinterlands, strategic geographic position, or great potential for future development. In geographic words, although shipping links between China and Southeast Asia strengthened, most of the terminals receiving investment in Southeast Asia were completed by 2005, and have not significantly expanded in the last 12 years. However, Southeast Asia remains to date the most important investment area for its terminal operators, followed by Europe and the Mediterranean. Ports connected with Chinese ports maintained a high level, but their hub degree had declined in the past 12 years or so. In addition, most of them are situated in developed countries, which implies constraints on concessions, operations, and planning. Therefore, this area is not conclusive to Chinese terminal operators. The number of shipping links between Western Asia/East Africa and China has increased in recent years, notably due to more South–South cooperation with emerging countries such as Brazil and South Africa being a good alternative to Suez for connecting Latin America and China [66,67]. The number of shipping links between Oceania and China has greatly reduced, indicating a lack of motivation to invest further in this region.
At the company level, only COSCO Shipping invested in the port of Singapore, which has an important strategic position since colonial times and became a first‐class hub port with the most shipping links with Chinese ports. All Chinese operators included, our study indicated that mainly Southeast Asian ports would be worthy of attention in the coming years (e.g., Port Klang, Manila, and Colombo). Europe’s largest ports such as Rotterdam and Hamburg always maintained close shipping links with China. Thus, Chinese terminal operators are likely to become key investment actors in this region, but also at strategic pathways such as Egypt (Port Said), and Australia (Brisbane, Melbourne, and Sydney).
Based on the statistics of the routes between Chinese ports and the ports along the MSR, this paper identifies the ports in Southeast Asia such as Singapore, Manila, and Kelang, as well as European ports such as Rotterdam, Hamburg, and Antwerp, which are closely related to Chinese ports. Combined with the distribution of the investment terminals of the three Chinese terminal operators, this paper analyzes that the ports of Singapore, Kelang, Manila (Asia), Rotterdam, Hamburg (Europe), Suez and Port Said (Mediterranean and Red Sea), Brisbane, Melbourne, and Sydney in Oceania are the ports of major concern for current and future investment by Chinese terminal operators. Porter’s five forces model was proposed by Michael Porter in the early 1980s. Five factors are expressed in the model. Through this model, the basic competitive situation of different industries is analyzed, which is a strategic analysis tool that enterprises often use when formulating competitive strategies [68]. The five market factors are as follows: (1) Competition among existing competitors. In addition to the three major Chinese terminal operators mentioned in this paper, there are more than 10 well‐known terminal operators, such as PSA, DP world, APM Terminals, etc. These operators have developed rapidly in recent years, and tend to monopolize gradually. Competition between them is fierce. Compared with the global terminal operators, there is still a gap between Chinese terminal operators. In China, Hutchison Ports, COSCO Shipping Ports and China Merchants Port are completely in a dominant position. Most other terminal operators only invest in domestic terminals in China. (2) Potential entry threats. With the increasing strength of terminal operators and the promotion of policies, some local‐level terminal operators are beginning the internationalization process. For example, besides acquiring a 25% stake in the APM Terminals Zeebrugge, SIPG has also independently invested in Israel Haifa Bayport Project in 2015, and continuously paid attention to overseas terminals. (3) Alternative threats. This paper has found that the ports of Singapore, Kelang, Manila (Asia), Rotterdam, Hamburg (Europe) et al. are the investment targets of Chinese terminal operators. Moreover, the investments of Chinese terminal operators in these ports have made good returns. For example, in 2017, COSCO Shipping Ports’ profits at COSCO‐PSA terminal reached $15,133,000(including the profit of Asian container terminals) (according to COSCO Shipping Portsʹ annual report and accounts 2017), an increase of 15% over the previous year. Investing in the Euromax Terminal Rotterdam in 2017 returned a profit of $2,752,000 (according to COSCO Shipping Portsʹ annual report and accounts 2017). However, these ports are also facing threats from nearby ports, such as those in Asia that are threatened by alternative ports such as Tanjung Pelepas, Pasir Gudang, and the new port of Melaka Gateway. The advantage of these alternative ports is that the competition between terminal operators is relatively small compared with the ports of major concern, but they also face the problems of poor infrastructure of these ports, especially investing in new ports, which require more financial and technical support. (4) Buyer bargaining. In this paper, the buyer is influenced by two subjects. One subject refers to the terminal operator. Some global terminal operators have relatively complete operation departments, which can obtain market information in an easy and timely manner, and they have strong support of capital, technology, and management experience, so they have strong bargaining power compared with local and regional terminal operators. Another subject is the shipping company. Shipping companies have strong bargaining power because the shipping company chooses ports/terminals to call in, which are affected by the conditions of ports/terminals, preferential policies, etc. Once the adjacent port/terminal has more preferential policies, shipping companies are likely to choose the new port/terminal. (5) Supplier bargaining. In this article, the supplier refers to the holder of the local terminal, either the enterprise or the local government. Compared with European ports, the ports in west Asia and Africa have relatively low bargaining power due to poor infrastructure, low level of economic development, and small demand of ports. In summary, the terminal operators are currently in a monopolistic competition.
While terminal operators are striving to improve their own strength, they must also pay attention to avoiding the following risks. (1) Political risk. When Chinese terminal operators implement the internationalization strategy, they should pay attention to the political situation of the countries that invest in terminals. (2) Cross‐cultural and legal differences. In the process of
internationalization, terminal operators should pay attention to the differences of national culture and laws between different regions. (3) The influence of international rules and practices. When investing in overseas terminals, it is necessary to fully understand the foreign investment approval, investment restrictions, foreign exchange policies, discrimination provisions, etc. of the target country, and abide by the relevant laws and regulations [69,70]. At the same time, attention should be paid to the investment methods of enterprises along the MSR. Hambantota Port is now a prime example of the “debt trap” under the initiative of the Belt and Road. To prevent the occurrence of similar incidents, the Belt and Road initiative must establish an open and transparent model, acting in accordance with market rules and prevailing international rules, including open and competitive tenders for projects, and public research on the impact of the environment, safety, and society of the terminal. Promoting the implementation of strategic port projects at the national level, establishing multilateral/bilateral agreements or cooperation mechanisms with international binding force, and guiding local enterprises to participate in these projects so as to promote their advantages in localization. Terminal operators should also consider strengthening loan business cooperation with Western financial institutions or third country, which can reduce the resistance to some extent.
This paper analyzed the investment choices of Chinese terminal operators along the MSR. One main objective was to identify which ports are hub ports for Chinese terminal operators, and what are the determinants of such an investment strategy. It constitutes innovative research, mixing network analysis and strategic investment analysis, as most works in this domain remain disconnected from the ‘ground’ and mostly focus on topological properties in physics for instance. Maritime networks are spatial networks and therefore are evolving according to multiple and complex factors including decision‐making, the specific characteristics of the connected nodes, and the regions hosting them.
The shortcoming of this paper is that the investment strategy mainly considers which ports are the hubs for Chinese terminal operators from the close connection of the routes between ports, and of course, which terminal to invest in is the result of comprehensive consideration in all aspects. Therefore, various factors should be considered in future research, such as the benefits of terminals to local governments and other partners, market trends, shipping network changing design etc.
Author Contributions: L.W. collected and analyzed the data. Y.Z. and L.W. wrote the manuscript. C.D. and F.Z.
edited and revised the paper. All authors read and approved the manuscript.
Funding: This work was supported by Shanghai Social Science Academic Foundation(Grant No.2018BCK010),
National Social Foundation of China(Grant No.16ZDA016), National Natural Science Foundation of China(Grant No.41371140), The MOE Project of Key Research Institute of Humanities and Social Sciences at Universities(Grant No.17JJD790007), The European Research Council under the European Unionʹs Seventh Framework Programme(Grant No.313847). Conflicts of Interest: The authors declare no conflict of interest. References 1. Liu, W.D. Scientific understanding of the Belt and Road Initiative of China and related research themes. Prog. Geogr. 2015, 34, 538–544. (In Chinese) 2. Du, D.B.; Ma, Y.H. One Belt and One Road: The grand geo‐strategy of China’s rise. Geogr. Res. 2015, 34, 1005–1014. (In Chinese) 3. Zheng, L.; Liu, Z.G. Spatial pattern of Chinese outward direct investment in the Belt and Road Initiative area. Prog. Geogr. 2015, 34, 563–570. (In Chinese)
4. Ducruet, C.; Wang, L. China’s global shipping connectivity: Internal and external dynamics in the contemporary era (1890–2016). Chin. Geogr. Sci. 2018, 28, 202–2016.
5. Cheng, W.L.; He, C.T. Game between parties and economic orientation of the Maritime Silk Road. Reform
2014, 3, 74–82. (In Chinese)
6. Huang, M.X.; Jia, X.K. The spatial range, strategic characteristics and development vision of the “21st Century Maritime Silk Road”. SE Acad. Res. 2015, 71–79. Available online: https://wenku.baidu.com/view/352000d2c5da50e2534d7f47.html (accessed on 7 April 2019). (In Chinese)