HAL Id: hal-00328358
https://hal.archives-ouvertes.fr/hal-00328358
Submitted on 23 Jan 2004
HAL is a multi-disciplinary open access
archive for the deposit and dissemination of
sci-entific research documents, whether they are
pub-lished or not. The documents may come from
teaching and research institutions in France or
abroad, or from public or private research centers.
L’archive ouverte pluridisciplinaire HAL, est
destinée au dépôt et à la diffusion de documents
scientifiques de niveau recherche, publiés ou non,
émanant des établissements d’enseignement et de
recherche français ou étrangers, des laboratoires
publics ou privés.
the MINOS campaign (Crete, August 2001)
Jodi Schneider, S. Borrmann, A. G. Wollny, M. Bläsner, N. Mihalopoulos, K.
Oikonomou, J. Sciare, A. Teller, Z. Levin, D. R. Worsnop
To cite this version:
Jodi Schneider, S. Borrmann, A. G. Wollny, M. Bläsner, N. Mihalopoulos, et al.. Online mass
spec-trometric aerosol measurements during the MINOS campaign (Crete, August 2001). Atmospheric
Chemistry and Physics, European Geosciences Union, 2004, 4 (1), pp.65-80. �10.5194/acp-4-65-2004�.
�hal-00328358�
www.atmos-chem-phys.org/acp/4/65/
SRef-ID: 1680-7324/acp/2004-4-65
Chemistry
and Physics
Online mass spectrometric aerosol measurements during the
MINOS campaign (Crete, August 2001)
J. Schneider1, 2, S. Borrmann2, 1, A. G. Wollny3, 4, M. Bl¨asner3, 5, N. Mihalopoulos6, K. Oikonomou6, 7, J. Sciare7,
A. Teller8, Z. Levin8, and D. R. Worsnop9
1Cloud Physics and Chemistry Dept., Max Planck Institute for Chemistry, Mainz, Germany 2Institute for Atmospheric Physics, Johannes Gutenberg University, Mainz, Germany 3ICG-1, Research Center J¨ulich, Germany
4now at: Aeronomy Laboratory, National Oceanic and Atmospheric Administration, Boulder, Colorado, USA 5now at: Hochschule Niederrhein, M¨onchengladbach, Germany
6University of Crete, Heraklion, Crete
7LSCE, Bat 709, CEA Orme des Merisiers, Gif/Yvette, France
8Department of Geophysics and Planetary Sciences, Tel Aviv University, Tel Aviv, Israel 9Aerodyne Research Inc., Billerica, MA, USA
Received: 10 June 2003 – Published in Atmos. Chem. Phys. Discuss.: 25 July 2003 Revised: 18 December 2003 – Accepted: 19 January 2004 – Published: 23 January 2004
Abstract. Mass spectrometric analysis of volatile and semi-volatile (=non-refractory) aerosol particles have been per-formed during a field study in the summer Eastern Mediter-ranean. A size-resolved, quantitative mass spectrometric technique (the Aerodyne Aerosol Mass Spectrometer, AMS) has been used, and the results are compared to filter sam-pling methods and particle sizing techniques. The different techniques agree with the finding that the fine particle mode (D<1.2 µm) consisted mostly of ammonium sulfate and of organic material. The aerosol sulfate ranged between 2 and 12 µg/m3. On most days, ammonium was closely corre-lated with sulfate, suggesting ammonium sulfate as the major aerosol component, but on days with high sulfate mass con-centrations, the sulfate was not fully neutralized by ammo-nium. Trajectories indicate that the aerosol and/or its precur-sors originate from South-Eastern Europe. The source of the ammonium sulfate aerosol is most likely fossil fuel burning, whereas the organic aerosol may also originate from biomass burning. Ion series analysis of the organics fraction in the mass spectrometer indicated that the major component of the organics were oxygenated organics which are a marker for aged, photochemically processed aerosol or biomass burning aerosol. The non-refractory aerosol compounds, measured with the Aerosol Mass Spectrometer, contributed between 37 and 50% to the total aerosol mass in the fine mode. A second mass spectrometer for single particle analysis by laser abla-tion has been used for the first time in the field during this study and yielded results, which agree with filter samples of
Correspondence to: J. Schneider
(schneider@mpch-mainz.mpg.de)
the coarse particle mode. This mode consisted of sea salt particles and dust aerosol.
1 Introduction
The Mediterranean is a region with very high solar intensity during the summer months, leading to high photochemical activity. Together with the influence of polluted air from Eu-rope, this leads to high ozone concentrations over the eastern Mediterranean in summer (Lelieveld et al., 2002; Kouvrakis et al., 2000). Aerosol particles can play an important role in this context, since they can reduce the surface radiation by scattering the incoming solar radiation back to space. It has been proposed by Lelieveld et al. (2002), that these anthro-pogenic aerosols might have an effect on the sea surface tem-perature, followed by a decrease of precipitation in northern Africa.
Several studies investigated origin and effect of aerosol in the Mediterranean. For example, Markowicz et al. (2002) found that the Mediterranean aerosol reduces the sunlight in-tensity at the ground by 17.9 Wm−2. Sciare et al. (2003a), who performed a one-month study in summer 2000 on Crete, identified Central Europe as the major source for black car-bon (BC) and non-sea-salt sulfate (nss-SO4) over the Eastern Mediterranean. Ganor et al. (2000), who investigated anoma-lously high sulfate levels in the Eastern Mediterranean, con-cluded that sulfate production by DMS (Dimethylsulfide) oxidation contributed to no more than 21% to the nss-SO4. Similar results have been found by Mihalopoulos et al. (1997) and Kouvrakis and Mihalopoulos (2002) who
found that the biogenic contribution to the nss-SO4 ranges between 1% and 23%, dependent on season.
Since the optical properties of aerosol particles are depen-dent on their size and composition, a size-resolved chemical analysis is necessary to understand the radiative influence of aerosol particles further. Also, chemical composition of the aerosol particles can give information about origin and for-mation processes of the aerosol. Furthermore, the chemical composition of the aerosol particles influences cloud forma-tion mechanisms.
Quantitative mass spectrometric measurement of various aerosol compounds can be achieved by separated evaporation and ionization with subsequent mass spectrometric analysis of the molecular ions (Jayne et al., 2000). Complementary to this technique, single particle analysis is needed because the mixture state (internal/external) of the aerosol also influences the optical properties (Noble and Prather, 2000). However, the most frequently used single particle analysis method is laser ablation, which is limited in the ability of quantitative determination of the composition within individual ambient aerosol particles (e.g. Gross et al., 2000). Furthermore, the optical detection of the single particles limits the detection range on the lower side at about 100 nm, dependent on the instrument type.
Here we report on mass spectrometric aerosol measure-ments performed during the Mediterranean Intensive Oxi-dant Study (MINOS) in August 2001 at Crete. This cam-paign was dedicated to investigate the anthropogenic contri-butions to the environmental conditions observed over the summer Eastern Mediterranean (Lelieveld et al., 2002). This paper focuses on the chemical composition of the aerosol particles inferred from two mass spectrometric techniques as well as from filter sampling methods. These measurements were accompanied by various other techniques to determine size and number density of the aerosol.
2 Experimental
The measurements have been carried out during the MINOS project at Finokalia, Crete, Greece. This meteorological sta-tion of the University of Crete is located on a hilltop at 35◦240N, 25◦600E, at 150 m above sea level, on the northern coast of Crete (Mihalopoulos et al., 1997). The data collec-tion period of the MINOS campaign lasted from 1 August 2001 until 24 August 2001.
At the meteorological station, the size distribution of aerosol particles with diameters below 200 nm was measured with a TSI 3040 diffusion particle sizer, which includes a TSI 3025 condensation particle counter. Chemical analysis of aerosol particles was performed using a MOUDI (micro orifice uniform deposition impactor) and quartz filter sam-ples with subsequent ion chromatographic analysis. Details of the MOUDI and filter samples can be found in Sciare et al. (2003b).
In a measurement container on a site 30 m below the mete-orological station with a horizontal distance of about 300 m, the following instruments operated by the Cloud Physics and Chemistry Deptartment of the Max Planck Institute for Chemistry and by the Research Center J¨ulich were located: Two optical particle counters (PCS 2000 and PCS 2010, Palas Inc.) to measure the size distribution of particles with diameters larger than 270 nm (PCS 2010) and 330 nm (PCS 2000), a TSI 3025 particle counter to measure the num-ber density of aerosol particles with D>3 nm, as well as two online mass spectrometers for the chemical analysis of the aerosol ensemble and of single particles: The Aerodyne Aerosol Mass Spectrometer (AMS) and the Single Particle Laser Ablation Time-of-flight Mass Spectrometer (SPLAT), both of which will be described below.
The container, which was upwind of the hill during the whole measurement period, had two vertical particle inlets made out of stainless steel with a diameter of 63 mm each, 2 m above the container roof. Ambient air was pumped through these tubes with a flow of 10 m3/h for each inlet. The sample tubes for the aerosol instruments were designed to be near-isokinetic. The tubings to the optical particle counters were made without bends, while it was necessary to include one 90◦-bend before the particles were transmitted into the SPLAT inlet system. The wall losses in a 90◦-bend can be estimated according to Hinds (1999) as the product of the particle Stokes number and the bend angle (π /2) and are smaller than 10% for particles with diameters up to 10 µm at the chosen air flow of 10 m3/h. The inlet flow to the AMS was separated from the 63 mm tube through a stainless steel tube with an inner diameter of 0.15 cm and a length of 1 m. The AMS measured sample rate was nominally 1.4 cm3/s, corresponding to a residence time inside the 0.15 cm tube of 1.3 s. Particle losses were calculated for diffusive, settling, and inertial losses using the formulas given by Hinds (1999). These losses inside the 0.15 cm tube amount to 7% for 50 nm particles and decrease to 0.6% for 1.5 µm particles, a size that represents the upper limit of the AMS inlet transmission.
2.1 The aerosol mass spectrometer (AMS)
2.1.1 General description
Online particle analysis has been carried out starting 16 Au-gust with the Aerodyne Aerosol Mass Spectrometer (AMS). The instrument has been described in detail previously (Jayne at al., 2000; Allan et al., 2003a; Jimenez et al., 2003a), so it will be only briefly reviewed here: Aerosol par-ticles with vacuum aerodynamic diameters between 50 and 1500 nm are focused onto a narrow beam by means of an aerodynamic lens and are separated from the gas by differen-tial pumping. The lens transmission is approximately 100% for particles with size diameters between 80 and 600 nm (see Fig. 9). After a flight distance inside the vacuum cham-ber of 390 mm, the particles are flash-vaporized on a hot
surface (approx. 500–700◦C). This procedure evaporates the
volatile and semi-volatile compounds of the aerosol. The re-maining, non-volatile fraction is usually called “refractory”, so it has become common to refer to the vaporized part as “non-refractory” aerosol fraction (Drewnick et al., 2003). The molecules are ionized by electron impact at an energy of 70 eV and analyzed by a quadrupole mass spectrometer (Balzers QMA 410, rod length 30 cm, rod diameter: 16 mm). Since the evaporation and ionization processes are separated and linear, the instrument can be calibrated and used for quantitative detection of aerosol components like sulfate, ni-trate, ammonium etc. The instrument can be operated in two modes: (1) the mass spectrum mode: The particle beam is constantly analyzed and the whole mass range of the spec-trometer is scanned with a repetition rate of 3 Hz. This mode is used for total chemical composition measurement. (2) the time-of-flight mode: The particle beam is chopped at ca. 100 Hz by a rotating wheel with two slits, and the mass spec-trometer is set onto specific masses, e.g. 30 (NO+) and 46 (NO+2) for nitrate. By triggering the MS with the opening of the chopper, the size selective mass loading of the indi-vidual species can be measured. The chopper mechanism is also used for complete blocking of the beam to determine the gas-phase background. Both modes of operation were used during the MINOS campaign, alternating every 20 s.
2.1.2 Derivation of mass concentrations
In order to infer quantitatively the mass concentrations of the individual aerosol compounds, the AMS needs to be cali-brated in the laboratory. For this purpose, ammonium nitrate has shown to be well-suited. A test aerosol of known size and number concentration is produced by means of an atom-izer, an electrostatic classifier and a particle counter. This test aerosol is introduced into the AMS and the measured ion current of the detected particles is converted to the ionization efficiency (IE) in ions per molecule. This quantity is typi-cally in the order of 10−6ions/molecule for nitrate. Having done so, one can convert the measured ion current into a mass concentration CSby the following equation:
CS =RS 1 I ENO3 MWNO3 NAQ X If, (1)
where P If is the sum of the ion current of the fragment
ions originating from the parent ion, I ENO3 is the ioniza-tion efficiency of nitrate inferred from the calibraioniza-tion proce-dure, Q is the volumetric sample flow into the AMS, MWNO3 is the molecular weight of NO3, NA is Avogadro’s
num-ber and RS is the inverse of the relative ionization
effi-ciency per unit mass of the species compared to the measured
I ENO3/MWNO3 (Allan et al., 2003a, b; Alfarra et al., 2003). If the mass concentrations of the individual species are calcu-lated without the relative ionization efficiency correction RS,
we refer to ”nitrate equivalent” mass concentrations. Since the ionization efficiency of nitrate is determined only from
Table 1. Relative ionization efficiencies and collection efficiencies
applied in the AMS data evaluation in this work.
Species Relative IE collection efficiency Nitrate 1.1 0.5 Ammonium 3.5 0.5 Sulfate 1.15 0.5 Organics 0.71 1
the fragments m/z=30 and 46 (which make up 90% of the total ions produced from nitrate), the relative ionization effi-ciency used to infer the nitrate mass concentration is 1.1.
An additional correction has to be applied due to the de-creasing collection efficiency of non-spherical particles. It has been found that crystalline particles are less well focused as spherical PSL particles by the aerodynamic lens. We used a collection efficiency of one for organics and 0.5 for the other species. This assumes that the liquid, spherical organic aerosol is externally mixed with the internal mixture of am-monium sulfate and amam-monium nitrate aerosol. The reason for this assumption and possible errors induced by it will be discussed in Sect. 3.4. The correction factors applied in this work are summed up in Table 1.
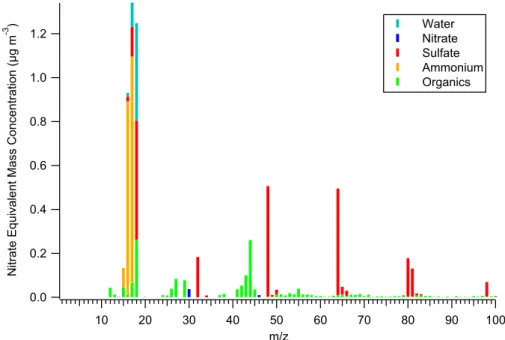
The ionization by electron impact leads to significant frag-mentation of the molecules. In order to infer the fragmenta-tion patterns of the individual species, laboratory measure-ments have been carried out by various users of the AMS. The fragmentation pattern of sulfate and nitrate are described in Hogrefe et al. (2003). These patterns are applied to the peaks of mass spectra measured during field studies to ac-count for the various interferences of different species. This procedure is described in detail by Allan et al. (2003b). As an example, a mass spectrum averaged over the whole MINOS measurement period is shown in Fig. 1. We illustrate the con-cept using the peak at m/z=18: It is composed of ionic sig-nals from air, water, sulfate and organic molecules. The con-tribution of air molecules is inferred from the isotopic ratio of oxygen (18O+), the sulfate contribution is inferred from the laboratory fragmentation pattern (intensities of m/z=48 and
m/z=64 multiplied by 0.67), and so is the organic contribu-tion (equal to the organic contribucontribu-tion to m/z=44, which in turn has to be separated from the gas phase CO2contribution to that peak.) The rest of the intensity of m/z=18 is attributed to water. In the mass spectrum displayed in Fig. 1, the signals from air molecules have been excluded for clarity. Similarly, the isotopic ratios of sulfur leads to the small sulfate peaks at
m/z=50 and 66 (4.62% of the sulfate contribution at m/z=48 and 64, respectively).
1.2 1.0 0.8 0.6 0.4 0.2 0.0 N it ra te E q u iv a le n t M a s s C o n c e n tr a ti o n (µ g m -3 ) 100 90 80 70 60 50 40 30 20 10 m/z Water Nitrate Sulfate Ammonium Organics
Fig. 1. Aerosol spectrum measured with the AMS, averaged over the whole sampling time span (17–23 August 2001). The contributions of
the individual compounds to the peak heights are denoted by the colors. The peaks are scaled to the nitrate equivalent concentration. For details see text.
2.2 The single particle laser ablation time-of-flight mass spectrometer (SPLAT)
The SPLAT instrument was developed by Bl¨asner (2002) and Wollny (2002) for aircraft-based bipolar analysis of single particle composition of particles with diameters larger than 200 nm. The design follows the proposal of Marijnissen et al. (1988) and implements both aerodynamic sizing (Prather et al., 1994) and simultaneous bipolar analysis of a single particle (Hinz et al., 1996).
The particles are transferred through a capillary (250 µm inner diameter) and a differentially pumped system into the vacuum chamber. The formed particle beam crosses two Nd:YAG laser beams both with wavelength 532 nm. The scattered light is detected by two photo multiplier tubes. The measured velocity depends on the aerodynamic diam-eter (continuum conditions inside the capillary) and is used to trigger a pulsed ArF excimer laser with a wavelength of 193 nm. The emitted UV-pulse hits the particle, ablates it and ionizes the fragments in the ion source region of a bipo-lar linear time-of-flight mass spectrometer (TOF-MS). Neg-ative and positive ions are separated and mass selected in the TOF-MS.
3 Results and discussion
Figure 1 gives an average mass spectrum measured with the AMS, averaged over the whole sampling time span (17 Au-gust 2001–23 AuAu-gust 2001). The peaks are scaled to
“ni-trate equivalent mass”, as explained in section 2.1.2. The contributions of the individual compounds to the peaks are denoted by the color scheme. This average spectrum clearly shows that ammonium (m/z=15, 16, 17) and sulfate signals (m/z=32, 48, 64, 80, 81, 96) are dominating. Fragments of sulfate ions also contribute to m/z=16, 17, and 18. Signals from various organic fragments (e.g. m/z=27, 29, 43, 44) are also present, but to a much lesser degree, while nitrate (m/z=30, 46) is almost negligible. Water signals are de-tected, too (m/z=17, 18), but can not be quantified at the present state of AMS instrumental characterization.
3.1 Time series measurements
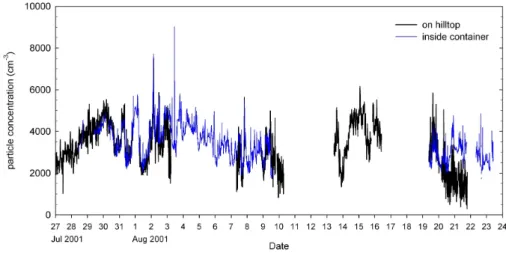
Figure 2 shows the number density of aerosol particles with diameter larger than 3 nm for the whole MINOS time period (1 August 2001–23 August 2001). The plot includes two data sets, both of which were obtained with a TSI conden-sation particle counter model 3025, one sampled air at the container site of MPI/FZJ, the other was operated at the me-teorological station on the hilltop. Most of the time both data sets agree well, with the exception of an episode between 20 and 22 August, when the hilltop CPC detected markedly less particles than the container CPC. The reason for this discrep-ancy is most likely instrumental (e.g. water contamination of the working fluid of the CPC), since the comparison be-tween AMS and MOUDI days yielded good agreement for these days (see Fig. 11). Generally the good agreement be-tween the two CPCs indicates that the horizontal and ver-tical distance between the two stations (≈300 and ≈30 m,
Fig. 2. Total particle number density (D>3 nm) measured with two TSI 3025 condensation particle counters, one inside the MPI/FZJ
container, the other (as part of the diffusion particle sizer) at the station at the hilltop. The particle concentration levels range between 2000 and 6000 particles/cm3, which is very high for a remote region.
14 12 10 8 6 4 2 0 M a s s C o n c e n tr a ti o n (µ g m -3 ) 12:00 17 Aug 2001 18:00 D a t e a n d T i m e ( L o c a l ) 18:00 19 Aug 18:00 18 Aug 12:00 20 Aug 18:00 13:00 21 Aug 18:00 12:00 22 Aug 18:00 12:00 23 Aug 2001 Nitrate Sulfate Ammonium Organics
Fig. 3. Time series of the aerosol mass loading of sulfate, nitrate, ammonium, and organics, measured with the aerosol mass spectrometer
(AMS). Note that the time axis has gaps during the nights, since the instrument was only operative during daytime.
respectively) were small enough to ensure that both stations sample in the same air mass.
The AMS was operational between 17 August and 23 Au-gust 2001. Figure 3 gives the time series of the mass concen-trations of sulfate, nitrate, ammonium and the total “organ-ics” fraction. Here the “organ“organ-ics” fraction is defined as all signals that can not be attributed to the known inorganic sub-stances like sulfate, nitrate, water, ammonium, and chloride. The most abundant aerosol component is sulfate, followed by ammonium and organics. The nitrate content is very low. This finding is most likely due to the high acidification of the aerosol, which means that all ammonium is neutralized by sulfate and no ammonium nitrate can be formed.
Further-more, the high temperatures between 22 and 31◦C do also prevent the formation of ammonium nitrate. The largest vari-ations can be observed in the sulfate concentrvari-ations. The val-ues range between 2 and 12 µg/m3, with smallest values on 17 August and 18 August 2001. These sulfate values repre-sent non-sea-salt sulfate, since the AMS does not collect the coarse mode particles (D>2µm) which contain by far most of the sea salt mass. The contribution of sea salt particles to the fine mode (D<2µm) was found to be only 1% (Lelieveld et al., 2002).
The correlation of sulfate and ammonium is investigated more closely in Fig. 5. The dashed line represents the ra-tio of ammonium and sulfate for pure (NH4)2SO4. On days
Fig. 4. Time series of temperature and relative humidity for the MINOS time period. 5 4 3 2 1 0 A e ro s o l A m m o n iu m (µ g m -3 ) 15 10 5 0 Aerosol Sulfate (µg m-3) pure (NH4)2SO4 20. Aug. 01 21. Aug. 01 23. Aug. 01 5 4 3 2 1 0 A e ro s o l A m m o n iu m (µ g m -3 ) 15 10 5 0 Aerosol Sulfate (µg m-3) pure (NH4)2SO4 22. Aug. 01 5 4 3 2 1 0 A e ro s o l A m m o n iu m (µ g m -3 ) 15 10 5 0 Aerosol Sulfate (µg m-3) pure (NH4)2SO4 17. Aug. 01 18. Aug. 01 19. Aug. 01
Fig. 5. Correlations between sulfate and ammonium for each measurement day. The dotted line represents the ratio for pure ammonium
sulfate.
with low (NH4)2SO4concentrations (17, 18, and 20 August), it appears that all sulfate can be neutralized by ammonium. On days with higher sulfate concentrations, there is excess sulfate (22 August, and to a lesser degree also 19, 21, and 23 August) which means that the aerosol is acidified and, as mentioned above, no ammonium nitrate can be formed.
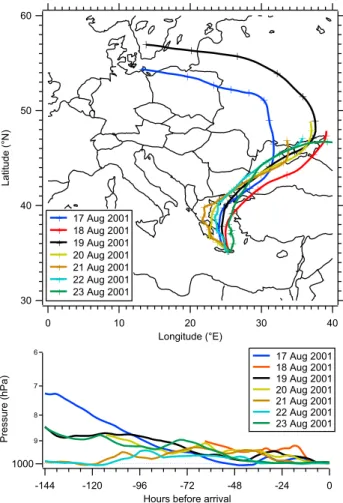
Backward trajectories have been calculated with HYS-PLIT4 (Draxler and Hess, 1997) using FNL data (Stunder, 1997). Figure 6 shows the 6-day backward trajectories for the time span of the AMS measurements (17–23 August 2001). The air masses sampled at Finokalia arrived from the North and have travelled over the Aegean Sea for a time span ranging between 12 h and 3 days, but have crossed a part of Greece and Turkey, and also the Black Sea. If the aerosol originates from anthropogenic emissions it must have spent a considerable time in the atmosphere and may have become processed by photochemistry. The vertical history of the air parcels (lower panel) indicates that the air masses on 21 and 22 August originate from close to the ground, while on the other days, the arriving air masses have descended from higher above. Most likely the high sulfate content
mea-sured on 21 and 22 August is due to emissions from fossil fuel burning north of the Black Sea.
3.2 Size distributions
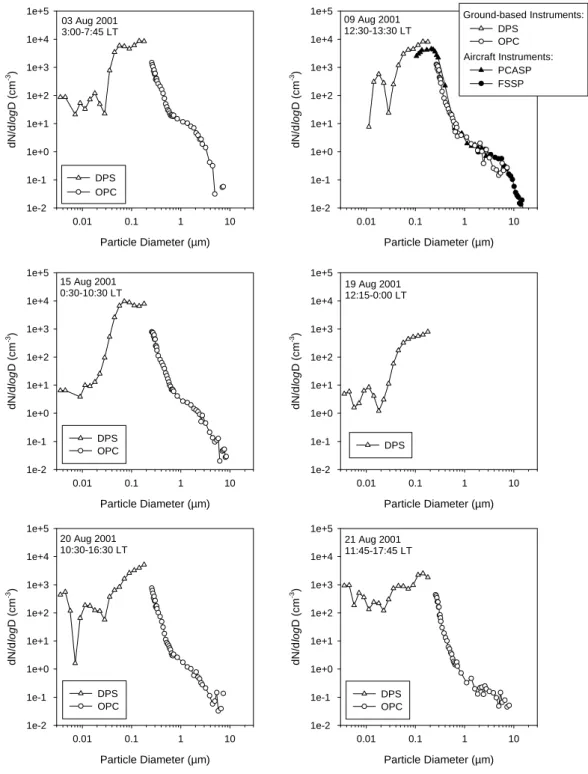
The aerosol size distributions on selected days, measured with various instruments, are shown in Fig. 7. During a fly-by of the Israeli research aircraft “King Air” on 9 August 2001, a comparison of the ground based instruments (two OPCs inside the MPI/FZJ container and the diffusion parti-cle sizer on the hilltop) and two aircraft-based instruments (one PCASP and one FSSP-100) was performed (top right panel in Fig. 7). This comparison yielded good agreement between the instruments. Apparently no major features in the size distribution structure between 200 and 270 nm were missed by the gap between the DPS and OPC size ranges. During the whole measurement period, the maximum of the aerosol number density (about 104cm−3) was observed in the accumulation mode between 100 and 200 nm. Only few particles (<100 cm−3) were detected below 10 nm, from which we conclude that no nucleation took place. Only on
20 August and 21 August 2001, the number density below 10 nm reaches higher values of about 1000 cm−3. On these days, the air masses have spent more time over the Greek continent than over the Aegean Sea. (The corresponding tra-jectories to the measurement days in Fig. 7 are displayed in Fig. 8.)
The coarse mode extends up to about 10 µm. The upper detection limit of the ground based OPCs was 9 µm, and that of the FSSP-100 is 16 µm.
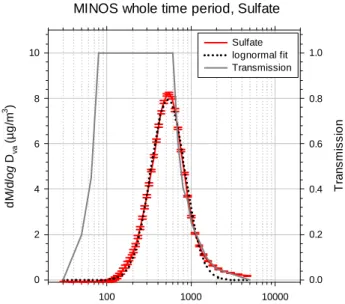
Figure 9 gives the mass size distribution of sulfate, mea-sured with the AMS, averaged over the whole measurement period (17–23 August 2001). The calculated inlet transmis-sion function is also given (Jayne et al., 2000). The sul-fate size distribution has its peak at a modal diameter of ca. 550 nm, and the upper side of the distribution falls into a re-gion where the transmission is below 100%. However, the calculated transmission function is regarded to be too un-certain to use it to correct the measured data. The sulfate size distribution can be approximated with a lognormal fit (D0=526 nm, σ =0.47) which is also shown.
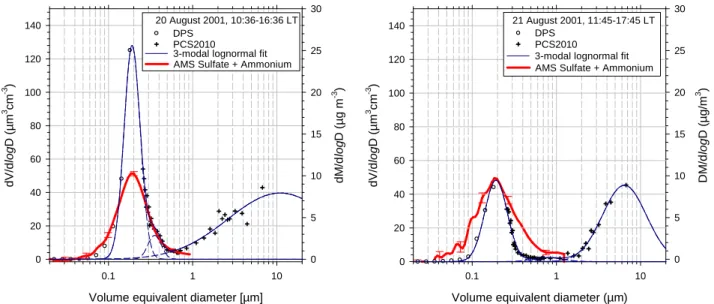
Figure 10 shows the comparison between volume size dis-tributions measured with the DPS, the OPC and the total mass size distribution measured with the AMS obtained on two days, 20 August 2001 (10:36–16:36 local time) and 21 August 2001 (11:45–17:45 local time). All 3 data sets have only been measured simultaneously on these days. The dif-fusion particle sizer measures the diffusive diameter, which is equal to the volume equivalent diameter if the particles are spherical. The optical particle counter is calibrated using the refractive index of PSL particles (1.59). Since the refractive index of the measured particles is not known and calcula-tions of new size calibration funccalcula-tions for the geometry of the PALAS OPC are under way but are not available yet, we did not apply a correction to the size distribution measured with the OPC. We fitted a three-modal lognormal distribution to both the DPS and OPC data sets. These fits indicate an accu-mulation mode with a modal diameter of about 100 nm and a coarse mode with a modal diameter of 10 µm on 20 August and 6.5 µm on 21 August, respectively. The third mode be-tween the accumulation and coarse mode is smaller and play only a minor role. On 20 August the volume concentration of the accumulation mode is larger almost by a factor of three than on 21 August.
The size distributions measured by the AMS have been recalculated to volume equivalent diameter. The relation be-tween the volume equivalent diameter Dv and the
aerody-namic diameter Dain the continuum regime is (McMurry et
al., 2002; Hinds, 1999): Da=Dv s ρp ρ0 1 χ Cc(Dv) Cc(Da) , (2)
where ρpis the density of the particle, ρ0the density of wa-ter (1 g cm−3), χ is the dynamic shape factor, and Cc(D)is
60 50 40 30 L a ti tu d e (° N ) 40 30 20 10 0 Longitude (°E) 17 Aug 2001 18 Aug 2001 19 Aug 2001 20 Aug 2001 21 Aug 2001 22 Aug 2001 23 Aug 2001 6 7 8 9 1000 P re s s u re (h P a ) -144 -120 -96 -72 -48 -24 0 Hours before arrival
17 Aug 2001 18 Aug 2001 19 Aug 2001 20 Aug 2001 21 Aug 2001 22 Aug 2001 23 Aug 2001
Fig. 6. 6-day backward trajectories for the time span between 17
and 23 August 2001, calculated with HYSPLIT using the FNL dataset. Ending point is Finokalia at 12:00. Upper panel: Hori-zontal history (crosses indicate 12 h traveling time), lower panel: vertical history.
the Cunningham slip correction. In the AMS inlet, the accel-eration of the particles occurs in the free molecular regime. Stokes’ law, which is valid only in the continuum regime, can be extended by the Cunningham correction into the free molecular regime (Allan and Raabe, 1982), where Cc(D)
becomes proportional to the inverse of the particle diame-ter D. Thus, the so-called “vacuum-aerodynamic diamediame-ter”
Dvawas introduced (Jimenez et al., 2003b):
Dva=Dv
ρp
ρ0 1
χ. (3)
Defining an effective density
ρeff =
ρp
χ , (4)
which includes the dynamic shape factor, we can match the AMS distribution to the accumulation mode measured with the two other instruments. We applied an effective particle density of 3.2 g cm−3 on 20 August and 2.4 g cm−3 on 21
Particle Diameter (µm) 0.01 0.1 1 10 dN/d log D (cm -3) 1e-2 1e-1 1e+0 1e+1 1e+2 1e+3 1e+4 1e+5 03 Aug 2001 3:00-7:45 LT Particle Diameter (µm) 0.01 0.1 1 10 dN/d log D (cm -3) 1e-2 1e-1 1e+0 1e+1 1e+2 1e+3 1e+4 1e+5 09 Aug 2001 12:30-13:30 LT Particle Diameter (µm) 0.01 0.1 1 10 dN/d log D (cm -3) 1e-2 1e-1 1e+0 1e+1 1e+2 1e+3 1e+4 1e+5 DPS OPC 15 Aug 2001 0:30-10:30 LT Particle Diameter (µm) 0.01 0.1 1 10 dN/d log D (cm -3) 1e-2 1e-1 1e+0 1e+1 1e+2 1e+3 1e+4 1e+5 DPS 19 Aug 2001 12:15-0:00 LT Particle Diameter (µm) 0.01 0.1 1 10 dN/d log D (cm -3) 1e-2 1e-1 1e+0 1e+1 1e+2 1e+3 1e+4 1e+5 DPS OPC 20 Aug 2001 10:30-16:30 LT Particle Diameter (µm) 0.01 0.1 1 10 dN/d log D (cm -3) 1e-2 1e-1 1e+0 1e+1 1e+2 1e+3 1e+4 1e+5 DPS OPC 21 Aug 2001 11:45-17:45 LT OPC DPS FSSP PCASP OPC DPS Aircraft Instruments: Ground-based Instruments:
Fig. 7. Number size distributions measured with the Diffusion Particle Sizer (DPS, TSI-3040) and the Optical Particle Counter (OPC,
PALAS PCS2010), during selected days of the campaign. On 9 August 2001, a comparison with two aircraft based instruments (PCASP, FSSP) during a fly-by of the Israeli King Air research aircraft was performed (top right panel). LT: Local time
August. This effective density refers to the whole aerosol particle, including the refractive and non-refractive material and can therefore be larger than the density of non-refractive aerosol compounds analyzed by the AMS. The broader shape of the mass distribution compared to the volume distribution
may be due to a density distribution of the aerosol ensem-ble. The difference in the volume concentration of the accu-mulation mode between the two days suggest that different air masses and aerosol types were sampled on the two days. Also, the relative humidity on 20 August was 68% while it
60 50 40 30 L a ti tu d e (° N ) 40 30 20 10 0 Longitude (°E) 03 Aug 2001 09 Aug 2001 15 Aug 2001 19 Aug 2001 20 Aug 2001 21 Aug 2001 6 7 8 9 1000 P re s s u re (h P a ) -144 -120 -96 -72 -48 -24 0
Hours before arrival
03 Aug 2001 09 Aug 2001 15 Aug 2001 19 Aug 2001 20 Aug 2001 21 Aug 2001
Fig. 8. 6-day backward trajectories corresponding to the
measure-ments displayed in Fig. 7.
was only 32% on 21 August. Since the mass of sulfate and ammonium that are found in the accumulation mode is al-most the same on the two days, the remaining particles on 20 August must have been composed of other material, e.g. organic or refractory material.
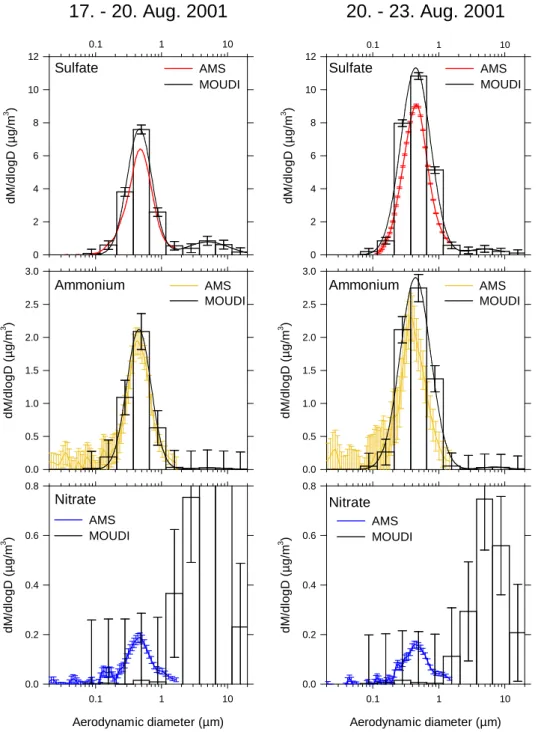
Figure 11 shows the comparison of the chemically speci-ated size distributions of the AMS with the results obtained with the MOUDI. The averaging time of the AMS data have been chosen to match the MOUDI time resolution (17–20 August, 20–23 August). Note that the MOUDI measured continuously and the AMS only during daytime. A bimodal lognormal fit was applied to the MOUDI results in order to facilitate the comparison of the accumulation mode with the AMS data. The size distribution measured by the AMS has been transformed to aerodynamic diameter (as measured by the MOUDI) using Eqs. (2) and (3) with the approximation for the Cunningham slip correction for the transition regime as given by Jimenez et al. (2003b):
Cc≈ 1 + φ
2λ
D, (5)
MINOS whole time period, Sulfate
Vacuum Aerodynamic Diameter (nm)
100 1000 10000 dM/d log Dva (µg/m 3 ) 0 2 4 6 8 10 Transmission 0.0 0.2 0.4 0.6 0.8 1.0 Sulfate lognormal fit Transmission
Fig. 9. Size distribution of sulfate containing particles measured
with the AMS (red line), averaged over the whole operation period. The sulfate mass distribution can be approximated with a lognormal distribution (black line). Also shown is the calculated transmission function of the aerodynamic lens.
where φ=1.549 and λ is the mean free path which is ca. 66 nm at standard conditions (T =20◦C and p=1013 hPa). The result for the aerodynamic diameter Dais:
Da= rρ 0 ρp χ DvaK (6) with K = −q φλ ρ0 ρpχ Dva + v u u t1 + φ2λ2+2φλD va ρ0 ρpχ D 2 va , (7)
Defining the effective density as above Eq. (4), we can match the size distributions by using values for ρeff of 1.2
for the time period 17–20 August and 1.6 for the time period 20–23 August. This is contradictory to the comparison of the AMS size distributions with the DPS and the OPC (Fig. 9). A reason for this finding can not given at the present state of knowledge. The influence of the refractive index on the size distributions measured with the OPC is not expected to be large enough to have significant influence on the size dis-tributions in Figs. 7 and 9. Between 17 and 20 August, the sulfate measured by the AMS amounts to 83% of the sulfate measured by the MOUDI, and the AMS ammonium amounts to 91% of the MOUDI ammonium, while between 20 and 23 August, these ratios were 80% (sulfate) and 71% (am-monium). These values refer to particles with aerodynamic diameters smaller than 1.5 µm. This underestimation by the AMS may be explained by the decreasing transmission for
21 August 2001, 10:15-16:44 LT
Volume equivalent diameter [µm]
0.1 1 10 dV/d log D (µm 3 cm -3 ) 0 20 40 60 80 100 120 140 dM/d log D (µg m -3 ) 0 5 10 15 20 25 30
3-modal lognormal fit AMS Sulfate + Ammonium PCS2010
DPS
20 August 2001, 10:36-16:36 LT
Volume equivalent diameter (µm)
0.1 1 10 DM/d log D (µg/m 3 ) 0 5 10 15 20 25 30 dV/d log D (µm 3 cm -3 ) 0 20 40 60 80 100 120 140
AMS Sulfate + Ammonium DPS
PCS2010
3-modal lognormal fit 21 August 2001, 11:45-17:45 LT
Fig. 10. Comparison between volume size distributions measured with the DPS, the OPC, and the sum of the sulfate and ammonium mass
size distributions measured with the AMS. Left panel: 20 August 2001, right panel: 21 August 2001. Only for these days all 3 data sets have been measured simultaneously. The volume distributions measured by the DPS and the OPC can be reproduced by a 3-modal lognormal fit. To match the AMS distribution with the other data, an effective density of 3.2 and 2.4, respectively has been applied.
particle with diameters larger than 600 µm (see Fig. 9). How-ever, as mentioned above, since the transmission function is only calculated and not quantitatively measured yet, we do not intend to correct the data with this transmission function. The accuracy of the filters used by the MOUDI is not high enough to detect nitrate in these small amounts, as indicated by the error bars. The AMS can not detect the nitrate con-tained in particles with diameters larger than about 1.5 µm, a fact that makes both methods complementary to each other. The single mass spectrometer SPLAT, which is able to detect particles larger than 1 µm, is not quantitative and will also benefit from an additional size selective, quantitative method.
3.3 Ion series analysis of the organic compounds
Although the “organics” fraction of the AMS can not be re-solved into specific components, it is possible to retrieve in-formation about certain groups of organic species, by means of the so-called ion series analysis, or 1-analysis (McLaf-ferty and Turecek, 1993). For this technique it is assumed that the organic molecules consist of a functional group R with CH2chains attached. Fragmentation is assumed to lead only to the strip-off of CH2units. Hence, the mass peaks at which the fragments appear are a function of the functional group, and fragments separated by m/z=14 can be classified into one 1-group.
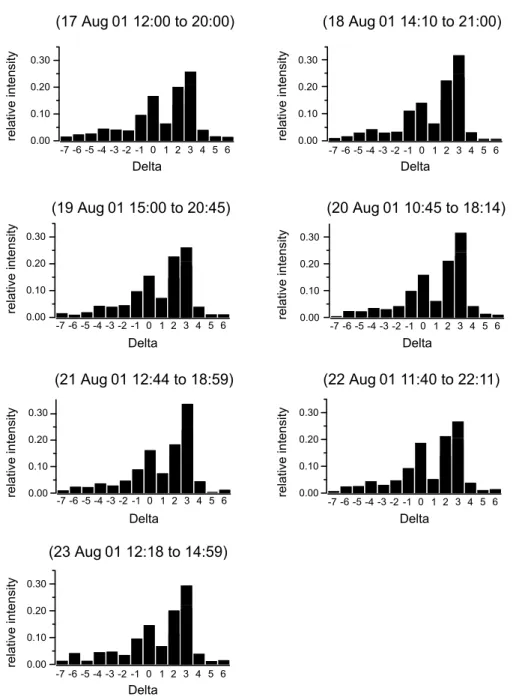
The 1 values are defined as 1=peak mass–14n+1, with n being the maximum possible number of Carbon atoms re-maining on the functional group. The applicability of this technique to aerosol mass spectrometer data has been shown by Drewnick et al. (2003). Certain 1-groups could
previ-ously be identified as signatures of certain types of organic particles, e.g. 1=0, 2: traffic related aerosol, 1=3: oxy-genated aerosol, 1 = −3... − 7: aromatics (Drewnick et al., 2003). The present data have been analyzed by this tech-nique in a day-by-day basis. The results are given in Fig. 12, where the relative contribution of each 1-group to the total organic fraction for each day is displayed. It can be clearly be seen that the 1-group 3 is the largest, but the 1-groups 0 and 2 play a significant role as well. Oxygenated organic aerosol compounds are thought to be formed either by photo-chemically processed precursor gases or directly by biomass burning. Sciare et al. (2003b) conclude that 2/3 of the or-ganic carbon in the aerosol originates from biomass burning. On the other hand, it can not be ruled out that a large fraction of the aerosol precursor gases originates from South-East Europe and has been photochemically processed during the travel over the Mediterranean Sea. It is very likely that both sources (pollution from Eastern Europe and biomass burn-ing) contribute to the high aerosol number density measured during the campaign. The fact that the 1-groups 0 and 2 are also present suggests that these groups are not only an indi-cator for traffic, but also for industrial emissions in general.
The ratio of 1-group 3 to 1-group 2 is high on 18, 20, 21 and 23 August 2001, while it is lower on 17, 19, and 22 August 2001. The backward trajectories (Fig. 6) reveal that the air masses that arrived at Finokalia on 17, 19, and 23 August descended from higher altitudes, but this does not correspond completely to the days with a low 13 to 12 ra-tio. Another finding is that the air masses that arrived at Fi-nokalia on 20 and 21 August 2001 have travelled a longer
0.1 1 10 dM/dlogD (µg/m 3 ) 0 2 4 6 8 10 12 Aerodynamic diameter (µm) 0.1 1 10 dM/dlogD (µg/m 3 ) 0.0 0.2 0.4 0.6 0.8 dM/dlogD (µg/m 3 ) 0.0 0.5 1.0 1.5 2.0 2.5 3.0
17. - 20. Aug. 2001
dM/dlogD (µg/m 3 ) 0 2 4 6 8 10 12 0.1 1 10 dM/dlogD (µg/m 3 ) 0.0 0.5 1.0 1.5 2.0 2.5 3.0 Aerodynamic diameter (µm) 0.1 1 10 dM/dlogD (µg/m 3 ) 0.0 0.2 0.4 0.6 0.820. - 23. Aug. 2001
Ammonium Nitrate Sulfate Ammonium Nitrate AMS MOUDI AMS MOUDI AMS MOUDI MOUDI AMS Sulfate AMS MOUDI AMS MOUDIFig. 11. Comparison between size distributions of individual chemical components of the aerosol particles between AMS and MOUDI. Left:
Average 17–20 August 2001; right: average 20 August–23 August 2001. To match the AMS distribution with the MOUDI data, an effective density of 1.2 and 1.6, respectively, had to be applied.
distance over the Greek continent than over the Aegean Sea. As already mentioned in Sect. 3.2, these differences in the geographical origin is reflected by the size distribution of these two days (Fig. 7): The number concentration on the lower end of the distribution is higher on 20 and 21 August 2001 (between 100 and 1000 cm−3) while on the other days, there are only below 10–100 cm−3 in this size range. The ratio between 1-group 3 and 2 is larger (1.68±0.15) on av-erage on 20 and 21 August than the avav-erage on the other
analyzed days (1.31±0.12). If this finding is somehow re-lated to the air mass history and the higher number density of small aerosol particles, can not be answered definitely. For comparison of the 1-analysis results with previous measure-ments, Drewnick et al. (2003) found a ratio between 1-group 3 and 2 of about 0.7 during a field study in New York City where it is not surprising that traffic related organics aerosol is dominating.
(22 Aug 01 11:40 to 22:11) -7 -6 -5 -4 -3 -2 -1 0 1 2 3 4 5 6 0.30 0.20 0.10 0.00 re la ti v e i n te n s it y Delta (19 Aug 01 15:00 to 20:45) -7 -6 -5 -4 -3 -2 -1 0 1 2 3 4 5 6 0.30 0.20 0.10 0.00 Delta re la ti v e i n te n s it y (17 Aug 01 12:00 to 20:00) -7 -6 -5 -4 -3 -2 -1 0 1 2 3 4 5 6 0.30 0.20 0.10 0.00 Delta re la ti v e i n te n s it y (18 Aug 01 14:10 to 21:00) -7 -6 -5 -4 -3 -2 -1 0 1 2 3 4 5 6 0.30 0.20 0.10 0.00 Delta re la ti v e i n te n s it y (20 Aug 01 10:45 to 18:14) -7 -6 -5 -4 -3 -2 -1 0 1 2 3 4 5 6 0.30 0.20 0.10 0.00 Delta re la ti v e i n te n s it y (21 Aug 01 12:44 to 18:59) -7 -6 -5 -4 -3 -2 -1 0 1 2 3 4 5 6 0.30 0.20 0.10 0.00 Delta re la ti v e i n te n s it y -7 -6 -5 -4 -3 -2 -1 0 1 2 3 4 5 6 0.30 0.20 0.10 0.00 re la ti v e i n te n s it y Delta (23 Aug 01 12:18 to 14:59)
Fig. 12. Ion series analysis of the organics fraction measured with the AMS. The dominating 1-group is 1=3 for all days, supporting the
conclusion that the aerosol particles contained oxygenated organics which are an indicator for biomass burning or aged aerosol.
3.4 Comparison of mass concentrations
Average mass concentrations of the individual components measured with the AMS, the MOUDI, and the IC analyses of the quartz filter samples are given in Table 2. For details of the MOUDI and filter analyses see Sciare et al. (2003b). The AMS and filter data have been averaged over the MOUDI sampling intervals: 17 August 2001, 16:45–20 August 2001, 9:30, and 20 August 2001, 11:15–23 August 2001, 13:15. Only fine mode data (D<1.2 µm) were considered for the MOUDI and filter data. The AMS inlet transmission (see
Fig. 9) decreases from 100% at about 600 nm down to about 10% at 1.2 µm, which means that the AMS measures only the fine mode aerosol, but will underestimate slightly the fine mode mass. For the first sample time interval, the values for sulfate and ammonium agree within their error limits. For the second interval, the MOUDI yields markedly higher values for sulfate and ammonium (33% and 32% compared to the AMS, respectively). However, it has to be considered that the AMS was only operative during daytime and therefore the AMS data do not represent exactly the same averaging intervals as the MOUDI and filter data. The IC results from
Table 2. Comparison of fine mode (<1.2 µm) mass concentrations measured with different techniques: mass spectrometer, MOUDI and
filter with GC analysis. The AMS data and the filter data have been averaged to match the MOUDI sample periods. Note that the MOUDI and filter analyses included more compounds than sulfate, nitrate, and ammonium, which are not shown in this table. For details of the MOUDI and filter results see Sciare et al. (2003b).
Mass concentration (µg/m3) AMS MOUDI Filters 17–20 August 2001 Sulfate 3.73±1.23 3.61±0.11 6.33±1.90 Ammonium 1.12±0.25 0.99±0.11 2.10±0.65 Nitrate 0.10±0.004 0.008±0.11 0.08±0.03 Organics (sum) 1.32±0.16 – 5.67±0.58 Total 6.27±1.27 12.45±0.11 16.65±3.19 20–23 August 2001 Sulfate 4.63±0.57 6.18±0.09 7.95±2.83 Ammonium 1.23±0.07 1.62±0.09 2.41±0.65 Nitrate 0.08±0.01 0.009±0.09 0.09±0.06 Organics (sum) 1.05±0.09 – 5.32±0.26 Total 6.99±0.58 16.36±0.09 18.83±3.72
the filters samples yield a markedly higher content of ammo-nium sulfate for both sampling intervals compared to both the AMS and the MOUDI. All three methods agree that the nitrate content was about 0.1 µg/m3. The sum of organics measured by the AMS and obtained from the filters differs markedly: The AMS yields only 20–25% of the filter results. We assumed that the organic aerosol was externally mixed with the sulfate aerosol and therefore used a collection ef-ficiency of 1 (see Sect. 2.1.2 and Table 1). If the organic aerosol would also be sampled with an efficiency of 0.5, the calculated organic mass concentrations have to be multiplied with a factor of 2. However, if the organic aerosol and the ammonium sulfate aerosol were internally mixed, the collec-tion efficiency would probably be higher than 0.5 since the particles will be less irregular shaped than pure ammonium sulfate crystals. Furthermore, it is conceivable that the ion-ization efficiency of individual organics in the AMS is not known well enough. As described in Allan et al. (2003a), the relative ionization efficiency of organic substances varies for different types of organics in a range of 0.5 to 0.7.
Summarizing, the organic mass concentration measured by the AMS might have to be corrected by an unknown fac-tor between 1 and 2. Still, a facfac-tor of 2 would lead only to an measured AMS organics fraction of 40–50% compared to the filter results (Table 2).
It might be conceivable that the filters sample some frac-tion of the gas phase organic as well as particulate ganic. Such artifacts due to the absorption of gas-phase or-ganic compounds on the sample substrate were minimized by heating filters for 20 min at 60◦C prior to the 2-step thermal/thermo-optical analysis. However, such artifacts do not impact significantly the determination of the light absorb-ing material of the aerosol (one of the major concerns of the
MINOS campaign). Very good agreement for black and to-tal carbon concentrations was obtained between the quartz bulk filters and the DEKATI cascade impactor samples which have been collected throughout the campaign (Sciare et al., 2003c). The slope close to 1 found between the two sampling techniques – with all data points lying within a 10% errors in mass concentrations – suggests that sampling artifacts, which are not corrected by the pre-treatment at 60◦C, did not affect significantly the whole organic carbon mass concentration of the samples. Such conclusion reinforces the ability of the measurements to be used for the mass closure experiments of sub micron aerosols as performed by Sciare et al. (2003c) during the MINOS campaign.
Comparison of the total mass concentrations of the non-refractory aerosol detected by the AMS and the total aerosol mass measured by the MOUDI and the filters yields ratios between 0.37 and 0.5. This ratio of non-refractory mass and total aerosol mass lower than that observed by Drewnick et al. (2003) who measured a fraction of about 64% detected with the AMS during a campaign in New York City. This undetected mass does most likely consist of refractory mate-rial, e.g. mineral dust or black carbon, which does not evapo-rate at the heater temperature. However, Sciare et al. (2003b) found that black carbon contributed only 22% to the total car-bon (12–23 August 2001), while it would require about 68% to close the mass balance in Table 2. Other refractory mate-rial, like mineral dust and fly ash, contributed only to about 10% of the fine aerosol mass (Lelieveld et al., 2002). Thus, the large difference between the mass measured and the filter sampled remains unresolved.
-70 -60 -50 -40 -30 -20 -10 0 Ion Signal [mV] 110 100 90 80 70 60 50 40 30 20 10 0 m/z Na+ Mg+ Ca+ K+ Na2Cl + -40 -30 -20 -10 0 Ion Signal [mV] 110 100 90 80 70 60 50 40 30 20 10 0 m/z Al+ Ca+ * * * * * Si+ K+
Fig. 13. Two mass spectra obtained with the SPLAT instrument on 13 August 2001. Upper panel: sea salt particle (NaCl), Daero=2.9 µm;
lower panel: mineral dust particle, Daero=2.1 µm.
3.5 Single particle analyses of the large particle fraction
The single particle mass spectrometer (SPLAT) was oper-ated during the MINOS campaign in a preliminary state of development. A detailed discussion of the instrumental char-acteristics, data extraction and first results is carried out in Wollny (2002). During almost 10 h operation time on several days 1062 single particles were detected. A small fraction of these particles (size range between 1 and 5 µm) was hit by the ionization laser. Mass spectra of positive ions have been obtained for 57 single particles. The detector for the negative ions could not be operated successfully due to a high voltage power supply failure. Most of the particles (51) contained elemental ions from mineral aerosol in the mass spectra, like Ca+, Al+, Fe+, Ni+, Co+, and partly also Na+and Mg+. A typical mass spectrum from this “mineral aerosol” group is displayed in the upper panel of Fig. 13. Only two particles have led to spectra that could be interpreted as sea salt par-ticles. One of them is shown in the lower panel of Fig. 13. Kievit (1995) has shown in laboratory studies the presence
of Na2Cl+-cluster in mass spectra of laser ablation of NaCl-particles. The remaining mass spectra could not be clearly identified. Possible components include ammonium sulfate or soot. The SPLAT measurements indicate that during the operation time most of the analyzed particles in the coarse mode were mineral aerosols. This conclusion agrees with the results from the MOUDI and the IC analysis of the fil-ter samples, which yielded 46% dust and 25% sea salt/nitrate (MOUDI), and 42% dust and 36% sea salt/nitrate (filters). These dust particles have been found to be not of local but mainly regional origin (Sciare et al., 2003c).
4 Summary and conclusions
We have measured microphysical and chemical aerosol prop-erties with various analytical methods: mass spectrometers, filter samples, optical particle counters, nucleation particle counters, and a diffusion sizer during a field study in the East-ern Mediterranean. The Aerosol Mass Spectrometer (AMS) found the non-refractory fine mode aerosol (with diameters
smaller than about 1 µm) to be composed of 77–84% ammo-nium sulfate and between 15 and 21% organic material. The nitrate content was below 2%. The non-refractory aerosol components made up to between 37 and 50% of the total aerosol mass in the fine mode.
From the composition of the submicron aerosol it can be concluded, that the aerosol (or, more precisely, its precursor gases) is mainly of anthropogenic origin. The high amount of ammonium sulfate suggests fossil fuel burning in South-Eastern Europe as the major sources. This finding is in ex-cellent agreement with previous studies (Ganor et al., 2000; Sciare et al., 2003a; Kouvrakis and Mihalopoulos, 2002), who also found that anthropogenic sources are responsible for the high amount of sulfate in the Eastern Mediterranean in summer. The high contribution of oxygenated hydrocar-bons in the organic fraction of the aerosol (the 1-3 group in the mass spectra) may indicate that part of the aerosol origi-nates from biomass burning, but can also be an indicator for aerosol formed from photochemically aged precursor gases. The latter is not unlikely, because the aerosol must have spent between 12 and 60 h in the atmosphere before being ana-lyzed at the Finokalia station. Considering the high solar intensity in the summer Mediterranean, photochemical con-version must have occurred if the emissions originate from the South-Eastern European continent and were transported to Crete. The absence of high number concentrations in the ultrafine particle mode (below 100 nm) during most of the time also indicates that the conversion of the precursor gases into the aerosol phase has already occurred and that no fresh nucleation took place shortly before the measurements.
Comparison of the data from the new mass spectrometer technique (AMS) with the results of the MOUDI fine mode (<1.2 µm) yielded fairly good agreement of both absolute mass concentrations and size distributions for sulfate and am-monium. The data measured with the 12-hour filter samples for the fine mode (<1.2 µm) yielded a higher for ammonium sulfate mass concentration than the AMS and the MOUDI data. All three methods agree with the finding that the nitrate mass concentration was in the order of 0.1 µg/m3.
The single particle instrument (SPLAT) produced results that qualitatively agree with the filter and MOUDI results for the coarse mode: This mode was mainly composed of sea salt and mineral dust. The number of single particle spectra obtained during this campaign was very small, which was mostly due to problems with the inlet system and the optical detection of the particles.
The combination of established (MOUDI, filter sam-ples, OPCs, CPCs) and new instrumental techniques (AMS, SPLAT) as it was used during the MINOS project offers the possibility to gain new insight into the chemical composition and size distribution of submicron and supermicron aerosols. The two mass spectrometric techniques are complementary in their size range and in their ability to measure quantita-tively bulk aerosol and qualitaquantita-tively single particles, but both offer a high time resolution compared to other size-selective
and quantitative methods that rely on filter samples. It is en-couraged to use a combination of instruments as it was used during MINOS for future aerosol studies.
Acknowledgements. We would like to thank T. B¨ottger for
techni-cal support during the campaign, M. de Reus and P. Petsalakis for the organization of the MINOS campaign, J. D. Allan and all con-tributors for the AMS evaluation software, F. Drewnick for discus-sion about the ion series analysis, and C. Schiller for the use of the FZJ/ICG-1 measurement container.
References
Alfarra, M. R., Coe, H., Allan, J. D., Bower, K. N, Boudries, H., Canagaratna, M. R., Jimenez, J. L., Jayne, J. T., Garforth, A., Li, S.-M., and Worsnop, D. R.: Characterization of urban and regional organics aerosols in the Lower Fraser Valley using two Aerodyne aerosol mass spectrometers, submitted to Atm. Env., 2003.
Allan, J. D., Jimenez, J. L., Coe, H., Bower, K. N., Williams, P. I., and Worsnop, D. R.: Quantitative Sampling Using an Aero-dyne Aerosol Mass Spectrometer, Part 1: Techniques of Data Interpretation and Error Analysis, J. Geophys. Res., 108, 4090, doi:10.1029/2002JD002358, 2003a.
Allan, J. D., Coe, H., Bower, K. N., Alfarra, M. R., Delia, A. E., Jimenez, J. L., Middlebrook, A. M., Drewnick, F., Onasch, T. B., Canagaratna, M. R., Jayne, J. T., and Worsnop, D. R.: Technical note: Extraction of chemically resolved mass spectra from Aero-dyna aerosol mass spectrometer data, submitted to J. Aerosol Sci., 2003b.
Bl¨asner, M.: Entwicklung eines bipolaren flugzeuggetragenen Aerosolmassenspektrometers, Ph. D.thesis (in German), Univer-sity Bonn, Germany, 2001.
Draxler, R. R. and Hess, G. D.: Description of the HYSPLIT 4 modeling system, NOAA Tech. Memo., ERL ARL-224, Matl. Oceanic and Atmos. Admin. Washington D.C., 1997.
Drewnick, F., Schwab, J. J., Jayne, J. T., Canagaratna, M., Worsnop, D. R., and Demerjian, K. L.: Measurement of Ambient Aerosol Composition during the PMTACS-NY 2001 using an Aerosol Mass Spectrometer, Part I: Mass Concentrations, Aer. Sci. Techn., in press, 2003.
Ganor, E., Foner, H. A., Bingemer, H. G., Udisti, R., and Setter, I.: Biogenic sulfate generation in the Mediterranean Sea and its contribution to the sulfate anomaly in the aerosol over Israesl and the Eastern Mediterranean, Atm. Env., 34, 3453–3462, 2000. Gross, D. S., G¨alli, M. E., Silva, P. S., und Prather, K. A.:
Rela-tive sensitivity factors for alkali metal and ammonium cations in single-particle aerosol time-of-flight mass spectra, Anal. Chem., 72 , 416–422, 2000.
Hinds, W. C.: Aerosol Technology: Properties, Behavior, and Mea-surement of Airborne Particles, 2. Edition, John Wiley & Sons, Inc., New York, 1999.
Hinz, K.-P., Kaufmann, R., und Spengler, B.: Simultaneous detec-tion of positive and negative ions from single airborne particles by real-time laser mass spectrometry, Aerosol Science and Tech-nology, 24, 233–242, 1996.
Hogrefe, O., Drewnick, F., Lala, G. G., Schwab, J. J., and De-merjian, K. L.: Development, Operation and Applications of an
Aerosol Generation, Calibration and Research Facility, Aer. Sci. Techn., in press, 2003.
Jayne, J. T., Leard, D. C., Zhang, X., Davidovits, P., Smith, K. A., Kolb, C. E., and Worsnop, D. R.: Development of an aerosol mass spectrometer for size and composition analysis of submi-cron particles, Aerosol Sci. Technol., 33, 49–70, 2000.
Jimenez, J. L., Jayne, J. T., Shi, Q., Kolb, C. E., Worsnop, D. R., Yourshaw, I., Seinfeld, J. H., Flagan, R. C., Zhang, X., Smith, K. A., Morris, J., and Davidovits, P.: Ambient Aerosol Sampling with an Aerosol Mass Spectrometer. J. Geophys. Res., 108, 8425, doi:10.1029/2001JD001213, 2003a.
Jimenez, J. L., Bahreini, R., Cocker, D. R., Zhuang, H., Varut-bangkul, V., Flagan, R. C., Seinfeld, J. H., O’Dowd, C. D., and Hoffmann, Th.: New particle formation from photooxida-tion of diiodomethane (CH2I2) J. Geophys Res., 108, 4318,
doi:10.1029/2002JD002452, 2003b.
Kouvrakis, G., Tsigaridis, K., Kanakidou, M., and Mihalopoulos, N.: Temporal variations of surface regional background ozone over Crete Island in the Southeast Mediterranean, J. Geophys. Res., 105, 4399–4407, 2000.
Kouvrakis, G. and Mihalopoulos, N.: Seasonal variation of dimethylsulfide in the gas phase and of methanesulfonate and non-sea-salt sulfate in the aerosols phase in the Eastern Mediter-ranean atmosphere, Atm. Env., 36, 929–938, 2002.
Kievit, O.: Development of a laser mass spectrometer for aerosols, Ph.D. thesis, Technical University Delft, The Netherlands, 1995. Lelieveld, J., Berresheim, H, Borrmann, S., et al.: , Global air pollu-tion crossroads over the Mediterranean, Science, 298, 794–799, 2002.
Marijnissen, J. B., Scarlett, B., and Verheijen, P.: Proposed online aerosol analysis combining size determination, laser-induced fragmentation and time-of-flight mass spectroscopy, J. Aerosol Sci., 19, 1307–1310, 1988.
Mihalopoulos, N., Stephanou, E., Kanakidou, M., Pilitsidis, S., and Bousquet, P.: Tropospheric aerosol ionic composition in the Eastern Mediterranean region, Tellus 49B, 314–326, 1997.
McLafferty, F. W. and Tureck, F.: Interpretation of mass spectra, University Science Books, Sausalito, Ca, 1993.
Markowicz, K. M., Flatau, P. J., Ramana, M. V., Crutzen, P. J., and Ramanathan, V.: Absorbing mediterranean aerosols lead to a large reduction in the solar radiation at the surface, Geophys. Res. Lett., 29(20), 1968, doi:10.1029/2002GL015767, 2002. Noble, C. A. and Prather, K. A.: Real-time single particle mass
spectrometry: A historical review of a quarter century of the chemical analysis of aerosols, Mass Spectr. Rev., 19, 248–274, 2000.
Prather, K. A., Nordmeyer, T., and Salt, K.: Real-time character-ization of individual aerosol particles using time-of-flight mass spectrometry, Analytical Chemistry, 66, 1403–1407, 1994. Sciare, J., Bardouki, H., Moulin, C., and Mihalopoulos, N.: Aerosol
sources and their contribution to the chemical composition of aerosols in the Eastern Mediterranean Sea during summertime, Atmos. Chem. Phys., 3, 291–302, 2003a.
Sciare, J., H. Cachier, K. Oikonomou, P. Ausset, R. Sarda-Est`eve, and N. Mihalopoulos, Characterization of carbonaceous aerosols during the MINOS campaign in Crete, July–August 2001: a multi-analytical approach, Atmos. Chem. Phys., 3, 1743–1757, 2003b.
Sciare, J., Oikonomou, K., Maenhaut, W., Sarda-Est`eve, R., Cachier, H., and Mihalopoulos, N.: Chemical mass closure of size-resolved aerosols during the MINOS campaign in Crete Isl., to be submitted to Atmos. Chem. Phys. Discuss., 2003c. Stunder, B. J. B.: NCEP Model Output – FNL ARCHIVE DATA,
TD-6141, National Climatic Data Center (NCDC), http://www. arl.noaa.gov/ss/transport/archives.html, 1997.
Wollny, A. G.: Entwicklung eines bipolaren Flugzeitmassenspek-trometers zur Analyse der chemischen Zusammensetzung von individuellen Aerosolpartikeln, Ph. D. thesis (in German), Uni-versity Bonn, Germany, 2002.
Zhang, X., Smith, K. A., Worsnop, O. R., Jimenez, J., Jayne, J. T., and Kolb, Ch. E.: A Numerical Characterization of Parti-cle Beam Collimation by an Aerodynamic Lens-Nozzle System: Part I. An Individual Lens or Nozzle, Aerosol Sci. Techn. 36, 617–631, 2002.