HAL Id: cea-01845618
https://hal-cea.archives-ouvertes.fr/cea-01845618v2
Submitted on 19 Dec 2019HAL is a multi-disciplinary open access archive for the deposit and dissemination of sci-entific research documents, whether they are pub-lished or not. The documents may come from teaching and research institutions in France or abroad, or from public or private research centers.
L’archive ouverte pluridisciplinaire HAL, est destinée au dépôt et à la diffusion de documents scientifiques de niveau recherche, publiés ou non, émanant des établissements d’enseignement et de recherche français ou étrangers, des laboratoires publics ou privés.
review of thermodynamic data in NaCl and NaClO_4
media, and a new determination of Eu-adipate
complexation constant in 0.5 mol.kg_w
−1NaClO_4
medium by time-resolved luminescence spectroscopy
Elodie Fromentin, Pascal E. Reiller
To cite this version:
Elodie Fromentin, Pascal E. Reiller. Influence of adipic acid on the speciation of Eu(III): review of ther-modynamic data in NaCl and NaClO_4 media, and a new determination of Eu-adipate complexation constant in 0.5 mol.kg_w−1 NaClO_4 medium by time-resolved luminescence spectroscopy. Inorgan-ica ChimInorgan-ica Acta, Elsevier, 2018, 482, pp.588-596. �10.1016/j.Inorgan-ica.2018.06.035�. �cea-01845618v2�
data in NaCl and NaClO
4media,
and a new determination of Eu-adipate
complexation constant in 0.5 mol.kg
w-1NaClO
4medium by time-resolved
luminescence spectroscopy
E
LODIEF
ROMENTINDen – Service d’Études du Comportement des Radionucléides (SECR), CEA, Université Paris-Saclay, F-91191 Gif-sur-Yvette, France
PASCAL E.REILLER
Den – Service d’Études Analytiques et de Réactivité des Surfaces (SEARS), CEA, Université Paris-Saclay, F-91191 Gif-sur-Yvette, France
http://dx.doi.org/10.1016/j.ica.2018.06.035
ABSTRACT
The complexation of Eu(III) by adipic acid — AdipH2, hexane-1,6-dioic acid —, one of the
major hydro-soluble degradation products (HDPs) from radio-oxidized polyesterurethane, is investigated by time-resolved luminescence spectroscopy (TRLS) in NaClO4 ionic medium (0.5 mol.kgw-1). The solubility and deprotonation constants of adipic
acid, as well as specific interaction theory (SIT) coefficients of aqueous AdipH2(aq) and
adipate ions (AdipH– and Adip2–) were estimated using available literature data in NaCl
and NaClO4 ionic media. A 1:1 (EuAdip+) complex is evidenced in TRLS with log10β(0.5 m)
= 2.09 ± 0.16. Using reaction constant at another NaClO4 ionic strength from literature,
the logarithm of reaction constant log10β° = 3.88 ± 0.40 at 0 ionic strength and specific ion
parameter (EuAdip+,ClO 4
−) = (0.10 ± 0.40) kg
w.mol-1 is estimated. This implies that adipic
acid can control the Eu(III) speciation from mildly acidic to mildly basic conditions, but not in highly basic solutions characteristic of cementitious interstitial waters.
Keywords
1. INTRODUCTION
The knowledge of interactions between radionuclides and organic contaminants issued from radio-oxidized polymer is crucial for assessing the mobility of radionuclides in different environments near potential nuclear waste geological repositories [1]. Polymer waste are generated during exploitation, maintenance, and dismantling of nuclear fuel cycle facilities [2], as e.g. gloves, filters, seals, cables, windows of glove-boxes, or ion exchange resins. These polymers are considered to be placed in intermediate level long-lived (ILW-LL) waste cemented packages where they will be degraded by radio-oxidation because of the presence of radionuclides and dioxygen. Consequently, studies on the characterization of the degradation products issued either from hydrolysed polymers [3-5] or from hydrolysed radio-oxidized polymers were led to identify the main constituents [6-9].
In the case of degradation products of cellulose, iso-saccharinic acid was recognized as a strong complexing agent — see references [10,11] and references therein. In the case of radio-oxidized ion exchange resins, oxalic acid was identified but a pool of unidentified ligand was also evidenced [6,7]. In the case of polyesterurethane, used in gloves for glove boxes, adipic acid — hexane-1,6-dioic acid, noted afterwards AdipH2(aq), structure
shown on Fig. 1 — was shown to be the main hydro-soluble degradation product (HDP). As ions from a dicarboxylic acid, adipate ions are able to complex trivalent f-transition elements [12] such as Eu(III) [13] — analogue of 5f actinides(III) such as Cm(III) and Am(III) for the complexation by oxygen containing molecules [14]. Eu(III) is showing interesting luminescent properties that makes it suitable for both complexation studies and chemical environment probing by time-resolved luminescence spectroscopy (TRLS),[13,15-20] including complex organic mixtures [21-23].
Fig. 1. Structure of AdipH2.
The assessment of the extent of complex formation by the organic ligands identified in HDPs requires thermodynamic data both on protonation constants for these ligands, as well as on complexation with radionuclides, including the account of ionic strength in the case of cemented waste packages. The most advanced current state of knowledge on these constants and coefficients applied for the nuclear waste management is in the framework of the specific interaction theory [10,24], i.e. thermodynamic constants (log10K°), as well
as specific ion interaction coefficients (M+,X–) — mostly considered constant with ionic
strength —, and thermodynamic functions (fG°m, fH°m, Sf°m, and Cp°m). Up to now no
specific ion interaction coefficients are available in the open literature for adipic acid protonation constants and Eu(III) complexation constants within the SIT formalism
OH O O
H O
proposed in Guillaumont et al. [24] and Hummel et al. [10]. Data on adipic acid deprotonation constant in NaClO4 [25-29] or NaCl [30,31] ionic media are existing.
Thermodynamic functions of reaction for Kn[32] and formation for adipic acid[31] has
been proposed. Bretti et al. [33] proposed protonation constants in various ionic media including NaCl, N(CH3)4Cl, and N(C2H5)4I in the framework of a SIT formalism, which
considers that (M+,X–) values vary with ionic strength, and Pitzer model. Wang et al. [13]
proposed complexation constants of Eu(Adip)n(3−2n)+ only at 0.1 M NaClO
4 . Thus, there is
a need of a reinterpretation of the system, with addition of complexation constant determination at higher ionic strength within the SIT formalism proposed in Guillaumont
et al. [24] and Hummel et al. [10].
The first part of this study will consist in literature data analysis for adipic acid solubility and acid-base equilibria — i.e., log10Kn°, and fG°m, fH°m, and Sf°m — within the SIT
framework providing specific ion interaction coefficients in NaCl and NaClO4 ionic media
— i.e., (Na+,Adip2–) and (Na+,AdipH–), and eventually (AdipH2(aq), NaCl) or
(AdipH2(aq), NaClO4) as proposed in Hummel et al. [10]. Then, the determination of the
complexation constant of Eu(III) by adipate ion using TRLS at 0.5 mol.kgw-1 (NaClO4), and
the extrapolation to zero ionic strength of the Eu(Adip)n(3−2n)+ complex(es) formation
constant and specific interaction parameter(s) will be done using existing literature data at 0.1 M (NaClO4) [13], and our new determination. Luminescence spectra evolution will
also be discussed. Finally, estimation of the role of adipate ion on the speciation of Eu(III) from slightly acidic to strongly basic solution will be discussed in the light of already available data of Eu complexation [34].
2. MATERIALS
2.1. Solutions preparation
Solutions of different adipic acid (99.5 %, Fluka) total concentration were prepared up to the solubility limit of 0.17 mol.kgw-1 [33]. In order to determine the complexation
constant, the solutions were made following these conditions: (i) ionic strength was fixed to 0.5 mol.kgw-1 NaClO4 (≥ 98 %, Sigma-Aldrich); (ii) Eu(III) concentrations were fixed at
10-5 mol.kgw-1 — the europium(III) stock solution was prepared by dissolving Eu2O3
(99.9 %, Alfa Aesar) into 0.1 mol.kgw-1 HClO4 (60 %, Fisher Scientific) —; and (iii) pH
values were fixed at 5.0 ± 0.05 by NaOH (99 %, Prolabo) solutions. The pH values were measured with a NaClO4/NaCl combined microelectrode (pH InLab, Mettler Toledo) by
redetermination of the potential/pH plot using commercial buffer solutions (4.01, 7.00, and 10.01). Uncertainties from the linear regression were typically in the range of 0.05 pH-units. Concentration of protons were calculated as
[H+] = 10−pH
γH+
⁄ (1)
log10γH+ = − A√𝐼𝑚 1 + 1.5 ∙ √𝐼𝑚 + ε(H+, ClO 4 −) ∙ 𝐼 𝑚 (2)
where A = 0.509 kgw1/2.mol-1/2 — A should be 0.507 kgw1/2.mol-1/2 at 22°C, but we decided
to neglect the effect of temperature difference in a first approximation— and ε(H+, ClO 4 −)
= 0.14 ± 0.02 kgw.mol-1.
From thermodynamic constants for Eu(III) hydrolysis in Table 1, this pH range allowed considering that Eu3+ was predominant in the solution [34]. This pH range was also
chosen to observe adipate ion Adip2- in a significant amount in solution, according to
previously proposed pKa values of adipic acid [35].
2.2. TRLS parameters
The TRLS experimental set-up is slightly modified compared to the one already described elsewhere [19,21-23,36-38]. It is including a 355 nm tripled neodymium-doped yttrium aluminium garnet (Nd:YAG) laser (Surelite, Continuum) providing ca. 170 mJ, pulsed at 10 Hz with a 5 ns pulse. An optical parametric oscillator (OPO) (Horizon, Continuum) set at 393.8 nm, which corresponds to the 5L6←7F0 transition [39], provided ca. 2 mJ of
energy. The beam is focused in a quartz fluorescence cell (Hellma QS-111-10-40), which contains the analyte. The energy received by the analyte is monitored by a RJP-734 Joule-meter (Laser Probe Inc.). The emitted luminescence beam is collected at 90° and focussed into an Acton spectrometer (slit 1 nm), which only the 300 lines.min-1 grating is used.
Emission spectra are recorded using the CCD sensor cooled down at -15°C by Peltier effect. All the described device is located in a (22 ± 1)°C thermostated room. The emission signal is collected after a 10 µs delay (D) after the laser pulse, during a 300 µs gate width (W). The spectra presented in this work are obtained after 500 accumulations. For each spectrum, the background noise is subtracted and the luminescence is divided by the average of 100 laser shots energy after the acquisition.
The luminescence decay times are obtained as described elsewhere [19,21,37], fitting the decay to the following equation.
F = F°. τ. exp (−𝐷
τ) (1 − exp (− 𝑊
𝜏)) (3)
The initial luminescence F° and luminescence decay time τ are obtained from a nonlinear regression using Microsoft Excel Solver and uncertainties are calculated using the SolverAid Macro from de Levie [40].
2.3. Thermodynamic data and specific ion interaction coefficients
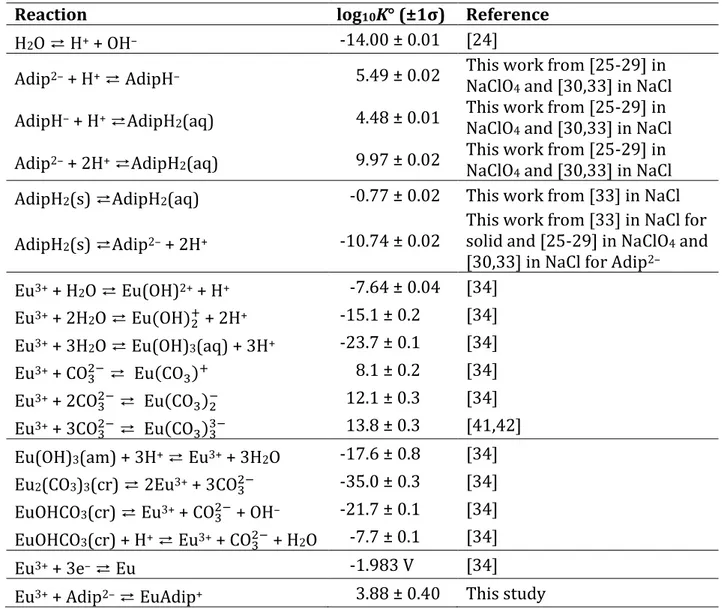
The different thermodynamic constants and functions used and calculated throughout this study are recalled in Table 1, 2, and 3; specific ion interaction coefficients are recalled in Table 4.Table 1. Reactions and thermodynamic constants used in this work.
Reaction log10K° (±1σ) Reference
H2O ⇄ H+ + OH– -14.00 ± 0.01 [24]
Adip2– + H+ ⇄ AdipH– 5.49 ± 0.02 This work from [25-29] in
NaClO4 and [30,33] in NaCl
AdipH– + H+ ⇄AdipH2(aq) 4.48 ± 0.01 This work from [25-29] in
NaClO4 and [30,33] in NaCl
Adip2– + 2H+ ⇄AdipH2(aq) 9.97 ± 0.02 This work from [25-29] in
NaClO4 and [30,33] in NaCl
AdipH2(s) ⇄AdipH2(aq) -0.77 ± 0.02 This work from [33] in NaCl
AdipH2(s) ⇄Adip2– + 2H+ -10.74 ± 0.02
This work from [33] in NaCl for solid and [25-29] in NaClO4 and
[30,33] in NaCl for Adip2–
Eu3+ + H2O ⇄ Eu(OH)2+ + H+ -7.64 ± 0.04 [34] Eu3+ + 2H2O ⇄ Eu(OH) 2 + + 2H+ -15.1 ± 0.2 [34] Eu3+ + 3H2O ⇄ Eu(OH)3(aq) + 3H+ -23.7 ± 0.1 [34] Eu3+ + CO 3 2− ⇄ Eu(CO 3)+ 8.1 ± 0.2 [34] Eu3+ + 2CO 3 2− ⇄ Eu(CO 3)2− 12.1 ± 0.3 [34] Eu3+ + 3CO 3 2− ⇄ Eu(CO 3)33− 13.8 ± 0.3 [41,42] Eu(OH)3(am) + 3H+ ⇄ Eu3+ + 3H2O -17.6 ± 0.8 [34]
Eu2(CO3)3(cr) ⇄ 2Eu3+ + 3CO32− -35.0 ± 0.3 [34]
EuOHCO3(cr) ⇄ Eu3+ + CO32− + OH– -21.7 ± 0.1 [34]
EuOHCO3(cr) + H+ ⇄ Eu3+ + CO32− + H2O -7.7 ± 0.1 [34]
Eu3+ + 3e– ⇄ Eu -1.983 V [34]
Table 2. Thermodynamic constants and functions of reaction for the adipic acid system.
Table 3. Thermodynamic functions of formation calculated for the Eu(III)-adipate system calculated from literature values, and values from Table 2.
fG°m kJ.mol-1 fH°m kJ.mol-1 S°m J.mol-1.K-1 Eu3+ -551.1a – – AdipH2(aq) -722.953b -961.274b 340.2b AdipH– -697.381c -962.534c 250.2c Adip2– -666.044c -965.214c 137.7c AdipH2(s) -727.348c – – EuAdip+ -1 239.291c – – aHummel et al. [34] b Shock [31] c present work Reaction rG°m kJ.mol-1 rH°m kJ.mol-1 rS°m J.mol-1.K-1 Adip2−+ H+⇄ AdipH− -31.337 ± 0.114a -2.68 ± 0.21b -90.0b AdipH−+ H+⇄ AdipH 2(aq) -25.572 ± 0.057a -1.26 ± 0.21b -112.5b
Adip2−+ 2H+⇄ AdipH2(aq) -56.909 ± 0.114a
AdipH2(s) ⇄AdipH2(aq) 4.395 ± 0.114a AdipH2(s) ⇄ Adip2– + 2H+ 61.304 ± 0.171a
Eu3++ Adip2−⇄ EuAdip+ -22.147 ± 2.169a n.a. n.a.
a present work
bChristensen et al. [32]
Table 4. Ion interaction coefficients used and determined in this work.
Ion interaction coefficient Value (±1σ) Reference ε(H+, ClO 4−) 0.14 ± 0.02 [24] ε(H+, Cl−) 0.12 ± 0.01 [24] ε(Na+, OH−) 0.04 ± 0.01 [24] ε(Na+, CO 3 2−) –0.08 ± 0.03 [24]
ε(Adip2−, Na+) 0.215 ± 0.006 estimated here from [25-29] in
NaClO4 and [30,33] in NaCl
ε(AdipH−, Na+) 0.135 ± 0.006 estimated here from [25-29] in
NaClO4 and [30,33] in NaCl
ε(AdipH2(aq), NaClO4) 0.037 ± 0.009 estimated here from [25-29] in
NaClO4 and [30,33] in NaCl
ε(AdipH2(aq), NaCl) 0.105 ± 0.005 estimated here from [33] ε(Eu3+, ClO
4
−) 0.49 ± 0.03 analogy with Am3+ [24]
ε(Eu(OH)2+, ClO 4
−) 0.39 ± 0.04 analogy with Am(OH)2+ [24]
ε(Eu(OH)2+, ClO 4
−) 0.17 ± 0.04 analogy with Am(OH) 2 + [24]
ε(Eu(CO3)+, ClO 4
−) 0.17 ± 0.04 analogy with Am(CO
3)+ [24]
ε(Eu(CO3)2−, Na+) –0.05 ± 0.05 analogy with Am(CO
3)2− [24]
ε(Eu(CO3)33−, Na+) –0.23 ± 0.07 analogy with Am(CO
3)33− [24]
ε(EuAdip+, ClO 4
−) 0.10 ± 0.40 this study
3. RESULTS AND DISCUSSION
3.1. Literature analysis of the solubility, protonation constants and
SIT coefficients of the adipic acid system
As stressed earlier, proposition of protonation constants of Adip2– are available in the
literature either in the framework of the Davies [43] correction for activity [35], or using SIT — slightly different from [10,24] — or Pitzer model [33]. Solubility of AdipH2(s) was
also proposed [33] in NaCl ionic medium. We have decided to reinterpret available data in NaClO4 [25-29] and NaCl [30,33] from literature at 25°C to propose coherent data to be
used in the framework of SIT [10,24].
3.1.1. Solubility of adipic acid
Bretti et al. [33] provided AdipH2(s) solubility measurement at different ionic strength.
The data were interpreted in the framework of the Setschenow equation [44]. Hummel et
al. [10] proposed a SIT interpretation of the organic acid solubility implying the definition
of a specific parameter (MHn(aq),NX) between the neutral acid and the background salt
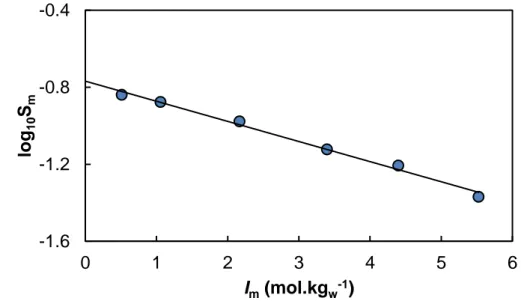
log10S°m = log10K°S – (AdipH2(aq),NaCl).Im (4)
Plotting the data from Bretti et al. [33] as a function of molal ionic strength — recalculated according to Novotny and Sohnel [45] — in Fig. 2 leads to logK°S = –0.77 ± 0.02 — i.e. S° =
0.171 ± 0.003 mol.kgw-1, in agreement with other data with no salt added [46], and the
specific interaction parameter (AdipH2(aq),NaCl) = 0.105 ± 0.005 kgw.mol-1.
The data on solubility of AdipNa2(s) are seldom in literature, i.e., 3.52 mol.kgw-1 at 25°C in
Rozaini and Brimblecombe [47], and will not be interpreted here. It seems that several phases are implied that has not been identified. This would need further studies.
Fig. 2. Logarithm of the solubility of adipic acid vs. ionic strength (mol.kgw-1) in NaCl
from Bretti et al. [33].
3.1.2. Protonation constants of Adip2–
Protonation constants available in NaCl and NaClO4 are recalled in Table 5. Ionic strength
in molal scale is recalculated for data in NaClO4 and NaCl when given in molar scale
according to Novotny and Sohnel [45]. Plot of log10K2 and log10K1K2 vs. ionic strength are
reported in Fig. 3. It can be seen that log10K1 and log10K2 evolutions seemed to be slightly
different at high ionic strength in NaClO4 and NaCl, which would imply that knowing that
(AdipH2(aq),NaCl) seems not nil, the adjustment of (AdipH2(aq),NaClO4) would be
necessary. -1.6 -1.2 -0.8 -0.4 0 1 2 3 4 5 6 log 10 Sm Im(mol.kgw-1)
Table 5. Calculated terms to determine the acidity constants of adipic acid. A2−+ H+⇄ AH−
Δ𝑧2= −4
Im (mol.kgw-1) log10K1 Medium References
0.101 5.00 NaClO4 [25] 0.101 5.09 NaClO4 [27] 1.051 4.95 NaClO4 [26] 1.051 4.97 NaClO4 [28] 3.502 5.36 NaClO4 [29] 0.101 5.06 NaCl [30] 0.202 4.98 NaCl [30] 0.510 4.93 NaCl [30] 1.040 4.91 NaCl [30] 1.593 4.94 NaCl [30] 2.169 5.02 NaCl [30] 2.771 5.10 NaCl [30] 3.403 5.18 NaCl [30] 0.050 5.074 NaCl [33] 0.100 4.994 NaCl [33] 0.500 4.844 NaCl [33] 1.000 4.848 NaCl [33] 2.000 4.958 NaCl [33] 3.000 5.104 NaCl [33] 4.000 5.255 NaCl [33] 5.000 5.402 NaCl [33] 6.000 5.537 NaCl [33] AH−+ H+⇄ AH 2(aq) A2−+ 2H+⇄ AH2(aq) Δ𝑧2= −2 Δ𝑧2= −6
Im (mol.kgw-1) log10K2 log10β2 = log10(K1K2) Medium References
0.101 4.28 9.28 NaClO4 [25] 0.101 4.29 9.38 NaClO4 [27] 1.051 4.30 9.25 NaClO4 [26] 1.051 4.29 9.26 NaClO4 [28] 3.502 4.76 10.12 NaClO4 [29] 0.101 4.29 9.35 NaCl [30] 0.202 4.27 9.22 NaCl [30] 0.510 4.23 9.10 NaCl [30] 1.040 4.26 9.11 NaCl [30] 1.593 4.31 9.20 NaCl [30] 2.169 4.37 9.34 NaCl [30] 2.771 4.45 9.50 NaCl [30] 3.403 4.55 9.68 NaCl [30] 0.050 4.299 9.373 NaCl [33] 0.100 4.259 9.253 NaCl [33] 0.500 4.193 9.048 NaCl [33] 1.000 4.219 9.067 NaCl [33] 2.000 4.332 9.290 NaCl [33] 3.000 4.468 9.572 NaCl [33] 4.000 4.608 9.863 NaCl [33] 5.000 4.745 10.147 NaCl [33] 6.000 4.850 10.387 NaCl [33]
a
b
Fig. 3. Extrapolation of the protonation constants of Adip2- at zero ionic strength by
SIT from data in Table 5: diamonds [30] and circles [33] and plain lines in NaCl ionic medium, and squares and dashed lines in NaClO4 ionic medium [25-29].
Performing the adjustment simultaneously on log10K°1, log10K°2, (AdipH2(aq),NaClO4),
(Adip2-,Na+), and (AdipH-,Na+) gives the evolutions in Fig. 3, and associated data in
Table 1 and 2; correlation matrix is given in Table S2 of the SI. The choice of the non-linear regression instead of constrained linear regression in Hummel et al. [10] was done in order to have directly access to the standard deviation of all the constants and coefficients and not through propagation of errors. One can nevertheless admit that a linear representation allows verifying that constant values of specific ion interaction coefficients vs. ionic strength can be used.
The log10K°1 and log10K°2 values compare favourably well, even though slightly higher,
with proposed values in NaCl by Bretti et al. [33]. Adjusted specific ion interaction coefficients ε(AdipH2(aq), NaClO4), ε(AdipH−, Na+), and ε(Adip2−, Na+) are reported in
4.0
4.2
4.4
4.6
4.8
5.0
0
1
2
3
4
5
6
lo
g
10K
2I
m(mol.kg
w-1)
8.5
9.0
9.5
10.0
10.5
11.0
0
1
2
3
4
5
6
lo
g
10K
1K
2I
m(mol.kg
w-1)
Table 4. From the correlation factor in Table S2 of the SI it can be seen that the different constants and coefficients are only weakly correlated. Thermodynamic functions of reaction from log10K°n [32], and formation thermodynamic functions for adipic acid [31]
can be proposed — see Table 2 and 3. They can be used to calculate thermodynamic functions of reactions and formation for adipate ions in Table 1 and 2.
A predominance diagram using thermodynamic constants from Table 1 and 2, and specific ion coefficients in Table 4 can be proposed in Fig. 4 in 0.5 mol.kgw-1 NaCl and
NaClO4. It can be seen that under these conditions of ionic strength fixed by either NaCl or
NaClO4, Adip2- is the major species at pH above 5. Knowing the speciation of Eu(III), which
first hydrolysis is ca. pH 7.5 (Table 1), a pH of 5 will be chosen for the complexation study.
Fig. 4. Predominance diagram of adipic acid in 0.5 mol.kgw-1 NaCl (plain lines) and
NaClO4 (dashed lines) using thermodynamic constants in Table 1 and 2, and specific
ion interaction coefficients in Table 4 — diagram obtained using Phreeplot software [48].
3.2. Europium-adipate complexation study
3.2.1. Luminescence spectra
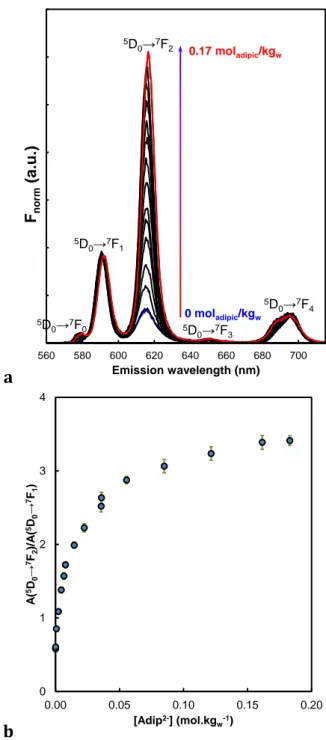
The evolution of the TRLS spectra of Eu(III) with increasing adipic acid concentrations are shown in Fig. 5a and Fig. S1 of the SI. The spectra are normalized to the area of the 5D0→7F1
transition in Fig. 5a — trapezoid method between 582 and 603 nm — and to the total area of the spectra in Fig. S1 of the SI — 560 and 715 nm. The relative intensity of the 5D0→7F2
transition increases with the adipic acid concentration, which shows the progressive -2.0 -1.5 -1.0 -0.5 0.0 2 3 4 5 6 lo g10 ([A d ip H2 ]to ta l mo l. kg w -1) pH AdipH2(s) AdipH2(aq) AdipH -Adip
2-complexation of Eu(III). The forbidden 5D0→7F0 transition is progressively increasing,
which indicates a loss of the centro-symmetry of Eu(III) environment [49,50]. It seems that isosbestic points occurs in Fig. S1 of the SI, which indicates the progressive complexation implying two species. A progressive hypsochromic shift of the 5D0→7F0, 5D0→7F1, 5D0→7F2, and 5D0→7F3 transitions— more apparent in Fig. S1 of the SI — towards
higher emission wavelength, and a broadening of the 5D0→7F4 transition can be observed.
In the case of 5D0→7F0 transition this has been attributed to a nephelauxetic effect of the
coordinated atoms [51,52] and evolution in the charge of the ligand [53].
The last two spectra are showing the highest hypsochromic shift. One can remind that the two corresponding concentrations are equal and above the theoretical solubility limit of adipic acid with no added background electrolyte. Therefore, these solutions will not be taken into account in the complexation constants determination.
a
b
Fig. 5. Evolution of the luminescence spectrum of Eu(III) normalized to the area of the 5D0→7F1 transition in the presence of increasing adipic acid concentration (a),
and the 7F2/7F1 area ratio in the presence of increasing adipate concentration (b):
[Eu]=10-5 mol.kgw-1, [NaClO4] = 0.5 mol.kgw-1. D = 10 µs, W = 300 µs, λexc = 393.8 nm.
Error bars represent 2σ of the area ratio using the trapezoid method. 3.2.2. Complexation constant determination at 0.5 mol.kgw-1 NaClO4.
As the pH value is fixed ca. 5.0, Eu(III) is considered to be only under the form of free Eu3+
ion; the other hydroxo species can be neglected — see thermodynamic constants in Table 1 and specific ion interaction coefficients in Table 4. The reaction can be written as,
560 580 600 620 640 660 680 700 Fno rm (a.u. ) Emission wavelength (nm) 0 moladipic/kgw 0.17 moladipic/kgw 5D 0→7F1 5D 0→7F2 5D 0→7F3 5D 0→7F4 5D 0→7F0 0 1 2 3 4 0.00 0.05 0.10 0.15 0.20 A( 5D 0 → 7F 2 )/ A ( 5D 0 → 7F 1 ) [Adip2-] (mol.kg w-1)
Eu3++ nAdip2− ⇆ Eu(Adip)n(3−2n)+ Adip𝛽° n=
[Eu(Adip)n(3−2n)+]
[Eu3+][Adip2−]n (5)
with Adipβ°n the cumulative reaction constants. The concentration of Adip2– can be
calculated using the log10K°n of adipic acid estimated earlier (vide supra).
The luminescence spectra evolutions in Fig. 5b can be considered as complexometric titrations. The formation of Eu(Adip)n(3−2n)+ is considered to be complete as the 5D0→7F2/5D0→7F1 ratio — named hereafter 7F2/7F1 — is no longer modified after
increasing the adipic acid concentration. Fig. 5b shows that this point is reached at [Adip2-] = 0.17 mol.kgw-1. As recalled in section 2 of the SI, the [Eu(Adip)
n (3−2n)+
] [Eu⁄ 3+] ratio can be determined from the 7F2/7F1 ratio as a function of log10([Adip2–] / mol.kgw-1)
in Fig. 6. The linear regression shows a determination coefficient r2 = 0.9517, with the
slope corresponding to the stoichiometry of the complexation reaction (n = 0.97 ± 0.08), which is close to unity. The y-intercept corresponds to log10Adipβ = 2.09 ± 0.15 (1σ) at
[NaClO4] = 0.5 mol.kgw-1 — see section 2 in SI for more details. Unlike Wang et al. [13],
who studied the Eu(III)-adipate system at [NaClO4] = 0.1 mol.L-1 — 0.101 mol.kgw-1 [45]
—, we did not observe a second complex formation with n = 2.
3.2.3. Estimation of complexation constant at infinite dilution
The SIT defined in Guillaumont et al. [24] was used to estimate the constant and ion interaction coefficients at zero ionic strength and 22°C,
log10Adip𝛽− Δz2∙ D = log10Adip𝛽° − Δε ∙ 𝐼𝑚 (6) with 𝐼𝑚 the ionic strength in mol.kgw-1, D = 0.509 ∙ √𝐼m⁄(1 + 1.5 ∙ √𝐼m) , and Δε the ion
interaction parameter in kgw.mol-1. In the case of EuAdip+ formation (equation 5), Δz² = –
12 and Δε is expressed as follows. Δε = ε(EuAdip+, ClO
4
−) – ε(Adip2−, Na+) – ε(Eu3+, ClO 4
−) (7)
Plotting log10Adip𝛽− Δz2∙ D vs. Im gives – as the slope and log10Adip𝛽° at the intercept.
Wang et al. [13] proposed the log10Adipβ(0.1 M) = 2.59 ± 0.01, supposedly using the protonation constants from Choppin et al. [12] — the reference in Table 1 from Wang et
al. [13] seems to be incorrectly attributed, and the protonation numbering is inversed in
regards to ours —, which was taken from Martell and Smith [54], i.e., log10K2(0.1 M) = 4.26
and log10K1(0.1 M) = 5.03. A correction for the protonation constants used can be done
[55] as follows,
log10𝛽SIT = log10𝛽Davies+ (αSIT
αDavies
⁄ ) (8)
α = 1 + 𝐾2γH+[H+] + K1𝐾2 γH2+ [H+]2 (9) At pH = 5, αDavies = 2.690 can be calculated using Wang et al. [13] data and equation from
Davies [43] for proton activity coefficient (log10γ± = –0.107), and αSIT = 2.966 can be
calculated back extrapolating thermodynamic constants from Table 1 using specific ionic data in Table 4 — log10K2(0.1 M) = 4.29 and log10K1(0.1 M) = 5.07, with log10γH+= –0.124. It can be commented that the uncertainty, or standard deviation, given by Wang et al. [13] is particularly low — i.e. 0.4%. As the experimental data of the Eu-Adip system are not directly given it seems awkward to propose an expert guess value of the uncertainty. One can remark that an uncertainty equivalent to the one proposed in this work would not greatly alter the propagation of errors.
Using SIT and the corrected complexation constant from the one proposed by Wang et al. [13], i.e. log10AdipβSIT(0.101 mol.kgw-1) = 2.63 ± 0.01, the complexation constant at zero
ionic strength can only be estimated. The ion interaction coefficient values used for this estimation are reported in Table 4. The slope (–Δε) is calculated using,
∆ε = − (log10Adip𝛽− Δz2∙ D) 0.5 𝑚 − (log10 𝛽 Adip − Δz2∙ D) 0.101 𝑚 0.5 − 0.101 (10) the y-intercept (log10Adip𝛽°) is calculated using,
log10Adip𝛽° = (log10Adip𝛽− Δz2∙ D) 𝐼𝑚
+ ∆ε ∙ 𝐼𝑚 (11)
and the extrapolation is shown in Fig. 7. We obtained from these two points, Δε = –(0.61 ± 0.40) kgw.mol-1 and log10Adipβ° = 3.88 ± 0.40, respectively — the standard deviations are
the result of the propagation of errors. Using thermodynamic functions from literature [24,31,34] and the constants determined here (Table 1) the free energy of formation for EuAdip+ complex, i.e. fG°m(EuAdip+) = -1 239.291 kJ.mol-1 is calculated (Table 3) — no
uncertainty can be given as no standard deviation of fG°m(Adip2-) is available.
Finally, using the ε(Adip2−, Na+) and ε(Eu3+, ClO 4
−) values in Table 4, ε(EuAdip+, ClO 4 −) =
(0.10 ± 0.40) kgw.mol-1 is calculated. This value compares favourably well to the specific
ion parameter in NaClO4 of an Am3+ complex with a di-basic ion, i.e. oxalate
ε(AmOx+, ClO 4
−) = (0.08 ± 0.10) kgw.mol-1 [10]. In view of the low number of points further
works are clearly needed to ascertain this value with more determinations at other ionic strengths and background salts.
Fig. 6. Determination of the Eu(III)-adipate stoichiometry and the complexation constant from TRLS results from Fig. 5; the experimental data are represented by the symbols while the linear regression is represented as a plain line: [Eu] = 10-5 mol.kgw-1, [NaClO4] = 0.5 mol.kgw-1, D = 10 µs, W = 300 µs, exc = 393.8 nm.
Fig. 7. Extrapolation of the complexation constant at zero ionic strength from the constant of this work at Im = 0.5 mol.kgw-1 NaClO4, and the constant of Wang et al.
[13] at Im = 0.101 mol.kgw-1 NaClO4 using SIT. Error bars represent 1σ of the
constant.
3.2.4. Luminescence decay evolution
The decay time evolution during the titration of the Eu3+ by Adip2– (Fig. 8) is showing only
mono-exponential decays, from 114 µs — on the 5D0→7F1 transition for Eu3+ — to 187 µs
-1.0 -0.5 0.0 0.5 1.0 1.5 -3.0 -2.5 -2.0 -1.5 -1.0 log 10 ([ E uA dip +]/[ E u 3+ ])
log10([Adip2–] / mol.kgw-1)
log10R = (0.97 0.08) log10[Adip2–] + (2.09 0.15)
3.6 3.8 4.0 4.2 4.4 0.0 0.1 0.2 0.3 0.4 0.5 log 10 β + 1 2 D Im(mol.kgw-1)
— on the 5D0→7F2 transition for the EuAdip+ complex, i.e. kobs = 5.3 ms-1. This means that
the exchange between the two excited states is too fast to be observed. The application of the equation from Kimura and Choppin [57],
nH2O =1.07
τ + 0.62 (12)
to our case would yield in 5 remaining molecules in the first hydration sphere of the EuAdip+ complex. This is reminiscent of the results obtain by Wang et al. [13] at their
highest adipic acid concentration. The authors attributed this decay time to a Eu(Adip)2− complex, which was not evidenced here.
This can be discussed as a 1:1 complex of with a diacid seems unlikely to form a strong bidentate complex involving the two acidic functions separated by a linear chain of 4 carbons. Choppin et al. [12] showed that 7 to 9 membered ring complexes — i.e., succinate, glutarate, and adipate — are less prone to form chelate than lower 5 and 6 membered ring complexes — i.e. oxalate and malonate. A complete study in D2O would be necessary
Fig. 8. Luminescence decay of the EuAdip2+ complex taken from the areas of the 5D0→7F1 and 5D0→7F2 transitions: [Eu] = 10-5 mol.kgw-1, [AdipH2]total = 0.1 mol.kgw-1,
Im = 0.5 mol.kgw-1 NaClO4, W = 300 µs, λexc = 393.8 nm.
3.3. Theoretical europium(III) speciation in adipate medium
Knowing the high concentration of adipate in HDPs of polyesterurethane [9,59], i.e.
0.3 mol.kgw-1, and the complexation constant with Eu(III) previously determined, the
theoretical Eu(III) speciation in leachates can be shown in Fig. 9 fixing ionic strength with 0.5 mol.kgw-1 NaClO4. Under these conditions, adipate ion seem to mainly control the
Eu(III) speciation from mildly acidic to mildly basic media (4 pH 9). But, adipate do not seem to be able to complex Eu(III) in an alkaline medium — from pH 10, see Fig. 9a. At pH 13.3, which is the pH value of a CEM-I interstitial cement water [60] — consisting mainly of mixture of KOH and NaOH —, Eu(III) should predominantly be Eu(OH)3(aq)
and/or amorphous solid Eu(OH)3(am). If Eu(III) is complexed by HDPs from
radio-oxidized polyesterurethane, as it is case for the HDPs from a radio-radio-oxidized PVC [38], other molecules than adipate from the ligand pool should be responsible.
One can argue that other types of adipate complexes might be existing under these conditions, i.e. supposedly mixed Eu(OH)nAdip(3-2-n)+. But it must not be forgotten that in
a previous work it has been shown that oxalate and glutarate — which are supposed to have greater complexation constants than adipate [13] — did not increase Eu(OH)3(s)
solubility at pH 13.3 [38]. Even phthalic acid has not been shown to impact solubility of Eu(OH)3(s) [13].
The predominance of EuAdip+ complex in absence of atmospheric CO2 is shown in Fig. 10a
fixing ionic strength at 0.1 mol.kgw-1 NaClO4. It can be seen that the organic complex 100 120 140 160 180 200 -6 -5 -4 -3 -2 -1
t
(µ
s)
log
10([Adip
2–] / mol.kg
w-1)
5D0->7F2 5D0->7F1 5D 0→7F2 5D 0→7F1
predominance domain is limited to mildly acid and mildly basic solution and total adipic acid concentration higher than ca. 3 10-3 mol.kgw-1, which means that it account for 10%
ca. 3 10-4 mol.kgw-1.
Fig. 9b is showing the Eu(III) speciation at log10(PCO2 / atm) = -3.5 and [AdipH2]total = 0.3 mol.kgw-1, in a lower pH span. The extent of EuAdip+ stability is comparable to the
preceding case, however limited to pH 8 by the EuOHCO3(cr) precipitation. The extent of
the EuAdip+ predominance is shown in Fig. 10b. Similar calculation on the predominance
of EuAdip+ complex can be made in the presence of atmospheric CO2, but its impact is
more limited in the mildly basic domain.
If the impact of adipic acid is proven to be very limited, if not negligible, in alkaline media representative of near-field environment form ILW-LL nuclear waste, its influence in the envisaged host rocks of radioactive wastes repositories remains to be clarified. Knowing the source term of adipate in PUR, the complexation of calcium [61,62] and, most likely, the precipitation of calcium adipate [63] can occur in cementitious equilibrium waters. As an anion it is likely to adsorb on cementitious minerals [64,65] and compete with anionic radionuclides [66]. In less alkaline media, the adsorption of adipate has recently been shown in the case of the Callovo-Oxfordian claystone in France [67]. Studies on the eventual impact on adsorption of Eu(III) in presence of adipic acid would then be desirable including the formation of ternary surface complex formation [23,68].
a
b
Fig. 9. Speciation of Eu(III) 10-6 mol.kgw-1 in 0.3 mol.kgw-1 adipic acid at I = 0.5
mol.kgw-1 (NaClO4), P(CO2) = 10-12 atm (a) and P(CO2) = 10-3.5 atm (b). The speciation
was calculated using thermodynamic constants reported in Table 1 and 2, and specific ion interaction coefficients in Table 4. Species representing less than 5% in total are not plotted.
0.0 0.2 0.4 0.6 0.8 1.0 2 4 6 8 10 12 P rop ortion of s pec ie s pH Eu[3+] Eu(Adipate)[+] Eu(OH)[2+] Eu(OH)2[+] Eu(OH)3(aq) Eu(OH)3(am) Eu3+
EuAdip+ Eu(OH)3(aq)
Eu(OH)3(am) Eu(OH)2+ Eu(OH)2+ 0.0 0.2 0.4 0.6 0.8 1.0 2 4 6 8 Prop o rt io n o f sp ecies pH Eu[3+] Eu(Adipate)[+] Eu(CO3)[+] Eu(CO3)3[3-] EuOHCO3(cr) Eu3+ EuAdip+ EuOHCO3(cr) Eu(CO3)+ Eu(CO3)33–
a
b
Fig. 10. Predominance diagrams of Eu(III) 10-6 mol.kgw-1 vs. pH with increasing total
adipic acid concentration, I = 0.1 mol.kgw-1 (NaClO4) at P(CO2) = 10-12 atm (a), and
P(CO2) = 10-3.5 atm (b). The speciation was calculated using thermodynamic
constants reported in Table 1 and specific ion interaction coefficients in Table 4 — diagram obtained using Phreeplot software [48].
4. CONCLUSIONS
The aim of this work was to investigate the complexation of Eu(III) by adipate ion, a major HDP released from a polyesterurethane irradiated with gamma rays. First, the thermodynamic constants for protonation of adipate and solubility of adipic acid in NaCl and NaClO4 ionic media were reviewed and extrapolated to zero ionic strength in the
framework of the specific interaction theory: specific ion interaction coefficients of AdipH2(aq), AdipH–, and Adip2– were estimated. The formation of a 1:1 complex between
Eu3+ and Adip2– was confirmed and the complexation constant can be extrapolated to zero
ionic strength log10β° = 3.88 ± 0.40, and the specific ion interaction coefficient was
evaluated at ε(EuAdip+, ClO 4
−) = (0.10 ± 0.40) kgw.mol-1.
If an important amount of polyesterurethane is radio-oxidized, the formation of a EuAdip+ complex cannot compete with hydrolysis in cementitious system, and can only occur at slight acidic to mildly basic pH values. The impact of this complex on the adsorption of radionuclides onto host rocks of radioactive nuclear waste repository should be evaluated.
ACKNOWLEDGEMENTS.
The authors acknowledge ORANO and EDF for financial support and fruitful discussions; Drs. Muriel Ferry (CEA) and Florence Cochin (ORANO) for thorough reading of the manuscript; Pr. Gérard Cote (ParisTech) and Dr. Thomas Vercouter (CEA) for helpful suggestions.
REFERENCES
[1] M.J. Keith-Roach, Sci. Total Environ., 396 (2008) 1-11.
[2] C. Lamouroux, F. Cochin, Procedia Chem., 7 (2012) 559-566.
[3] L.R. Van Loon, M.A. Glaus, J. Environ. Polym. Degr., 5 (1997) 97-109. [4] E. Wieland, J. Tits, J.P. Dobler, P.
Spieler, Radiochim. Acta, 90 (2002) 683-688.
[5] M.A. Glaus, L.R. Van Loon, Environ. Sci. Technol., 42 (2008) 2906-2911. [6] L.R. Van Loon, W. Hummel, Nucl.
Technol., 128 (1999) 359-371. [7] L.R. Van Loon, W. Hummel, Nucl.
Technol., 128 (1999) 388-401. [8] E. Fromentin, C. Aymes-Chodur, D.
Doizi, M. Cornaton, F. Miserque, F. Cochin, M. Ferry, Polym. Degrad. Stab., 146 (2017) 161-173. [9] E. Fromentin, M. Pielawski, D.
Lebeau, S. Esnouf, F. Cochin, S. Legand, M. Ferry, Polym. Degrad. Stab., 128 (2016) 172-181.
[10] W. Hummel, G. Anderegg, L.F. Rao, I. Puigdomènech, O. Tochiyama, Chemical Thermodynamics 9. Chemical Thermodynamics of
Compounds and Complexes of U, Np, Pu, Am, Tc, Se, Ni and Zr with
Selected Organic Ligands, North Holland Elsevier Science Publishers B. V., Amsterdam, The Netherlands, 2005.
[11] D. Rai, A. Kitamura, J. Chem.
Thermodyn., 114 (2017) 135-143. [12] G.R. Choppin, A. Dadgar, E.N.
Rizkalla, Inorg. Chem., 25 (1986) 3581-3584.
[13] Z.M. Wang, L.J. van de Burgt, G.R. Choppin, Inorg. Chim. Acta, 310 (2000) 248-256.
[14] R.G. Pearson, J. Am. Chem. Soc., 85 (1963) 3533-3539.
[15] W.D. Horrocks, Jr., D.R. Sudnick, J. Am. Chem. Soc., 101 (1979) 334-340.
[16] B. Alpha, R. Ballardini, V. Balzani, J.-M. Lehn, S. Perathoner, N. Sabbatini, Photochem. Photobiol., 52 (1990) 299-306.
[17] S. Kuke, B. Marmodée, S. Eidner, U. Schilde, M.U. Kumke, Spectrochim. Acta A, 75 (2010) 1333-1340. [18] K. Binnemans, Coord. Chem. Rev.,
295 (2015) 1-45.
[19] P. Moreau, S. Colette-Maatouk, P. Vitorge, P. Gareil, P.E. Reiller, Inorg. Chim. Acta, 432 (2015) 81-88. [20] K. Burek, S. Eidner, S. Kuke, M.U.
Kumke, Spectrochim. Acta A, 191 (2017) 36-49.
[21] J. Brevet, F. Claret, P.E. Reiller, Spectrochim. Acta A, 74 (2009) 446-453.
[22] P.E. Reiller, J. Brevet, Spectrochim. Acta A, 75 (2010) 629-636.
[23] P. Moreau, S. Colette-Maatouk, P. Gareil, P.E. Reiller, Appl. Geochem., 74 (2016) 13-23.
[24] R. Guillaumont, T. Fanghänel, V. Neck, J. Fuger, D.A. Palmer, I. Grenthe, M.H. Rand, Update on the Chemical Thermodynamics of Uranium, Neptunium, Plutonium, Americium and Technetium, OECD Nuclear Energy Agency, Issy-les-Moulineaux, France, 2003.
[25] M. Yasuda, K. Yamasaki, H. Ohtaki, Bull. Chem. Soc. Jpn., 33 (1960) 1067-1070.
[26] A. Hammam, A. Olin, P. Svanström, Acta Chem. Scand. A, 31 (1977) 384-390.
[27] H. Itoh, Y. Ikegami, Y. Suzuki, Bull. Chem. Soc. Jpn., 57 (1984) 3426-3429.
[28] H. Moriya, T. Sekine, Bull. Chem. Soc. Jpn., 47 (1974) 747-748.
[29] E. Néher-Neumann, Acta Chem. Scand. A, 33 (1979) 421-430.
[30] B. Adell, Z. phys. Chem., 185A (1939) 161-206.
[31] E.L. Shock, Am. J. Sci., 295 (1995) 496-580.
[32] J.J. Christensen, R.M. Izatt, L.D. Hansen, J. Am. Chem. Soc., 89 (1967) 213-222.
[33] C. Bretti, R.M. Cigala, F. Crea, C. Foti, S. Sammartano, Fluid Phase Equilib., 263 (2008) 43-54.
[34] W. Hummel, U.R. Berner, E. Curti, F.J. Pearson, T. Thoenen, Nagra/PSI chemical thermodynamic data base 01/01, NTB 02-06, NAGRA, 2002, pp 564.
[35] R.M. Smith, A.E. Martell, R.J.
Motekaitis, NIST Standard Reference Database 46. NIST critically selected stability constants of metal
complexes database. Version 8.0, National Institute of Standards and Technology, Gaithersburg, MD, USA, 2004.
[36] N. Janot, M.F. Benedetti, P.E. Reiller, Geochim. Cosmochim. Acta, 123 (2013) 35-54.
[37] Y.Z. Kouhail, M.F. Benedetti, P.E. Reiller, Environ. Sci. Technol., 50 (2016) 3706-3713.
[38] P.E. Reiller, E. Fromentin, M. Ferry, A. Dannoux-Papin, H. Badji, M. Tabarant, T. Vercouter, Radiochim. Acta, 105 (2017) 665-675.
[39] W.T. Carnall, P.R. Fields, K. Rajnak, J. Chem. Phys., 49 (1968) 4450-4455. [40] R. de Levie, Advanced Excel for
Scientific Data Analysis, Oxford University Press, 2004.
[41] R.R. Rao, A. Chatt, Radiochim. Acta, 54 (1991) 181-188.
[42] T. Vercouter, P. Vitorge, N. Trigoulet, E. Giffaut, C. Moulin, New J. Chem., 29 (2005) 544-553.
[43] C.W. Davies, Ion Association, Butterworths, London, UK, 1962. [44] J. Setschenow, Z. phys. Chem., 4U
(1889) 117-125.
[45] P. Novotny, O. Sohnel, J. Chem. Eng. Data, 33 (1988) 49-55.
[46] A. Apelblat, E. Manzurola, J. Chem. Thermodyn., 19 (1987) 317-320. [47] M.Z.H. Rozaini, P. Brimblecombe, J.
Chem. Thermodyn., 41 (2009) 980-983.
[48] D. Kinniburgh, D.M. Cooper, Creating graphical output with PHREEQC, 2011 http://www.phreeplot.org. [49] B.R. Judd, Phys. Rev., 127 (1962)
750-761.
[50] G.S. Ofelt, J. Chem. Phys., 37 (1962) 511-520.
[51] S.T. Frey, W.D. Horrocks, Jr., Inorg. Chim. Acta, 229 (1995) 383-390. [52] G.R. Choppin, Z.M. Wang, Inorg.
Chem., 36 (1997) 249-252.
[53] M. Albin, W.D. Horrocks, Jr., Inorg. Chem., 24 (1985) 895-900.
[54] A.E. Martell, R.M. Smith, Critical Stability Constants, Plenum Press, New York, NY, USA, 1977.
[55] P.E. Reiller, N.D.M. Evans, G. Szabó, Radiochim. Acta, 96 (2008) 345-358. [56] A. Ringböm, Complexation in
Analytical Chemistry: A Guide for the Critical Selection of Analytical Methods Based on Complexation Reactions, Interscience Publishers, New York, NY, USA, 1963.
[57] T. Kimura, G.R. Choppin, J. Alloys Compd., 213 (1994) 313-317. [58] R.M. Supkowski, W.D. Horrocks, Jr.,
Inorg. Chim. Acta, 340 (2002) 44-48.
[59] E. Fromentin, Lixiviation des
Polymères Irradiés : Caractérisation de la Solution et Complexation des Actinides, PhD Thesis, Université Pierre et Marie Curie, Paris, France, 2017, pp. 274, http://hal.archives-ouvertes.fr/tel-01622137.
[60] U.R. Berner, Waste Manage., 12 (1992) 201-219.
[61] N.E. Topp, C.W. Davies, J. Chem. Soc., (1940) 87-93.
[62] P. Prapaipong, E.L. Shock, C.M. Koretsky, Geochim. Cosmochim. Acta, 63 (1999) 2547-2577. [63] D. Loos, C. Pasel, M. Luckas, K.G.
Schmidt, J.D. Herbell, Fluid Phase Equilib., 219 (2004) 219-229. [64] I. Pointeau, P. Reiller, N. Macé, C.
Landesman, N. Coreau, J. Colloid Interface Sci., 300 (2006) 33-44. [65] I. Pointeau, N. Coreau, P.E. Reiller,
Radiochim. Acta, 96 (2008) 367-374. [66] I. Pointeau, D. Hainos, N. Coreau, P.
Reiller, Waste Manage., 26 (2006) 733-740.
[67] S. Rasamimanana, G. Lefèvre, R.V.H. Dagnelie, Chemosphere, 181 (2017) 296-303.
[68] P. Moreau, S. Colette-Maatouk, P. Gareil, P.E. Reiller, Colloids Surf., A, 435 (2013) 97-108.


![Fig. 3. Extrapolation of the protonation constants of Adip 2- at zero ionic strength by SIT from data in Table 5: diamonds [30] and circles [33] and plain lines in NaCl ionic medium, and squares and dashed lines in NaClO 4 ionic medium [25-29]](https://thumb-eu.123doks.com/thumbv2/123doknet/13128951.387949/11.892.175.724.112.730/extrapolation-protonation-constants-strength-table-diamonds-circles-squares.webp)


![[PDF] Apprendre et enseigner LabVIEW formation avancé | Cours informatique](data:image/gif;base64,R0lGODlhAQABAIAAAP///wAAACH5BAEAAAAALAAAAAABAAEAAAICRAEAOw==)