HAL Id: hal-02508836
https://hal.archives-ouvertes.fr/hal-02508836
Submitted on 20 Nov 2020
HAL is a multi-disciplinary open access
archive for the deposit and dissemination of
sci-entific research documents, whether they are
pub-lished or not. The documents may come from
teaching and research institutions in France or
abroad, or from public or private research centers.
L’archive ouverte pluridisciplinaire HAL, est
destinée au dépôt et à la diffusion de documents
scientifiques de niveau recherche, publiés ou non,
émanant des établissements d’enseignement et de
recherche français ou étrangers, des laboratoires
publics ou privés.
Sergii Snegir, Yannick Dappe, Kapitanchuk Oleksiy, Delphine Coursault,
Emmanuelle Lacaze
To cite this version:
Sergii Snegir, Yannick Dappe, Kapitanchuk Oleksiy, Delphine Coursault, Emmanuelle Lacaze. Kinked
row-induced chirality driven by molecule-substrate interactions. Physical Chemistry Chemical Physics,
Royal Society of Chemistry, 2020, 22, pp.7259-7267. �10.1039/C9CP06519A�. �hal-02508836�
ARTICLE
a.
Sorbonne Université, Faculté des Sciences, CNRS, Institut des Nano-Sciences de Paris (INSP), 4 pl Jussieu 75005 PARIS, France.
b.
University of Konstanz, Konstanz, Germany.
c.
-Saclay, CEA Saclay, 91191 Gif-sur-Yvette Cedex, France
d.Bogolyubov Institute for Theoretical Physics, National Academy of Sciences of
Ukraine, Kyiv, Ukraine
e.
Université de Bordeaux, CNRS, LOMA, UMR 5798, F-33400 Talence, France
f.
Footnotes relating to the title and/or authors should appear here.
Electronic Supplementary Information (ESI) available: [details of any supplementary information available should be included here]. See DOI: 10.1039/x0xx00000x
Received 00th
January 20xx,
Accepted 00th January 20xx DOI: 10.1039/x0xx00000x
KINKED ROW-INDUCED CHIRALITY DRIVEN BY
MOLECULE-SUBSTRATE INTERACTIONS
Sergii Snegira,b Yannick J. Dappec, Oleksiy L. Kapitanchukd, Delphine Coursaute, and Emmanuelle Lacaze*a
Combining STM measurements on three different substrates (HOPG, MoS2, and Au[111]), DFT calculations, and using a
previously developed phenomenological model, we analyze the origin of the self-assembly of 4-Cyano-4′-n-decylbiphenyl (10CB), into kinked row structures. This molecule has an alkyl chain with 10 carbons and a cyanobiphenyl group of particularly large dipole moment. 10CB represents a toy model that we use here to unravel the relationship between the induced kinked structure, in particular, the corresponding chirality expression, and the balanced intermolecular/molecule-substrate interaction. We show that the local ordered structure is driven by the typical alkyl chain/intermolecular/molecule-substrate interaction for HOPG and Au[111] and the cyanobiphenyl group/substrate interaction for MoS2. The strongest molecule/substrate
interactions are observed for MoS2 and Au[111]. These strong interactions should have led to non-kinked, commensurate
adsorbed structures. However, this latter appears impossible due to steric interactions between the neighboring cyanobiphenyl groups that lead to a fan-shape structure of the cyanobiphenyl packing on the three substrates. As a result, the kink-induced chirality is particularly large on MoS2 and Au[111]. A further breaking of symmetry is observed on
Au[111] due to an asymmetry of the facing molecules in the rows induced by similar interactions with the substrate of both the alkyl chain and the cyanobiphenyl group. We calculate that the overall 10CB/Au[111] interaction is of the order of 2 eV per molecule. The close 10CB/MoS2 interaction, in contrast, is dominated by the cyanobiphenyl group, being
particularly large due to dipole-dipole interaction between the cyanobiphenyl groups and the MoS2 substrate.
Introduction
For more than 30 years, a large variety of adsorbed molecular monolayers has been revealed and their structures studied in detail. Despite the considerable work already performed, the structure of a given self-assembled monolayer (SAM) for a new molecule/substrate combination remains unpredictable yet. A fundamental difficulty resides in mastering the relationship between the molecule/substrate, intermolecular interactions, and the emerged 2D supra-molecular structure. It is difficult because the relevant interactions, responsible for the induced ordered structures, are all of the same order of magnitude, moreover of value often not precisely known. Despite such complexity, the scientific interest towards 2D supra-molecular structures remains very high 1 since the crystalline structures, induced on crystalline substrates, can provide a number of
potential applications 2. To recall only a few, 2D molecular structures could be used as mother-templates for the stabilization of 3D molecular films that can be chiral 3-6. This kind of 2D chirality becomes increasingly interesting due to the number of techniques now able to overcome the recurring problem of the formation of mirror-image domains that would finally render the overall system racemic 7-15. A 2D mother-template may also serve as a molecular sieve for the selection of guest-molecules by structural criteria 16-18 or by chiral criteria 19-20. Besides these applications, 2D molecular templates were found recently efficient even for the formation of ordered arrays of nanoparticles 21.
It is thus essential to establish how the different interactions combine if we want to be able to predict the induced structure associated with a given combination of molecule and crystalline substrate. It becomes now possible to make progress in this direction due to the constant improvement of numerical simulations, namely more accurate potentials in molecular dynamics,22 or more significant system capability in DFT in particular 17, 23. Therefore, we have chosen a particularly simple object, lamellar SAM made of elongated molecules, 10-Alkyl-cyanobiphenyl molecules (10CB) to understand how to demarcate all forces responsible for 2D superstructure formation. 10CB molecules have been studied in the past, but here we study them on three different substrates, HOPG, MoS2
and Au[111]. It is known that examining the self-assembly of the same molecule on different substrates is a useful tool if we want to disentangle the respective influence of substrate/molecule interactions and intermolecular interactions on the assembly process 24-26 .
10CB belongs to the class of n-Alkyl-cyanobiphenyl molecules (n-CB). Their structure consists of an aliphatic part (–[CH2]n–
CH3) and an aromatic part. Two phenyl rings represent the
aromatic part with the terminal –C≡N (cyano) group associated with the presence of a large dipole moment 27. When the number of methylene units n (n = 5, 6, 7, 8, 9, 10, 12) varies, the molecular ordering on crystalline substrates may change. This effect was evidenced on highly oriented pyrolytic graphite (HOPG) 28-32 and molybdenum disulfide (MoS2) 33-36 substrates.
It has been shown that the n-CB molecular rows can be kinked, inducing a specific kind of chirality related to the direction of the kinks 13. These kinked rows are common structures for a number of adsorbed molecules37-39 and we intend here to work towards a more general understanding of the origin of these kinked rows. We use a phenomenological model of lamellar structures 40 combined with DFT calculations and STM data analysis to unravel the role of the molecule/substrate and intermolecular interactions. We show that whereas the three kinds of structures are globally similar, they present specific differences. We thus explore how the combination of the interactions induces these kinked structures which mostly concerns van der Waals interactions between alkyl chains and cyanobiphenyl groups, steric interactions between cyanobiphenyl groups and molecule/substrate interactions. Not only are we able to confirm the specifically strong interactions between the cyanobiphenyl groups and MoS2
most probably due to the large cyanobiphenyl dipolar moment, but we evidence a further breaking of symmetry for 10CB/Au[111].
Experimental
An ethanolic solution of 10CB molecules (2.5×10⁻⁷ mol.L-1) was deposited on the surface of HOPG, MoS2, and Au[111] and let
evaporating before the STM measurements. The HOPG and MoS2 substrates were cleaved just before the solution
deposition and the Au[111]/mica substrate was annealed before deposition using a butane/propane torch. The STM measurements of freshly prepared gold surface revealed long-range herringbone patterns associated with periodically white stripes on STM images (Fig.S0.) 41. This pattern corresponds to the well-known Au[111]/22×√3 reconstruction, with 23 surface atoms fitting into 22 lattice sites by compressing the topmost layer of the surface with the additional atoms 42. The existence of the reconstruction was considered as evidence of the surface purity.
STM measurements. The SAMs were all studied under ambient
atmospheric conditions using a commercial STM equipped with a low current head (Bruker, Nanoscope 3A). The calibration of the STM piezoceramics occurs regularly using the HOPG surface. The STM tip was prepared by mechanical
cutting of a Pt/Ir (80:20) wire. For each monolayer, several STM-images were recorded in constant current mode with It
ranging from 1.2 to 3 pA and tip bias Ut from 50 to 1500 mV.
They were obtained from different samples and tips to check reproducibility and to ensure that the results are free from artefacts. All distances have been measured from five different images with further averaging. This allowed minimizing the errors caused by the thermal drift of the STM tip when working under ambient conditions.
All chemicals were purchased from Aldrich and used as received. HOPG, MoS2, and mica substrates covered with gold
were purchased from Bruker (Germany) and Phasis (Switzerland), respectively.
DFT calculations. All geometrical configurations and molecular
wave functions were obtained for an isolated 10CB molecule in neutral form using the quantum-chemical calculations. The full geometry relaxation, the electron density (HOMO and LUMO levels), and the energies calculations are performed at the density functional theory (DFT) level with the hybrid B3LYP functional and standard 6-31G* basis set using the Gaussian’03 program package.
Adsorption energies of alkyl chains and head groups on gold have been calculated using the localized-orbitals basis set DFT code Fireball 43. Hence we have considered a 5x5 unit cell of Au(111) composed of 5 atomic layers in the XY plane. This unit cell is reproduced periodically in the XY plane through the DFT calculations and we have used a standard optimized spd basis set44. Then the molecular group has been placed on top of the gold slab and the full system has been optimized until the forces went below 0.1 eV/Å. Then from the obtained configuration, we have determined the interaction energy between the molecular group and the surface at different distances along the Z-axis. Van der Waals's interactions have been taken into account through the use of a specific formalism previously used for similar systems 44. This formalism is a perturbation theory which takes into account two major contributions: the first one is due to the small overlaps between the electronic wavefunctions of the two subsystems, and lead to a repulsive contribution. This contribution is determined through a Taylor expansion with the overlaps of the Löwdin orthogonalization of the atomic wavefunctions. The second contribution, namely the van der Waals interaction, arises from the dipolar interaction between the two subsystems. Hence, we calculate here all the atomic dipole interactions between atoms from the two subsystems and add this energy in perturbation theory to the whole system. The dipole-dipole interaction is evolving in 1/r3, within the perturbation theory, we recover a 1/r6 behavior, characteristic of van der Waals interactions.
Results and discussion
The SAM of 10CB molecules on a HOPG substrate form large
mono domains of size exceeding 400 nm2, characterized by a lamellar packing of the molecules. The rows of neighboring
Journal Name ARTICLE
This journal is © The Royal Society of Chemistry 20xxJ. Name., 2013, 00, 1-3 | 3 domains are slightly dislocated with respect to each other, forming straight domain walls (Fig. 1a). The STM analysis of a higher resolution image (Fig. 1b) reveals the presence of a specific intra-row structure. The rows are formed of periodic groups of 10 molecules, shifted from each other, leading to kinked rows. A scheme on top of the STM image shows in Fig.1b the simplest unit cell between 2 consecutive kinks made of 10 molecules.
Each unit cell corresponds to an arrangement of 10 elongated bright spots representing the location of the π-conjugated cyanobiphenyl head-groups of the 10CB molecules29. The shape of the spots agrees well with the calculated profile of the frontier wave functions of the 10CB molecules (Fig.S1a). The head-groups point inward with their –C≡N groups, facing each other, in agreement with previous results on the same system 29. In Fig.1b the contrast is poor on top of the alkyl tails compare to one of the aromatic head-groups. It is due to the low electron density of the alkyl tails. Nevertheless, a fine-tuning of the STM tunnelling parameters allowed us to visualize the alkyl tails as repetitive bright spots (Fig. 1b).
Figure.1 STM images of the SAM of 10CB molecules on a HOPG
surface. a) – the large scale image (130×48 nm2) represents the border of the domain. b) – the small scale image (10×10 nm2) represents the internal kinked structure of the rows. The molecules superimposed on the STM image are mapping the unit cell. The angle α is the angle between the main crystallographic direction [100] of the HOPG substrate and the average row orientation created by the kinked structure. The corresponding STM parameters are It = 2 pA, Ut= 0.28 V.
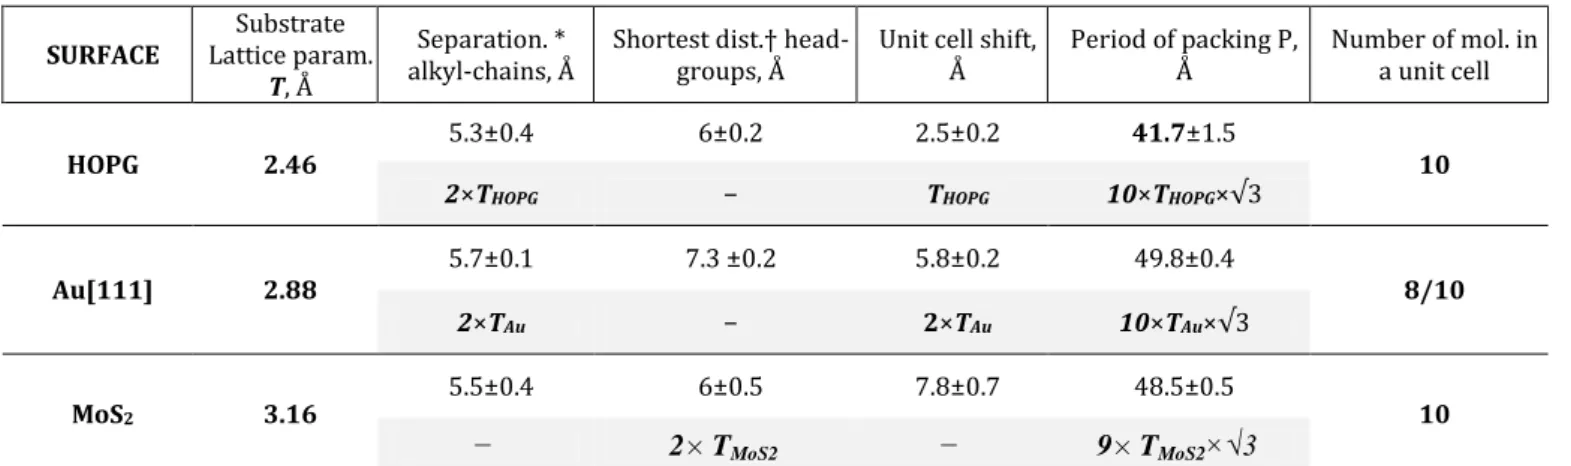
The extremities of two alkyl chains of two neighboring molecules in one unit-cell are separated by 5.3±0.4 Å (Fig. 1). This value is consistent with the value 2×TH=4.9 Å, where TH is
the HOPG lattice parameter. The alkyl groups thus fit on the lattice, along the [100] direction, as expected 45, 46. The period
P of the unit cells, measured along the [1-10] direction (Fig.
1b), is equal to 41.7±1.5 Å, which is close to 10×TH×√3=42.5 Å.
This confirms the commensurability of the unit cell and suggests that its orientation is imposed by the HOPG, with the border of the unit cell being oriented along the [100] direction (Fig.S2). The relative shift of the unit cells along the [100] direction at each kink is equal to the value of one THOPG:
2.5±0.3 Å which again confirms the local epitaxy of the 10CB molecules on the HOPG lattice (see Tab. 1 and Fig.S2).
Remarkably, the mean distance between endpoints of the neighboring cyanobiphenyl head-groups is 6±0.2 Å, larger than between endpoints of the alkyl chains, 5.3±0.4 Å, suggesting that the cyanobiphenyl groups do not fit the HOPG lattice. The larger inter-cyanobiphenyl group distance is consistent with a slightly fan-shaped structure, opposite to the strict alignment of the alkyl chains.
As a result, the STM contrast for the molecules at the edges of a unit cell is higher than for other molecules (Fig.S3). Such difference can be explained by different STM tunnelling conditions through the cyanobiphenyl groups at the edges of a unit cell with respect to the different carbon atoms of the HOPG. This suggests a different location on the HOPG lattice. From this, we can conclude about a non-perfect epitaxy of the molecules on HOPG, especially for the cyanobiphenyl groups at the border of the unit cell.
The SAM of 10CB molecules on MoS2 contains large mono domains, of width around 200×200nm2, also with a lamellar structure. The observations revealed the formation of a face-to-face molecular arrangement of 10 molecules within a unit cell of MoS2 (Fig.2). The structure looks very similar to the one
on HOPG (Fig. 1), but the STM contrast of 10CB on MoS2 was
obtained only under a high applied bias, above 1.4 V, due to the semiconducting nature of the MoS2 substrate 47.
From the images in Fig.2b, it is easy to identify the two phenyl rings of each 10CB molecule as they appear as two separate bright spots. In contrast, alkyl-chain appears as one elongated bright spot. The mean distances between the endpoints of the cyanobiphenyl groups and between the terminal groups of the alkyl chains in a single unit cell are equal to respectively 6±0.5 Å and 5.5±0.4Å, respectively.
These distances are close to the one on HOPG. On MoS2 (Tab.
1), the head groups present an epitaxy with the lattice since they are separated by about 6 Å, i.e. 2×TMoS2 with TMoS2 = 3.16
Å, the MoS2 lattice constant. This confirms an orientation of
the biphenyl groups close to being parallel to the [120] direction, as already evidenced for 8CB on MoS2
48-50
Figure.2 STM images of the SAM of 10CB molecules on a MoS2
surface, a) – the large-scale image (20×7 nm2), b) – the small-scale image (10×10 nm2) represents the 10CB, arranged in the rows with a kinked structure. The molecular structures superimposed on the image are mapping the unit cell. The angle α is the angle between the main crystallographic direction [110]. of the MoS2 substrate and the average row
orientation created by the kinked structure. The corresponding STM parameters are It =10 pA, Ut = 1.4 V.
The fan-shaped orientation is retained (Fig. 2a) with a slightly enlarged distance between the head group extremities with respect to the extremities of the alkyl chains as shown on Fig.2. The unit cell period P is established from the cross-section along the [120] direction. It is equal to 48.5±0.5 Å which is indeed close to TMoS2×9×√3=49.3 Å (see Tab. 1, Fig.S4).
To summarize, the packing structures of 10CB on HOPG and MoS2 are locally identical but with different epitaxial
properties. On the one hand, they display similar intermolecular distances and a fan-shaped arrangement of the molecules within the unit cell. They also display specific orientations of the molecules with respect to the crystallographic directions of the substrates leading to a unit-cell period of 41.7 Å along the longitudinal direction [1-10] on HOPG and of 48.5 Å, a much larger value, along [120] on MoS2.
The SAM of the 10CB molecules on Au[111] form domains
with various lateral sizes. The grain boundaries between domains correspond to dislocations of rows or disordered regions when the domains are tilted with respect to each other
(Fig. 3a). When the substrate has been specifically prepared, the Au[111] reconstruction can be observed, coexisting with the 10CB network and not strongly modified by the adsorbed molecules.
Figure 3. STM images of the SAM of 10CB molecules on an
Au[111] surface. (a) – the large-scale image (130×48 nm2) presents domains oriented in equivalent direction, different by 120°. (b) – the small-scale image (10×10 nm2) represents 10CB molecules arranged in a kinked structure. The molecules superimposed on the STM image define the most common cell structure containing eight molecules. The angle α is the angle between the crystallographic direction [110] of the Au substrate and the average row orientation created by the kinked structure. The period P of the cells packing runs along the [112] crystallographic direction. The corresponding STM parameters are It = 1.4 pA, Ut = 180 mV.
The observation of the Au[111] reconstruction suggests an orientation of the cyanobiphenyl groups only slightly disoriented from the direction perpendicular to the [110] (Fig. S6), thus in agreement with alkyl chains oriented along the [110] direction and the cyanobiphenyl groups at 35°-40° from the alkyl chain direction (Fig. S1 and S5). This suggestion is confirmed by a distance between the extremities of the alkyl chains equal to 5.9±0.1 Å, in other words very close to 2×TAu =
5.8 Å. The period P of the unit cells, measured along the [112] direction (Fig. 3b), is equal to 49.8±0.4 Å, which is close to 10×TAu×√3=49.9 Å. These measurements demonstrate the
local epitaxy of 10CB molecules also on Au[111] with the border of the unit-cell parallel to the [110] direction (see Tab. 1, Fig.S5). The comparison between the typical distances of the
Journal Name ARTICLE
This journal is © The Royal Society of Chemistry 20xxJ. Name., 2013, 00, 1-3 | 5 cells and their relationship with the underlying substrates are summarized in Tab.1 for each substrate, HOPG, MoS2 and
Au[111].
The 10CB kinked structure on Au[111] looks similar to the one on HOPG and MoS2 but a careful STM analysis of various
domains (Fig.3b) reveals two main differences. First, the number of molecules involved in the cells is different. Hence, even if we still can observe some packing made of 10 molecules in a cell, the majority of the cells are constituted of 8 molecules instead of 10, as revealed by Fig.3b and Fig.5b.
In addition, the alternation of cells with different numbers of molecules is not regular. Second, the network on Au[111] systematically displays an additional anisotropy. Indeed, the facing molecules in the cell are clearly not equivalent in terms of STM contrast of the −CH3 terminal groups of the alkyl
chains, as pointed out by the arrows on Fig. 3b (see also Fig.
5b). This observation reveals that within the cells, the alkyl chains present two different positions on the Au lattice. This suggests that the facing molecules have different interactions with the substrate. This evidences a new breaking of symmetry along the direction of the alkyl chains, leading to an additional chiral feature on Au[111], compared to HOPG and MoS2 only
characterized by the presence of the kinks.
Discussion
The three structures on the three substrates are obtained after evaporation of the solvent and are not changed after an annealing at around 50°C. The similarity between the structures obtained on the different substrates, their observed stability over time together with the result of the annealing, does not strictly demonstrate the equilibrium of the different structures but at least demonstrate that they are particularly stable structures. We indeed never observed a change of configuration while running the experiment. We thus analyse them using a phenomenological model based on the minimization of the free energy. Also, due to the large molecule-substrate and intermolecular interactions,
the entropy term may be neglected with respect to the energy term.
Epitaxy within the unit-cell
On HOPG the ordering of the 10CB molecules results from the
well-known epitaxy of the alkyl chains 46, 51. According to DFT simulations (Fig.S1a), the lowest energy conformation of a single and free 10CB molecule corresponds to an angle
ψ
between its alkyl chain and its cyanobiphenyl group at 37° that can fluctuate easily between 25° and 45°, due to the small torsion energy values. (Fig.S1) 40, 49.Since the mean distance between the alkyl chains on HOPG is of the order of 5.3 Å, the distance between the headgroups -calculated from simple geometric consideration lies around 5 Å but can easily reach 6 Å. This corroborates with both the observed fan-shape of the cyanobiphenyl groups showing a continuous variation of the angle ψ from one side to the other and the average distance between the endpoints of the
cyanobiphenyl groups which is closer to 6 Å than to the expected 5 Å. The minimum distance between the cyanobiphenyl groups is considered as 8 Å in the absence of repulsive interaction 52. For a distance of 6 Å between the cyanobiphenyl groups, there is an overlapping of the van der Waals radii (Fig. S7). The structure in the unit-cell being imposed by the alkyl chain packing, steric interactions must take place between the cyanobiphenyl groups and lead to the observed fan-shape structure within the unit-cells.
On MoS2, the distance between the alkyl chains is similar to
the one on HOPG and the same fan-shape is observed, leading to a distance between the cyanobiphenyl groups of the order of 6 Å in average, close to 2×TMoS2=6.3 Å. The epitaxy is now
driven by the cyanobiphenyl groups oriented in average along the [120] direction of MoS2, known to be the favorable
average orientation of the cyanobiphenyl groups on MoS2 48-50
. However, the distance between cyanobiphenyl groups remaining small, a fan-shape of the molecular structure is again induced within the unit-cell in relation with steric interactions.
Table 1. SAMs experimental parameters with respect to the substrate lattice parameters. SURFACE Lattice param.Substrate
T, Å
Separation. *
alkyl-chains, Å Shortest dist.† head-groups, Å Unit cell shift, Å Period of packing P, Å Number of mol. in a unit cell
HOPG 2.46 5.3±0.4 6±0.2 2.5±0.2 41.7±1.5 10
2×THOPG − THOPG 10×THOPG×√3
Au[111] 2.88 5.7±0.1 7.3 ±0.2 5.8±0.2 49.8±0.4 8/10 2×TAu − 2×TAu 10×TAu×√3 MoS2 3.16 5.5±0.4 6±0.5 7.8±0.7 48.5±0.5 10 − 2× TMoS2 − 9× TMoS2×√3
On Au[111], like on HOPG, the even larger alkyl
chain/substrate interactions 53 favor an orientation of all alkyl chains along the [110] direction. The Au[111] period is larger, but the still observed cyanobiphenyl fan-shaped arrangement suggests that the steric interactions between the cyanobiphenyl groups are still present in relation to a distance between the cyanobiphenyl groups still smaller than 8 Å52. To summarize, the unit cell structure of 10CB may be explained by a local epitaxy imposed by the molecule/substrate interactions favored by the alkyl chains on HOPG and Au[111] and by the cyanobiphenyl groups on MoS2,
On HOPG and on MoS2 the small lateral distances between the
molecules, in particular, the neighboring alkyl chains, also suggests non-negligible intermolecular attractive van der Waals interactions between neighboring molecules in the unit cell. However, how to explain the presence of the kinks on all substrates independently of the distance between neighboring molecules?
Origin of the kinks and consequences
A former theoretical investigation has shown that the kinks can induce the formation of an incommensurate SAM depending on the average distance between the kinks 40. The observation of cells on Au[111] of size varying between 8 and 10 molecules with no regular pattern is fully consistent with an incommensurate adsorbed structure. The feature that can be defined similarly for all studied substrates in order to characterize the kinked molecular rows is the angle α between the average row orientation associated with the kinks and the substrate crystallographic direction parallel to the short side of the cell (Fig. 1-3, Fig. S5). For α =0°, the rows are straight, and there is no kink-induced symmetry breaking. As such, α is one of the features defining the SAM chirality on a given substrate. It increases from HOPG to Au[111] : α = 4.7° for 10CB/HOPG, 8.9° for 10CB/MoS2, 10.2° for 10CB/Au[111]), evidencing larger
chiral features for 10CB/MoS2 and 10CB/Au[111] with respect
to 10CB/HOPG.
The theoretical model has shown that α depends on two parameters 40. The first parameter is the ratio P/L0, where P is the longitudinal period of packing along the substrate crystallographic direction (Fig. 1-3, Tab. 1), and L0 is the natural longitudinal period of a free-standing 10CB monolayer without substrate. L0 is expected to be close to two times the molecular length. For rows of period L0 non-negligible attractive interactions between neighboring rows are expected to be mediated by van der Waals attractions between the terminal groups of alkyl chains of molecules belonging to neighboring rows. It has already been shown that van der Waals attractions between the extremities of alkyl chains can be the driving force at the origin of a SAM structure, for example, for triphenylene molecules adsorbed on Au[111] 6. However, a period small enough to allow for significant attractive interactions between neighboring rows may be not compatible with a commensurate period, this latter being favorable for molecule/substrate interactions. The second parameter is thus the ratio of the molecule/substrate
interaction over the interaction between neighboring rows. As underlined by the ellipses on Fig. S5, in close proximity to the kinks, the distance between the extremities of alkyl chains belonging to neighboring rows is significantly decreased and thus the Van der Waals attractive interactions are increased. The kinks thus favor attractive inter-row interactions.
It has been shown in the theoretical model that the feature α defined by the kink value increases with P/L0 and thus with P 40
. This is in perfect agreement with the observed increasing P values from HOPG to Au[111] (Tab.1). The larger α values on MoS2 and Au[111] also suggest, according to the model, a
larger molecule/substrate interaction for these two latter substrates with respect to HOPG. Small α values are indeed only possible for small molecule/substrate interactions 40. The experimental observations thus allow for an interpretation of the two large P values obtained on MoS2 and on Au[111] (48.5
Å and 49.8 Å Table 1). In both cases, P could have been decreased to 8×a×√3 on MoS2 instead of 9×a×√3 and 9×a×√3
on Au[111] instead of 10×a×√3, without even reaching a value as small as the observed 41.7Å on HOPG. According to the model, a corresponding small α value would be obtained for small enough molecule/substrate interactions only. For large molecule/substrate interactions either α = 0 or large α values are possible 40.
To understand why α = 0 is not possible, we have to come back to the observed fan-shaped structure of the cyanobiphenyl groups, which demonstrates the presence of steric interactions between the cyanobiphenyl groups. These steric interactions can be released in the presence kinks and this explains the observed different STM contrast at the unit-cell border: the STM contrast would be associated with slightly different localization of the corresponding cyanobiphenyl groups to the underlying substrate. If steric interactions take place, the formation of infinitely straight rows (α = 0°) is not allowed. We consequently interpret the observed large (and similar) α and
P values on MoS2 and on Au[111] as related to similar large
molecule/substrate interactions, larger than the ones of the 10CB molecules on HOPG that prevent only small α values. Steric interactions between the cyanobiphenyl groups in the same time prevent the possibility of α = 0° (no kink).
Molecule/substrate interactions
We can now focus on the molecule/substrate interactions and use the previously obtained information to quantify them. It is well-known that similarly to HOPG and despite a non-real epitaxy of the –CH2– groups on Au[111], there is a strong
tendency of the alkyl chains to align along the [110] direction on Au[111] 53. This is in agreement with the measured distance between the alkyl chains, commensurate to Au[111]. Due to the favorable locations for the –CH2– groups of the alkyl chains
along the [110] direction 54, we would expect identical locations for all the alkyl chains in a 10CB cell on Au[111] 54. However, our experiment reveals different STM contrasts at the endpoints of the alkyl chains of the facing molecules (Fig.3 and Fig. 4b). This result suggests that two different molecule/substrate interactions may impose the observed
Journal Name ARTICLE
This journal is © The Royal Society of Chemistry 20xxJ. Name., 2013, 00, 1-3 | 7 10CB/Au[111] packing, namely not only the alkyl chain/Au[111] but also the cyanobiphenyl/Au[111] ones. To support this hypothesis, we have performed DFT calculations of the Au[111] interactions with an alkyl chain and with a cyanobiphenyl group. The results are presented on Fig. 4a where the interaction value is shown as a function of the distance between the functional group and the Au[111] lattice. We have recovered large alkyl chain/Au[111] interactions, at around –1.2 eV for an alkyl chain made of 10 methylene units. This value is close to –1.06 eV that can be extracted from the known value of –0.106 eV/CH2 group, previously found
experimentally 55. It is about two times larger than on HOPG 56.
Figure 4. a) Calculated adsorption energy curves for alkyl chain
made of 10 methylene units (black) and cyanobiphenyl head groups (red) on Au[111] surface, as a function of the molecule-surface distance – and b) STM image of 10CB molecules on Au[111] in multicolor scale which shows the difference of STM contrasts at the endpoints of facing molecules within a cell. Our simulations shown in Fig. 4a also evidence significant interactions between the cyanobiphenyl group and Au[111], at around –0.85 eV per cyanobiphenyl group. The fact that these two values are close to each other supports the hypothesis that in a 10CB cell on Au[111] both alkyl chains/Au[111] and cyanobiphenyl group/Au[111] can drive the molecule orientation and position. The observation of different STM contrasts for the facing molecules in a single cell (Fig.4b) constitutes evidence of their different locations with respect to the substrate. It thus suggests that significant variations of the interaction occur depending on the position of the functional group with respect to the Au[111] lattice. The consequence for
the two facing molecules is that either the alkyl chain/Au[111] or the cyanobiphenyl group/Au[111] interactions dominate. The importance of the location is already known for the alkyl chains on Au[111] 54. As a result, for the 10CB molecule made of the two groups attached, the alkyl chain and the cyanobiphenyl group, we may obtain two positions with respect to the substrate lattice of very close adsorption energy. These two locations may explain the different STM contrast of the facing molecules. It may then be responsible for the additional chiral feature of the 10CB structure on Au[111].
We have calculated the corresponding variations of cyanobiphenyl/Au[111] interactions when the location of the cyanobiphenyl group varies on the Au[111] surface, leading to variations as high as 0.25 eV (Fig.S8). Using DFT calculations, we estimate a 10CB/Au[111] interaction of around –2 eV per molecule. On HOPG, the dominating molecule/substrate interaction is with the alkyl chain. It is around –0.65 eV, in relation to the 10 –CH2 groups of 10CB 40. So the 10CB/HOPG
interaction can be considered as lower than –2×0.65 eV taking into account the cyanobiphenyl/HOPG interactions as lower than 0.65 eV per molecule. The 10CB/Au[111] interaction is thus larger in agreement with the analysis of the kinked structure in the previous section. We expect similar molecule/substrate interactions per unit length on MoS2 with
respect to Au[111], in relation to the close values of α and P for the two substrates. Based on the value obtained on Au[111], we obtain –2.2 eV per molecule on MoS2 accounting
for the different epitaxy between the two substrates that leads to different distances between molecules (Table 1). To evaluate the part of these interactions related to the alkyl chain/MoS2 interactions, we consider the case of an epitaxy of
the alkyl chain on MoS2 equivalent to the one on HOPG. This
gives a limit for the most significant interactions that can be expected. Van der Waals interactions are 1.5 larger on MoS2
than on HOPG, in relation to the differences between the dielectric permittivity of the two materials 57-61. So we calculate that the limit value is –1.5×0.65 = –0.97 eV. The interactions are even weaker since alkyl chains are not in epitaxy with MoS2. As a result, the interaction between the
cyanobiphenyl group and MoS2 is stronger than between the
alkyl chain and MoS2, despite a larger number of carbon atoms
in the alkyl chains. This result is in contrast with the Au[111] substrate (Fig.4). This confirms the occurrence of specific interactions between the cyanobiphenyl group and MoS2
already evidenced by the analysis of the 8CB SAM 62. This could be related to the dipolar nature of the MoS2 surface associated
with the presence of a plane of molybdenum below the last sulphur plane, thus favoring significant dipole-dipole interactions with the n-CB molecules and their large dipole moment 27.
Conclusions
In conclusion, combining STM measurements and DFT calculations, we interpret the variations of the 10CB monolayer organization on HOPG, MoS2 and Au[111] as the
molecule/substrate interactions and intermolecular interactions, where attractive van der Waals interactions between alkyl chains (both laterally and longitudinally) and between cyanobiphenyl groups, steric interactions between cyanobiphenyl groups are involved. The balance of interactions leads to kinked lamellar monolayers with various chiral features. Locally the structure is similar for all substrates and monitored by the epitaxy, either of the alkyl chains (for HOPG and Au[111]) or the cyanobiphenyl groups (for MoS2), which
controls the orientation of the unit-cell and its lateral structure. Ideally, this would induce non-kinked straight rows (α = 0), commensurate parallel and perpendicular to the rows. However, two interactions act against straight rows: (1) steric interactions between the cyanobiphenyl groups – they induce fan-shaped structures and are released in presence of kinks-; (2) attractive interactions between the rows – they mainly occur between the extremities of alkyl chains belonging to neighboring rows and are favored at the proximity of the kinks. For significant molecule/substrate interactions (MoS2 and
Au[111]), the smallest commensurate period perpendicular to the rows would impose straight rows which is forbidden. It is thus replaced by a large commensurate period. As a result, the attractive inter-row interactions also impose large kinks in order to minimize the inter-row distance. On MoS2 and
Au[111], of large and similar molecule/substrate interaction, large and similar average tilts of the rows are induced, corresponding to large chiral features, more significant than for HOPG. We expect this behavior to be generalizable to most of the kinked-row structures. Finally, using DFT calculations, we now understand the nature of the more significant interactions on Au[111] and MoS2. On Au[111], the
molecule/substrate interactions (around 2 eV per molecule) allow for an additional asymmetric feature, one of the facing molecule is dominated by the alkyl chain/Au[111] interaction, the other one by cyanobiphenyl group/ Au[111] interaction. On MoS2, this is not the case. The molecule/substrate
interactions (around 2.2 eV per molecule) are only dominated by the cyanobiphenyl group interaction with MoS2. It confirms
the specificity of the interaction of the n-CB series on MoS2,
most probably due to their large dipole moment. These large molecule/substrate interactions could also influence MoS2
monolayers for new attractive electronic properties.
Conflicts of interest
All authors declared no any conflicts of interests. The manuscript was written through the contributions of all authors. All authors have given approval to the final version of the manuscript.
Acknowledgments
The authors acknowledge the partial financial support of this work through the Collaborative Research Center (SFB) 767 of the Deutsche Forschungsgemeinschaft (DFG, German Research Foundation)
Notes
Supporting Information is available as separated file
References
References
1. Q. Ferreira, C. L. Delfino, J. Morgado and L. Alcácer, Materials (Basel), 2019, 12, 382.
2. L. Sosa-Vargas, E. Kim and A.-J. Attias, Materials Horizons, 2017, 4, 570-583.
3. K.-H. Ernst, in Supramolecular Chirality, eds. M. Crego-Calama and D. N. Reinhoudt, Springer Berlin Heidelberg, Berlin, Heidelberg, 2006, 209-252.
4. N. Katsonis, E. Lacaze and B. L. Feringa, Journal of Materials Chemistry, 2008, 18, 2065-2073.
5. J. A. A. W. Elemans, I. De Cat, H. Xu and S. De Feyter, Chemical Society Reviews, 2009, 38, 722-736.
6. P. Sleczkowski, N. Katsonis, O. Kapitanchuk, A. Marchenko, F. Mathevet, B. Croset and E. Lacaze, Langmuir, 2014, 30, 13275-13282.
7. H. Xu, E. Ghijsens, S. J. George, M. Wolffs, Ž. Tomović, A. P. H. J. Schenning and S. De Feyter, ChemPhysChem, 2013, 14, 1583-1590.
8. N. Katsonis, H. Xu, R. M. Haak, T. Kudernac, Ž. Tomović, S. George, M. Van der Auweraer, A. P. H. J. Schenning, E. W. Meijer, B. L. Feringa and S. De Feyter, Angewandte Chemie International Edition, 2008, 47, 4997-5001.
9. M. Parschau, S. Romer and K.-H. Ernst, Journal of the American Chemical Society, 2004, 126, 15398-15399. 10. F. Masini, N. Kalashnyk, M. M. Knudsen, J. R. Cramer, E. Lægsgaard, F. Besenbacher, K. V. Gothelf and T. R. Linderoth, Journal of the American Chemical Society, 2011, 133, 13910-13913.
11. K. Tahara, H. Yamaga, E. Ghijsens, K. Inukai, J. Adisoejoso, M. O. Blunt, S. De Feyter and Y. Tobe, Nature Chemistry, 2011, 3, 714.
12. Z. Guo, I. De Cat, B. Van Averbeke, J. Lin, G. Wang, H. Xu, R. Lazzaroni, D. Beljonne, E. W. Meijer, A. P. H. J. Schenning and
Journal Name ARTICLE
This journal is © The Royal Society of Chemistry 20xxJ. Name., 2013, 00, 1-3 | 9 S. De Feyter, Journal of the American Chemical Society, 2011, 133, 17764-17771.
13. J.-S. Zhao, Y.-B. Ruan, R. Zhou and Y.-B. Jiang, Chemical Science, 2011, 2, 937-944.
14. I. De Cat, Z. Guo, S. J. George, E. W. Meijer, A. P. H. J. Schenning and S. De Feyter, Journal of the American Chemical Society, 2012, 134, 3171-3177.
15. H. Cao, K. Tahara, S. Itano, Y. Tobe and S. De Feyter, The Journal of Physical Chemistry C, 2017, 121, 10430-10438. 16. S. De Feyter and F. C. De Schryver, Chemical Society Reviews, 2003, 32, 139-150.
17. K. S. Mali, N. Pearce, S. De Feyter and N. R. Champness, Chemical Society Reviews, 2017, 46, 2520-2542.
18. A. Bellec, C. Arrigoni, G. Schull, L. Douillard, C. Fiorini-Debuisschert, F. Mathevet, D. Kreher, A.-J. Attias and F. Charra, The Journal of Chemical Physics, 2011, 134, 124702.
19. Y. Fang, K. Tahara, O. Ivasenko, Y. Tobe and S. De Feyter, The Journal of Physical Chemistry C, 2018, 122, 8228-8235. 20. Y. Fang, E. Ghijsens, O. Ivasenko, H. Cao, A. Noguchi, K. S. Mali, K. Tahara, Y. Tobe and S. De Feyter, Nature Chemistry, 2016, 8, 711.
21. F. Kameche, A. Six, F. Charra, A.-T. Ngo, F. Mathevet, C. Salzemann, D. Kreher, I. Arfaoui, A.-J. Attias, C. Petit, Langmuir, 2017, 33, 12759-12765.
22. T. Tsuya, K. Iritani, K. Tahara, Y. Tobe, T. Iwanaga, S. Toyota, Chemistry A European Journal, 2015, 21, 5520-5527. 23. L. El-Kareh, P. Mehring, V. Caciuc, N. Atodiresei, A. Beimborn, S. Blügel, C. Westphal, Surface Science, 2014, 619, 67-70.
24. Xie, Z. X., X. Xu, B. W. Mao and K. Tanaka Langmuir, 2002, 18, 8, 3113-3116.
25. Gong, J.-R., L.-J. Wan, Q.-H. Yuan, C.-L. Bai, H. Jude and P. J. Stang Proceedings of the National Academy of Sciences of the United States of America, 2005, 102, 4, 971.
26. Gatti, R., J. M. MacLeod, J. A. Lipton-Duffin, A. G. Moiseev, D. F. Perepichka and F. Rosei The Journal of Physical Chemistry C, 2014, 118, 44, 25505-25516.
27. K. P. Gueu, E. Megnassan and A. Proutiere, Molecular Crystals and Liquid Crystals, 1986, 132, 303-323.
28. S. Taki, T. Kadotani and S. Kai, Journal of the Physical Society of Japan, 1999, 68, 1286-1291.
29. D. P. E. Smith, J. K. H. Horber, G. Binnig and H. Nejoh, Nature, 1990, 344, 641-644.
30. J. K. Spong, H. A. Mizes, L. J. Lacomb, M. M. Dovek, J. E. Frommer and J. S. Foster, Nature, 1989, 338, 137-139.
31. D. P. E. Smith, H. Horber, C. Gerber and G. Binnig, Science, 1989, 245, 43-45.
32. J. S. Foster and J. E. Frommer, Nature, 1988, 333, 542-545. 33. S. Taki, K. Sagara, T. Kadotani and S. Kai, Journal of the Physical Society of Japan, 1999, 68, 709-711.
34. D. P. E. Smith, Journal of Vacuum Science & Technology B, 1991, 9, 1119-1125.
35. Y. Iwakabe, M. Hara, K. Kondo, K. Tochigi, A. Mukoh, A. F. Garito, H. Sasabe and A. Yamada, Japanese Journal of Applied Physics Part 2-Letters, 1990, 29, L2243-L2246.
36. M. Hara, Y. Iwakabe, K. Tochigi, H. Sasabe, A. F. Garito and A. Yamada, Nature, 1990, 344, 228-230.
37. Y. Hu, K. Miao, L. Xu, B. Zha, M. Long, X. Miao and W. Deng, Physical Chemistry Chemical Physics, 2017, 19, 19205-19216. 38. Y. Hu, K. Miao, B. Zha, L. Xu, X. Miao and W. Deng, Physical Chemistry Chemical Physics, 2016, 18, 624-634.
39. K. S. Mali, K. Lava, K. Binnemans and S. De Feyter, Chemistry A European Journal, 2010, 16, 14447-14458. 40. E. Lacaze, P. Barois and R. Lacaze, Journal De Physique I, 1997, 7, 1645-1664.
41. M. M. Dovek, C. A. Lang, J. Nogami and C. F. Quate, Physical Review B, 1989, 40, 11973-11975.
43. L. J. P., J. Pavel, O. José, D. A. A., T. D. G., H. Barry, W. Hao, A. Gary, T. J. K., A. Enrique, W. Hong and D. D. A., Physica status solidi (b), 2011, 248, 1989-2007.
44. P. Sleczkowski, Y. J. Dappe, B. Croset, Y. Shimizu, D. Tanaka, R. Minobe, K. Uchida and E. Lacaze, The Journal of Physical Chemistry C, 2016, 120, 22388-22397.
45. Q. Chen, H.-J. Yan, C.-J. Yan, G.-B. Pan, L.-J. Wan, G.-Y. Wen and D.-Q. Zhang, Surface Science, 2008, 602, 1256-1266.
46. F. Faglioni, C. L. Claypool, N. S. Lewis and W. A. Goddard, The Journal of Physical Chemistry B, 1997, 101, 5996-6020.
47. K. Kobayashi and J. Yamauchi, Physical Review B, 1995, 51, 17085-17095.
48. E. Lacaze, A. Apicella, M. P. De Santo, D. Coursault, M. Alba, M. Goldmann and R. Barberi, Soft Matter, 2011, 7, 1078-1083.
49. E. Lacaze, M. Alba, M. Goldmann, J. P. Michel and F. Rieutord, Applied Surface Science, 2001, 175-176, 337-343. 50. E. Lacaze, J. P. Michel, M. Goldmann, M. Gailhanou, M. de Boissieu and M. Alba, Physical review. E, Statistical, nonlinear, and soft matter physics, 2004, 69, 041705.
51. A. J. Groszek, Proceedings of the Royal Society of London. A. Mathematical and Physical Sciences, 1970, 314, 473-498. 52. D. P. Ojha, P. L. Praveen, J., Phys. Chem. Solids, 2013, 74, 1653- 1659.
53. J. Cousty and A. Marchenko, Surface Science, 2002, 520, 128-136.
54. A. Marchenko, S. Lukyanets and J. Cousty, Physical Review B, 2002,
55. J. Libuda and G. Scoles, Journal of Chemical Physics, 2000, 112, 1522-1530.
56. A. J. Gellman and K. R. Paserba, Journal of Physical Chemistry B, 2002, 106, 13231-13241.
57. J. N. Israelachvili, Quarterly Reviews of Biophysics, 1974, 6, 341-387.
58. E. A. Taft and H. R. Philipp, Physical Review, 1965, 138, A197-A202.
59. S. Ergun, ed. M. Dekker, P.L. Walker Jr, New York, 1968, p. 48.
60. B. L. Evans and P. A. Young, Proceedings of the Royal Society of London Series a-Mathematical and Physical Sciences, 1965, 284, 402-422.
61. W. Y. Liang, Journal of Physics Part C Solid State Physics, 1971, 4, L378-81.
62. E. Lacaze, M. Alba, M. Goldmann, J. P. Michel and F. Rieutord, European Physical Journal B, 2004, 39, 261-272.
![Figure 3. STM images of the SAM of 10CB molecules on an Au[111] surface. (a) – the large-scale image (130×48 nm 2 ) presents domains oriented in equivalent direction, different by 120°](https://thumb-eu.123doks.com/thumbv2/123doknet/13600445.423872/5.892.107.405.95.526/figure-molecules-surface-presents-oriented-equivalent-direction-different.webp)
![Figure 4. a) Calculated adsorption energy curves for alkyl chain made of 10 methylene units (black) and cyanobiphenyl head groups (red) on Au[111] surface, as a function of the molecule-surface distance – and b) STM image of 10CB molecu](https://thumb-eu.123doks.com/thumbv2/123doknet/13600445.423872/8.892.104.374.303.760/figure-calculated-adsorption-methylene-cyanobiphenyl-function-molecule-distance.webp)
