Guo-Hai Chen*, Willibald Ruch and Yan-Na Li
Temperamental basis of sense of humor:
validating the
state-trait-cheerfulness-inventory in Mainland China
DOI 10.1515/humor-2015-0129
Abstract: This paper examined the reliability and validity of the State-Trait-Cheerfulness-Inventory (STCI) in Mainland China. The Chinese translation of the STCI-T<106i>, STCI-S<45i> and the Temporal Satisfaction with Life Scale (TSWLS) were administered to 476 university students (313 females, 157 males, 6 missing; 20.40 ± 1.35 years of age). Results showed that the STCI-T<106> and the STCI-S<45> had high Cronbach alphas ranging from 0.60 to 0.92 in Mainland China, and the factorial structures of the instruments were supported. The STCI-T<60> and STCI-S<30> were developed utilizing three criteria for the selection of items. Cronbach alphas were satisfactory ranging from 0.67 to 0.94. The factor structure of the items appeared to be highly generalizable in Mainland China. Joint factor analyses of the state and trait items yielded three factors (cheerful-ness, seriousness and bad mood) both as traits and states with the homologous concepts positively correlated. As expected, cheerfulness correlated negatively with bad mood, and cheerfulness correlated negatively with state seriousness. Meanwhile, seriousness correlated positively with bad mood. Moreover, life satisfaction was related positively with cheerfulness and negatively with bad mood, and could be predicted by high cheerfulness and low bad mood. Applications of the STCI-T<60> and STCI-S<30> in the Chinese context and future research are discussed.
Keywords: State-Trait-Cheerfulness-Inventory, Cheerfulness, Seriousness, Bad Mood, Life Satisfaction, Mainland China
1 Introduction
Sense of humor is conceptualized as a fairly stable personality trait or indivi-dual-difference variable, involving a general tendency to engage in humor-*Corresponding author: Guo-Hai Chen, School of Business,Guangdong University of Foreign Studies, China, E-mail: [email protected]
Willibald Ruch, University of Zurich, Switzerland
related behaviors across a range of situations (Martin 1996). Researchers have been measuring sense of humor as a personality trait for a long time (Andrews 1941; Eysenck 1942; Cattell and Luborsky 1947) and it has proved to be
multi-dimensional (Kuiper and Martin 1996) and related to people’s psychological
health (Martin and Lefcourt 1983; Martin et al. 2003; Thorson et al. 1997). In particular, it is perceived as a helpful stress-coping strategy and an important personality characteristic that significantly predicts quality of life (Hampes 1992; Korotkov and Hannah 1994; Martin and Lefcourt 1983).
Various approaches have been developed to locate and measure different constructs of sense of humor, including ability tests, behavioral observation techniques, self-report scales, and humor appreciation measures (see Ruch 1998 for a list of humor measures). However, which humor-related traits should be evaluated as individual-difference variables and which humor measure should be adopted is yet to be determined. Based on the state-trait model of exhilaratability, the State-Trait-Cheerfulness-Inventory (STCI) was introduced by Ruch et al. (1996; see also Ruch and Hofmann 2012) to assess the inter-individual and intra-individual differences in the temperamental basis of the sense of humor. It was postulated that cheerfulness, seriousness and bad mood represent actual (state) and habitual (trait) dispositions for lowered (cheerful) and enhanced (seriousness, bad mood) thresholds for the induction of exhilaration or other forms of humor behaviors. In other words, the STCI (Ruch et al. 1996, 1997) incorporates cheerfulness (CH), seriousness (SE), and bad mood (BM) as both traits (STCI-T) and states (STCI-S), which form the affective and attitudinal basis of the sense of humor. There were 5, 6, and 5 trait facets for cheerfulness, seriousness, and bad mood, respectively. The affective concept of trait cheerful-ness (CH) comprised the following 5 facets: a prevalence of cheerful mood (CH1), a low threshold for smiling and laughter (CH2), a composed view of adverse life circumstances (CH3), a broad range of active elicitors of cheerfulness and smil-ing/laughter (CH4), and a generally cheerful interaction style (CH5). The concept of trait seriousness (SE), as an attitude towards the world and habitual frame of mind, is composed of the six facets of the prevalence of serious states (SE1), a perception of even everyday happenings as important and considering them thoroughly and intensively (rather than treating them superficially) (SE2), the tendency to plan ahead and set long-range goals (and attaining the closest possible harmony with these goals in every action and decision) (SE3), the tendency to prefer activities for which concrete, rational reasons can be pro-duced (thereby considering activities which do not have a specific goal as a waste of time and nonsense) (SE4), the preference for a sober, object-oriented communication style (i. e., saying exactly what one means without exaggeration
cheerfulness-related behavior, roles, persons, stimuli, situations, and actions (SE6). The affective concept of trait bad mood (BM) is basically composed of the predominance of three mood states and their respective behaviors. These components are a generally bad mood (BM1), sadness (i. e., despondent and distressed mood) (BM2), and ill-humoredness (i. e., sullen and grumpy or grou-chy feelings) (BM4). The other two facets are specifically related to the sad (BM3)
and ill-humored (BM5) individual’s behavior in cheerfulness evoking situations,
their attitudes towards such situations and the objects, persons, and roles involved. For state dimensions of cheerfulness, seriousness and bad mood (Ruch et al. 1997), a shallower and outwardly directed aspect of hilarity (which merges felt action tendencies, such as being ready to laugh or to have some fun, with states of feeling merry and chipper) is separated from cheerful mood. Similarly, state seriousness is realized by the three facets of earnestness, pen-siveness, and soberness. State bad mood consists of the two facets of sadness/ melancholy and ill-humouredness. It is assumed that the STCI trait components form dispositions for the correspondent states (Ruch 1997a).
There are several forms of the STCI available for use (see Ruch and Hofmann 2012). The long trait form of the State-Trait-Cheerfulness Inventory (STCI-T; Ruch et al. 1996) is a 106-item questionnaire (STCI-T<106>) in a 4-point answer format
providing scores for the three traits of cheerfulness (STCI–T CH; 38 items),
ser-iousness (STCI–T SE; 37 items), and bad mood (STCI–T BM; 31 items) and their
5, 6, and 5 definitional facets, respectively. The standard trait form (STCI-T<60>) uses 60 items to assess trait cheerfulness, seriousness, and bad mood with 20 items for each scale. These measures showed good reliability with high Cronbach alpha coefficients (0.86 to 0.96 for the T<106>; 0.80 to 0.94 for the STCI-T<60>; Ruch et al. 1996) and retest reliability (0.77 to 0.86 for STCI-T<106>, interval of 4 weeks, N = 103; 0.73 to 0.86 for STCI-T<60>, interval of 3 weeks, N = 68; Ruch et al. 1996) and have been validated in a variety of settings (see Ruch and Köhler 1999, 2007), while there were no gender differences in any of the trait scales, seriousness increased steadily after age 40. No interaction was found between sex and age. The correlations between self- and peer-evaluation also turned out to be sufficiently high (Carretero-Dios et al. 2011; Ruch et al. 1996).
The standard state form (STCI-S <30>) has 30 items in a four-point answer format. The internal consistency coefficients of the STCI-S <30> were satisfactory (alpha coefficients ranging from 0.85 to 0.94; Ruch et al. 1997). No gender differences were found between the three states, while age was correlated significantly and positively with state seriousness. This relationship disappeared
(r = 0.03, p > 0.05) once trait seriousness was partialled out. Moreover, factor
analytic studies of several humor assessment instruments revealed that cheer-fulness, seriousness, and bad mood account for a large amount (52.8 % to 67.8
%) of the sense of humor (Köhler and Ruch 1996; Ruch et al. 1997; Ruch and Carrell 1998). In addition, confirmatory factor analyses by multilevel structural equation modeling showed that the three factors, both as states and traits, can reliably be assessed by the STCI-T (reliabilities of test parcels between 0.75 and 0.91; Carretero-Dios et al. 2011). Variations of these forms were generated for special purposes. The international and English version of the STCI (STCI-T <106i>, STCI-S <45i>; Ruch et al. 1994) was developed to serve the adaptation in different cultures.
The predictive ability of the STCI for affective experiences and behaviors was also proved in several studies. Firstly, the three dimensions (namely, cheerfulness, seriousness and bad mood) were linked to humor styles and personality traits. For example, regarding to four humor styles (two beneficial
humor styles – affiliative and self-enhancing, and two potentially detrimental
humor styles– aggressive and self-defeating; see Martin et al. 2003), affiliative
humor was strongly positively related to cheerfulness and negatively related to both seriousness and bad mood. Self-enhancing humor was also positively
related to cheerfulness and negatively related to bad mood, but not significantly
related to seriousness. Aggressive humor was significantly negatively related
only to seriousness, while self-defeating humor was significantly positively
related only to bad mood (Martin et al. 2003). Furthermore, trait cheerfulness was correlated with the socially warm, competent and earthy humor styles (Craik et al. 1996) and with the sense of humor (McGhee 1999; Ruch et al 2011). The Emotional Quotient (EQ) was positively correlated with trait cheerful-ness, and negatively correlated with trait bad mood. Trait cheerfulness was positively correlated with social competence, whereas trait bad mood was negatively correlated with social competence (Yip and Martin 2006). A pro-nounced enhancement of cheerfulness was accompanied by reduced feelings of stress and improved psychological well-being and subjective health. The effects were stronger in subjects with lower levels of trait seriousness (Papousek and Schulter 2008). Similarly, Hofmann and colleagues (2015) found that low trait cheerful individuals profited more from the presence of a laughing virtual companion when watching funny films, lifting their mood, self-rated mood and reported positive experience to comparable levels as individuals high in trait cheerfulness. Individuals with autism spectrum disorder scored significantly lower on trait cheerfulness and higher on trait seriousness (Samson et al. 2013). Individuals with autism spectrum disorder scored signifi-cantly lower on trait cheerfulness and higher on trait seriousness (Samson et al. 2013). Secondly, they were reported to be predictive of behaviors in experiments. For example, high cheerful mood states went along with hyper-expressivity, and low cheerful mood states went along with hypo-expressivity (Ruch 1997b).
Subjects low in trait seriousness had an overall higher pain tolerance. Subjects with a high score in trait cheerfulness showed an increase in pain tolerance after producing humor while watching the film, whereas subjects low in trait cheer-fulness showed a similar increase after smiling and laughter during the film (Zweyer et al. 2004). The intake of a single dose of Kava extract (300 mg; p.o.) led to an increase in state cheerfulness, while the phytopharmacon did not
influence state seriousness and bad mood (Thompson et al. 2004). Helping
behavior and physical activity were positively associated with cheerfulness (Sarid et al. 2010). Finally, the temperamental basis of sense of humor has been located in comprehensive models of personality, such as the Eysenckian PEN system or the five-factor model (Ruch and Köhler 2007).
Few previous studies examined the relationship between humor and life satisfaction. One Israeli study was found that humor was significantly related to life satisfaction (Littman-Ovadia and Lavy 2012). Another study involving 17,458 German speaking participants found humor to be related with life satisfaction all across the life span with the coefficients in the different age groups ranging from 0.26 to 0.34 with a median of 0.32 (Ruch et al. 2009). These two studies indicate that there is a robust correlation between humor and life satisfaction and it will be of interest to see how trait cheerfulness will stack up.
Since the publication of the STCI in 1996, several empirical studies on this instrument have been conducted in various countries, such as Germany, United States (Ruch et al. 1997), Canada (Martin et al. 2003), Chile (Tapia-Villanueva et al. 2014), Israel (Sarid et al. 2010), Spain (Carretero-Dios et al. 2011) and Romania (Ruch et al. 2011), but no previous empirical studies of the STCI has been conducted and examined in the Chinese context. Thus, the first purpose of this study is to examine the reliability and validity of the STCI in Mainland China. The second purpose is to test whether the STCI can predict life satisfaction.
2 Method
2.1 Participants and procedure
A total of 476 undergraduates (313 females, 157 males, 6 missing) in the ages from 17 to 24 (20.40 ± 1.35 years) from Guangdong University of Foreign Studies, Guangzhou, P. R. China, participated in this study. All participants were invited by their course teachers to fill out the questionnaires on a voluntary basis immediately before a lecture.
The translation of the STCI-T <106i> and STCI-S <45i> into Chinese under-went several steps, by using a procedure similar to Brislin’s (1970, 1976) back-translation method. In Step 1, all items were translated into Chinese by a Chinese professor of English literature and a Chinese postgraduate of English. Then the first author (Chen) of this paper compared both translations, discussed with the translators about the linguistic peculiarities and intent of several items and ended with a first translated item list. In Step 2, the first translated item list was back-translated into English by another Chinese professor of English litera-ture and another Chinese postgraduate of English literalitera-ture. Then the original author (Ruch) and his colleagues re-read the back-translated English version to verify the accuracy of translation. In Step 3, the Chinese translation of the STCI
was finalized after translators’ discussions and revisions according to the
sug-gestions of the first and second authors.
2.2 Inventories
Chinese translation of State-Trait-Cheerfulness-Inventory-Trait (STCI-T<106>, Ruch et al. 1994). The 106-item inventory contains 3 scales (cheerfulness, seriousness, and bad mood as traits). They are composed of 5, 6, and 5 facets, respectively. Each item of the scales is rated on a 4-point Likert scale from 1 to 4, with 1
indicating ‘strongly disagree’, and 4 indicating ‘strongly agree’ with the
statement.
Chinese translation of State-Trait-Cheerfulness-Inventory-State (STCI-S<45i>, Ruch et al. 1994). The 45-item inventory also contains three scales (cheerfulness, seriousness, and bad mood as states). Each item of the scales is rated on a
4-point Likert scale from 1 to 4, with 1 indicating ‘strongly disagree’, and 4
indicating‘strongly agree’ with the statement. Satisfactory psychometric
proper-ties for the STCI-T<106i> and the STCI-S<45i> were reported by Ruch et al. (1996, 1997).
Chinese Version of the Temporal Satisfaction with Life Scale (TSWLS; Ye 2006). The TSWLS consists of three subscales with different temporal focuses assessing past, present, and future life satisfaction. Each subscale has 3 items, respectively. Higher subscale score indicates higher life satisfaction for past, present, or future. The TSWLS uses a 7-point rating subscale, ranging from 1 (strongly disagree with the statement) to 7 (strongly agree with the statement). Reliability and validity of the TSWLS for Chinese respondents were reported to be satisfactory (Ye 2006). In the present sample, the Cronbach alphas coeffi-cients were 0.90, 0.90, 0.89 and 0.89 for past, present, future and total life satisfaction, respectively.
2.3 Data Analysis
First, basing on the item analysis for the STCI-T <106i> and STCI-S <45i>, two shorter standard forms (STCI-T <60> and STCI-S <30>) were developed. Second, factor analysis for the STCI-T <60> and STCI-S <30> were conducted respectively, after data were spilt into 2 groups (238 per group, one group consisted of odd number records while another group consisted of even number records; one for Exploratory Factor Analysis (EFA) and another for Confirmatory Factor Analysis (CFA). Third, the relationship between STCI-T and STCI-S was discussed under the joint factor analysis of STCI-T <60> and STCI-S <30>. Fourth, descriptive statistics and possible sex and age differences in cheerfulness, seriousness and bad mood were examined. Finally, partial correlations by controlling for age and sex were computed between the STCI and life satisfaction, and multiple regres-sions were also computed to predict life satisfaction from the STCI.
3 Results
3.1 Development of the standard form STCI-T <60>
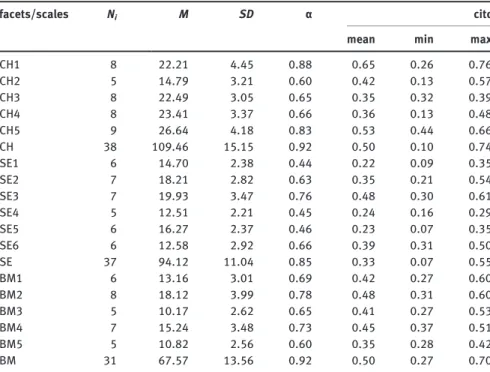
Item analysis of the STCI-T<106> showed that the psychometric characteristics for the total item pool were already quite good. Cronbach alphas ranged from 0.44 to 0.88 for facets and from 0.85 to 0.92 for scales (see Table 1). However, several corrected item-total correlations (citc) were low. This suggested that it was necessary to eliminate certain items.
The STCI-T <60>, which contains items from all facets was developed and constructed based on the following criteria as similar to that of Ruch et al.
(1996): (a) corrected item-total correlation (facet) ≥ 0.25; (b) corrected item-total
correlation (scale) ≥ 0.20; (c) corrected item-total correlation (citc) with its own
scale exceeding the ones of any other scale for at least 0.05; and (d) all facets selected should be represented by an equal proportion of the long version, i. e., there are 38, 37 and 31 items respectively in CH, SE and BM in STCI-T <106>, after the elimination of items, the number of each facet (CH, SE, and BM) should be
21, 21, 18 for the STCI-T <60>. Items were eliminated iteratively if they didn’t
match one of the former mentioned criteria. The psychometric characteristics of the scales are given in Table 2.
Table 2 shows that the reduction of items did not reduce the quality of the subscales. Cronbach alphas for the both scales of seriousness and bad mood decreased only by 0.01 respectively, but Cronbach alpha for the cheerfulness
scale increased by 0.02 and the mean citc even increased, by 0.12, 0.08, and 0.08 for the subscale Cheerfulness, Seriousness, and Bad Mood, respectively. After the elimination, the subscale Cheerfulness, Seriousness, and Bad Mood of STCI-T <60> includes 5, 5, and 4 facets, respectively.
Table 1: Psychometric characteristics of the facets and scales of the STCI-T<106>.
facets/scales Ni M SD α citc
mean min max
CH . . . . . . CH . . . . . . CH . . . . . . CH . . . . . . CH . . . . . . CH . . . . . . SE . . . . . . SE . . . . . . SE . . . . . . SE . . . . . . SE . . . . . . SE . . . . . . SE . . . . . . BM . . . . . . BM . . . . . . BM . . . . . . BM . . . . . . BM . . . . . . BM . . . . . .
Note: N = 476. Ni= number of items per facet/scale.α = Cronbach’s alpha. citc = corrected
item-total correlation.
Table 2: Psychometric characteristics of the scales of the STCI-T<60>.
Scales Ni M SD M/ Ni α r citc
mean min max
CH . . . . . . . .
SE . . . . . . . .
BM . . . . . . . .
Note: N = 476. Ni= number of items per subscale.α = Cronbach’s alpha. r = split-half reliability
3.2 Development of the standard form STCI-S <30>
Item analysis of the STCI-S<45> showed that the psychometric characteristics for the total item pool were already quite good. Cronbach alphas were 0.92, 0.60, and 0.92 for cheerfulness, seriousness, and bad mood, respectively. However, several corrected item-total correlations were low, and some correlations of the items with other scales were higher than those with their corresponding scale.
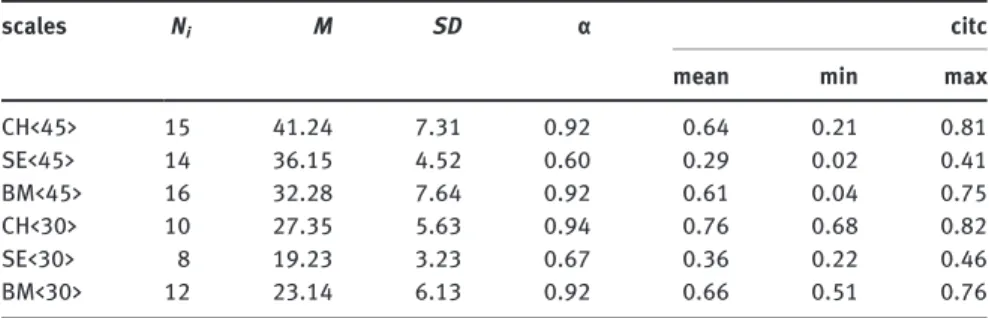
Starting with these results, the STCI-S <30> was developed. The selection of items was based on the criteria mentioned before when developing the STCI-T <60>. Items were eliminated iteratively if they did not match one of the former mentioned criteria. Based on these three criteria, 30 items were selected. The psychometric characteristics of the scales for the STCI-S <45> and STCI-S <30> are given in Table 3.
Table 3 shows that the elimination of items did not reduce the quality of the scales. Cronbach alphas remained high (0.94, 0.67, and 0.92 for cheerfulness, seriousness and bad mood, respectively) and the mean citc increased for all scales, by 0.12, 0.07, and 0.05, respectively.
3.3 Factor analysis for the STCI-T <60>
Facet intercorrelations. The results showed that there were consistently high positive intercorrelations among the facets of each scale (see Table 4), which was the same as in Ruch et al. (1996). The average intercorrelation was 0.63 for cheerfulness (coefficients ranged from 0.52 to 0.71), 0.40 for seriousness (0.28 to
0.48), and 0.70 for bad mood (0.63–0.78).
Table 3: Psychometric characteristics of the scales of the STCI-S<45> and STCI-S<30>.
scales Ni M SD α citc
mean min max
CH<> . . . . . . SE<> . . . . . . BM<> . . . . . . CH<> . . . . . . SE<> . . . . . . BM<> . . . . . .
Note: N = 476. Ni= number of items per subscale.α = Cronbach’s alpha. citc = corrected
Tab le 4: Intercorrelations amo ng the fac ets of the STCI-T< 60>. CH CH CH CH CH SE SE SE SE SE BM BM BM CH . ** CH . ** . ** CH . ** . ** . ** CH . ** . ** . ** . ** SE – . – . . . . SE – . – . – . . – . . ** SE . * . . * . ** . ** . ** . ** SE – . – . – . – . – . . ** . ** . ** SE – . – . . – . – . . ** ** . ** . ** BM – . ** – . ** – . ** – . ** – . ** . . ** – . ** . ** . BM – . ** – . ** – . ** – . ** – . ** . . ** – . ** . ** . . ** BM – . ** – . ** – . ** – . ** – . ** . . ** – . . ** . . ** . ** BM – . ** – . ** – . ** – . ** – . ** . . * – . ** . ** . . ** . ** . ** Note: = 467 *p< 05 **p< 01
The average facet intercorrelations generally yielded support for the pro-posed structural relationship between the three constructs. The mean coefficient
for the cheerfulness-seriousness-block was 0.01 (–0.08 to 0.20), the
cheerful-ness-bad mood-block was –0.45 (–0.58 to –0.34), and the seriousness-bad
mood-block was 0.05 (–0.17 to 0.25).
Exploratory factor analysis (EFA). For the respondents of Group I (n1 = 238), an exploratory analysis of the 14 facets was performed with SPSS 17.0. Three
factors’ eigenvalues exceeded 1 (the first four highest eigenvalues were 5.35,
2.64, 1.46, and 0.74), and also the scree-test suggested the retention of three factors explaining 67.5 % of the total variance. The unrotated solution confirms the model by showing that the facets of the respective scales form homogeneous clusters located around the centroids (average loadings of all facets of a con-struct). The location of the centroids indicates that the concepts are not ortho-gonal. An oblique rotation was undertaken, and the reference structure of the factors as well as the principal components are given in Table 5.
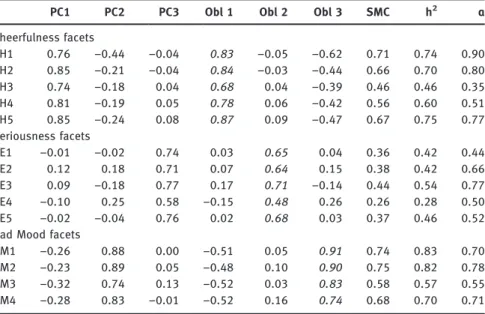
Table 5 shows that all the items were clustered into three factors, each factor included the items belong to the facets CH (Factor 1), SE (Factor 2), and BM (Factor 3) with unrotated principal component analysis, explaining 38 %, 18 %, Table 5: Loadings of the 14 STCI-T<60> facets on the three unrotated and obliquely rotated factors.
PC PC PC Obl Obl Obl SMC h ɑ
Cheerfulness facets CH . –. –. . –. –. . . . CH . –. –. . –. –. . . . CH . –. . . . –. . . . CH . –. . . . –. . . . CH . –. . . . –. . . . Seriousness facets SE –. –. . . . . . . . SE . . . . . . . . . SE . –. . . . –. . . . SE –. . . –. . . . . . SE –. –. . . . . . . .
Bad Mood facets
BM –. . . –. . . . . .
BM –. . . –. . . . . .
BM –. . . –. . . . . .
BM –. . –. –. . . . . .
Notes: Expected loadings were italicized. N = 238.PC = unrotated factors (principal compo-nents). Obl = reference structure.h2= communality.α = Cronbach alpha.
and 10 % of the variance, respectively, indicating that the development of STCI-T <60> retained most of the information and can represent the long version STCI-T <106> to a large extent.
Confirmatory Factor Analysis (CFA). For the respondents of Group II (n2 = 238), a confirmatory factor analysis was conducted with Lisrel 8.72, in which the 60 items defined the 14 first-order factors which defined the three second-order factors, namely cheerfulness, seriousness, and bad mood. A CFA was conducted and adjusted to test the hypothesized three-factor structure (according to the result of
EFA). Seven indices used for the goodness of model fit are as follows: (1)χ2/df (Bollen
1989), where a value lower than 3 indicates an acceptable fit; (2) RMSEA (Steiger 1990); (3) SRMR (Hu and Bentler 1998); (4) TLI (Tucker and Lewis 1973); and (5) CFI (Bentler 1990). For indices (2) and (3), values of 0.05 or lower indicates a good fit and values up to 0.08 indicate acceptable fit. For indices (4) and (5), values greater than 0.90 indicate an acceptable fit. Table 6 shows that the whole model still had a good and acceptable fit. Two and four factors models were also tested and they had a poor fit to the data.
3.4 Factor analysis for the STCI-S <30>
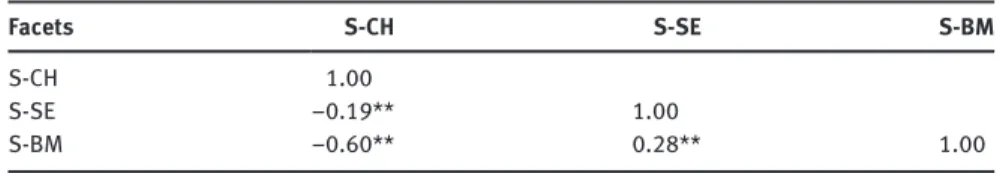
Facet intercorrelations. The scale intercorrelations yielded support for the proposed structural relationship between the three state scales (see Table 7), which is in accordance with Ruch et al. (1997). Cheerfulness was negatively
correlated with seriousness (r =–0.19; p < 0.01) and, more highly so, with bad
mood (r =–0.60; p < 0.01). Moreover, seriousness positively correlated with bad
mood (r = 0.28;p <.01).
Table 6: CFA fit indices of the STCI-T<60>.
χ/df RMSEA SRMR TLI CFI
. . . . .
Note: N = 238. For all indices, p < 0.05.
Table 7: Intercorrelations among the scales of the STCI-S<30>.
Facets S-CH S-SE S-BM
S-CH .
S-SE –.** .
S-BM –.** .** .
Exploratory factor analysis. For the respondents of Group I (n1 = 238), a principal components analysis of the 30 items was performed. Five factors’ eigenvalues exceeded 1 (the first six highest eigenvalues were: 11.28, 3.28, 2.21, 1.13, 1.08, and 0.96), and the scree-test suggested the retention of three factors is better, so we adopted the model with three factors, which explained 55.8 % of the total variance.
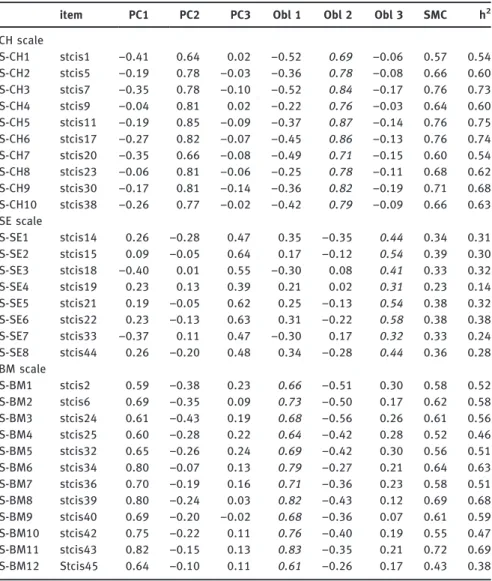
The results were similar to Ruch et al. (1997). The unrotated solution con-firms the model by showing that the scales of the respective items form homo-geneous clusters located around the centroids (average loadings of all items of a construct). The location of the centroids indicates that the concepts are not orthogonal. An oblique rotation was undertaken, and the reference structures of the factors (as well as the principal components) are given in Table 8. The factors were identified as cheerfulness (Factor 2), seriousness (Factor 3), and bad mood (Factor 1) with unrotated principal component analysis, explaining 10 %, 7 %, and 37 % of the variance, respectively.
Confirmatory Factor Analysis. For the respondents of Group II (n2 = 238), a confirmatory factor analysis for the hypothesized model was conducted with Lisrel 8.72, in which the 30 items defined the three first-order factors, namely cheerfulness, seriousness, and bad mood. Table 9 shows that the whole model still had a good and acceptable fit.
3.5 Intercorrelations among the state and trait factors
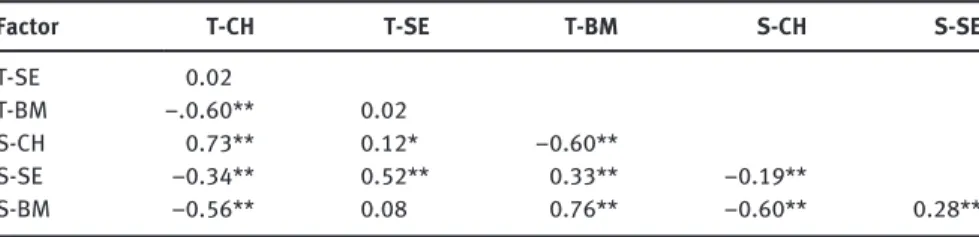
The intercorrelations among the primary factors are given in Table 10. It shows that the intercorrelations among the primary factors yielded some of the expected pattern. In the submatrices containing the state-trait correlations, the diagonals (i. e., correlations between homologous state-trait factors) yielded the highest coefficients and the homologous factors were positively correlated in the present sample. In other words, the state factors significantly and positively correlated with the homologous trait factors (cheerfulness,
serious-ness, and bad mood: r = 0.73, 0.52, and 0.76, respectively; allp < 0.01). Within
the states and traits, the three factors showed part of the expected pattern of relationship: cheerfulness correlated highly negatively with bad mood across states and traits, which was the same as in Ruch et al. (1997). However, cheerfulness (as state and trait) only correlated negatively with state serious-ness, but did not correlate significantly with trait seriousness. Moreover, ser-iousness (as state and trait) correlated significantly positively with bad mood, except that trait bad mood and seriousness (as state and trait) were not significantly correlated.
Table 8:. Loadings of the STCI-S <30> on the three unrotated and obliquely rotated factors.
item PC PC PC Obl Obl Obl SMC h
CH scale S-CH stcis –. . . –. . –. . . S-CH stcis –. . –. –. . –. . . S-CH stcis –. . –. –. . –. . . S-CH stcis –. . . –. . –. . . S-CH stcis –. . –. –. . –. . . S-CH stcis –. . –. –. . –. . . S-CH stcis –. . –. –. . –. . . S-CH stcis –. . –. –. . –. . . S-CH stcis –. . –. –. . –. . . S-CH stcis –. . –. –. . –. . . SE scale S-SE stcis . –. . . –. . . . S-SE stcis . –. . . –. . . . S-SE stcis –. . . –. . . . . S-SE stcis . . . . . . . . S-SE stcis . –. . . –. . . . S-SE stcis . –. . . –. . . . S-SE stcis –. . . –. . . . . S-SE stcis . –. . . –. . . . BM scale S-BM stcis . –. . . –. . . . S-BM stcis . –. . . –. . . . S-BM stcis . –. . . –. . . . S-BM stcis . –. . . –. . . . S-BM stcis . –. . . –. . . . S-BM stcis . –. . . –. . . . S-BM stcis . –. . . –. . . . S-BM stcis . –. . . –. . . . S-BM stcis . –. –. . –. . . . S-BM stcis . –. . . –. . . . S-BM stcis . –. . . –. . . . S-BM Stcis . –. . . –. . . .
Notes: Expected loadings were italicized. N = 238. PC = unrotated factors (principal compo-nents). Obl = reference structure. SMC = square of multiple correlation (estimated communality). h2= communality.
3.6 Age and gender differences in STCI-T <60> and STCI-S
<30>
In order to estimate the effects of sociodemographic variables, a series of 2 × 6 ANOVAs with sex and age (from 18 to 23) as independent variables and the STCI-T <60> and SSTCI-TCI-S <30> scales as dependent variables was computed.
Sex did not have an effect on trait cheerfulness (F[1, 451] = 0.00), trait seriousness (F[1, 451] = 1.84), or bad mood (F[1, 451] = 2.51). As regards age, there was no difference for STCI-T<60> seriousness (F[5, 451] = 0.84), cheerful-ness (F[5, 451] = 1.94) or bad mood (F[5, 451] = 1.26). There also was no interac-tion between sex and age (F[5,451] = 0.33, 0.81, and 0.95, respectively).
Sex did not have an effect on state bad mood (F[1, 451] = 0.10), state cheerfulness (F[1, 451] = 2.04), or seriousness (F[1, 451] = 1.79). As regards age, there was no difference for state cheerfulness (F[5, 451] = 1.79), seriousness (F[5, 451] = 0.49) and bad mood (F [5, 451] = 0.61). There also was no interaction between sex and age (F[5, 451] = 0.13, 1.20, and 0.28, respectively).
3.7 Correlations between STCI and TSWLS
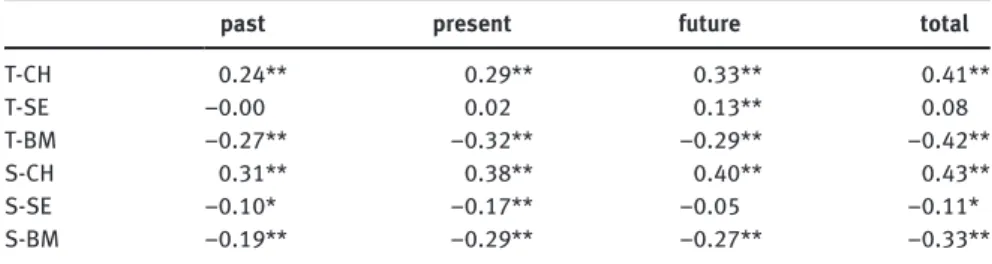
Partial Correlations between STCI-T <60>, STCI-S <30> and TSWLS by controlling for sex and age were calculated. The results are shown in Table 11.
Table 9: CFA fit indices of the STCI-S<30>.
χ/df RMSEA SRMR TLI CFI
. . . . .
Note: N = 238. For all indices, p < 0.05.
Table 10: Primary factor intercorrelations of the joint factor analysis of the 30 state and the 60 trait items.
Factor T-CH T-SE T-BM S-CH S-SE
T-SE .
T-BM –..** .
S-CH .** .* –.**
S-SE –.** .** .** –.**
S-BM –.** . .** –.** .**
Note: N = 476. * p < 0.05; ** p < 0.01. T-CH = trait cheerfulness; T-SE = trait seriousness; T-BM = trait bad mood. S-CH = state cheerfulness; S-SE = state seriousness; S-BM = state bad mood.
The results showed that life satisfaction was significantly and positively related to cheerfulness (average coefficients: 0.29, 0.36, and total coefficient: 0.41, 0.43,
both p < 0.01, for STCI-T <60> and STCI-S <30>, respectively), but negatively
related to bad mood (average coefficients: –0.29, –0.25, and total coefficient:
–0.42, –0.33, both p < 0.01, for STCI-T <60> and STCI-S <30>, respectively). However, in the present sample, life satisfaction was not significantly related
to seriousness (average coefficients: 0.08, –0.08, and total coefficient: 0.11,
–0.11, for STCI-T <60> and STCI-S <30>, respectively).
3.8 Predicting life satisfaction by STCI
Stepwise multiple regressions were performed, entering age and sex as predic-tors into the first block, the scales of trait and state as predicpredic-tors into the second block, and the total score of the TSWLS as the latent variable. The results showed that the scales of trait and state as a group explained 22 % of the total variance of life satisfaction by controlling for sex and age. The scales of STCI-S cheerfulness and STCI-T bad mood contributed significantly and positively to
the prediction of life satisfaction (R2= 0.22, F[1, 405] = 10.27,p < 0.001).
4 Discussion
This study generally confirmed the reliability and structural validity of the STCI in the Chinese language version. The psychometric characteristics of STCI-T<60> and STCI-S<30> were satisfactory as reported by Ruch et al. (1996, 1997). All reliabilities of the test parcels were rather high and within the range that is Table 11: Correlations between STCI and TSWLS.
past present future total
T-CH .** .** .** .** T-SE –. . .** . T-BM –.** –.** –.** –.** S-CH .** .** .** .** S-SE –.* –.** –. –.* S-BM –.** –.** –.** –.**
Note: N = 476. * p < 0.05; ** p < 0.01. CH = trait cheerfulness; SE = trait seriousness; T-BM = trait bad mood. S-CH = state cheerfulness; S-SE = state seriousness; S-T-BM = state bad mood.
usually expected for reliable scales, with Cronbach alpha coefficients ranging from 0.84 to 0.94 for STCI-T<60> and 0.67 to 0.94 for STCI-S<30>. Moreover, factor analyses showed that the trait and state factors could explain 67.5 % and 55.8 % of the total variance, respectively, and supported the three factors as both traits and states, with intercorrelations among the scales generally as expected. In addition, joint factor analyses yielded partial support for the relationship between STCI-T<60> and STCI-S<30>, which was similar to Ruch et al. (1997), i.e., cheerfulness correlated negatively with bad mood across states and traits, and negatively with state seriousness, and bad mood and seriousness correlated positively within states. Above all, the STCI is a reliable research instrument for assessing the temperamental basis of humor in Mainland China.
AS Nevertheless, three findings in this study are different from previous studies. Firstly, state seriousness was positively related to cheerfulness. This may be due to cultural differences. When people are in a serious mood, they
take a“humorless” attitude towards cheerfulness-related behaviors, roles,
per-sons, stimuli, situations and actions, thus cheerfulness is negatively correlated with state seriousness. However, in the Chinese culture, people adopt an implicit way in expressing emotions, while in the western culture, people adopt an explicit way (Feng 2007), meaning that in the Chinese culture, consistently serious people may tend to adopt an implicit way in expressing cheerfulness. For example, when they feel cheerful, their serious character may reserve them from expressing it. If
they don’t feel cheerful, they may still express a cheerful emotion towards certain
cheerfulness-related events or behaviors, so as to respect others’ face (Liao 2003). Secondly, trait bad mood was not significantly correlated with trait seriousness. One possible reason might be that a person with trait seriousness is not necessary one with trait bad mood in the Chinese context. Traditional Chinese people are reserved, serious and intrapersonal (Lin 1994), which does not indicate that they are in bad mood. Finally, in the Chinese context, there are no age differences in any of the trait and state scales, which is different from the results of Ruch et al. (1996). The possible reason is due to the sample chosen. Because the limited age range, the effect of age on the factors is not obvious.
The predictive validity of the STCI was supported by its relationship with life satisfaction. With differences in age and gender controlled, partial correlation revealed that life satisfaction was significantly positively related to cheerfulness and significantly negatively related to bad mood. However, life satisfaction was not significantly related to seriousness. One of the possible explanations is that cheerfulness entails a composed view of adverse life circumstances and a gen-erally cheerful interaction style, which contribute to the positive side of life. However, bad mood consists of sadness/melancholy and ill-humoredness, which is negative side of life. Therefore, cheerful people are more likely to feel
satisfied with life, while people who suffer from bad mood may feel unsatisfied with life. These results are similar to the review of Proctor et al. (2008) that positive evaluations of life satisfaction are linked with happiness and the
achievement of the“good life,” whereas negative evaluations of life satisfaction
are associated with depression and unhappiness. In other words, cheerfulness and bad mood are predictive of life satisfaction. But what could be the explana-tion for no contribuexplana-tion of seriousness? One possible explanaexplana-tion is that the questionnaire has to do with the very young sample. According to the results of Ruch et al. (1997), seriousness might not play a big role in young college students, but increases around the age of 40. Another possible explanation is that the items of the STCI-T<60> and the STCI-S<30> in this study did not
completely correspond to those of Ruch’s edition.
There are four limitations in this study which require mentioning. First, the samples were selected by convenience and it consists only of university students of similar age and social status. Further research should include participants of different ages or professions. Second, the present study relies mainly on self-report measures which may have been influenced by methodological artifacts, such as common method variance. Future research may obtain other sources of data, such as behavioral observations and peer ratings to validate the self-report measures or to replace the results of these measures. Third, although two demographic variables, sex and age, in affecting the factors of STCI were examined in the present research, other potential variables, such as big-five personality traits, were not examined. It may be very interesting to examine if the factors of STCI can be predicted by the big-five personality traits. Finally, in the present study, the Temporal Satisfaction with Life Scale (TSWLS) was used as the criterion of STCI and the validity test of STCI was insufficient. In order to further test the validity of STCI, it is recommended that humor measures such as Humor Styles Questionnaire (Martin et al. 2003) be used in future research. Acknowledgement: Thanks goes to Xiao-Cui Zheng and Jie-Yi Gao for their assistance with statistical analysis, and to Sonja Heintz and Jennifer Hofmann for helpful comments on an earlier version of the manuscript.
References
Andrews, T. Gaylord. 1941. A factorial analysis of responses to the comic as a study in personality. Journal of General Psychology 28. 209–224.
Bentler, Peter M. 1990. Comparativefit indexes in structural models. Psychological Bulletin 107. 238–246.
Brislin, Richard W. 1970. Back-translation for cross-cultural research. Journal of Cross-Cultural Psychology 1. 185–216.
Brislin, Richard W. 1976. Comparative research methodology: Cross-cultural studies. International Journal of Psychology 11. 215–229.
Carretero-Dios, Hugo, Michael Eid & Willibald Ruch. 2011. Temperamental basis of sense of humor: A multilevel confirmatory factor analysis of multitrait-multimethod data. Journal of Research in Personality 45. 153–164.
Cattell, Raymond B. & Lester B. Luborsky. 1947. Personality factors in response to humor. Journal of Abnormal and Social Psychology 42. 402–421.
Craik, Kenneth H., Martin D. Lampert & Arvalea J. Nelson. 1996. Sense of humor and styles of everyday humorous conduct. Humor: International Journal of Humor Research 9. 273–302. Eysenck, Hans Jürgen. 1942. The appreciation of humor: An experimental and theoretical study.
British Journal of Psychology 32. 295–309.
Feng, Manzheng. 2007. Personality differences between Chinese and Western cultures: Evidence from Chinese and English addressing terms (in Chinese). New West 24. 273–175. Hampes, William P. 1992. Relation between intimacy and humor. Psychological Reports 71. 127–
130.
Hofmann, Jennifer, Tracey Platt, Willibald Ruch, Radoslaw Niewiadomski & Jerome Urbain. 2015. The influence of a virtual companion on amusement when watching funny films. Advance online publication. Motivation and Emotion. doi:10.1007/s11031-014-9461–y
Hu, Li-tze & Peter M. Bentler 1998. Fit indices in covariance structure modeling: Sensitivity to underparameterized model misspecification. Psychological Methods 3. 424–453. Köhler, Gabriele & Willibald Ruch. 1996. Sources of variance in current sense of humor
inventories: How much substance, how much method variance? Humor: International Journal of Humor Research 9. 363–397.
Korotkov, David & Edward T.Hannah. 1994. Extraversion and emotionality as proposed super-ordinate stress moderators: A prospective analysis. Personality and Individual Differences 16. 787–792.
Kuiper, Nicholas. A. & Rod A. Martin. 1996. Is sense of humor a positive personality charac-teristic? In Willibald Ruch (ed.), The sense of humor: Explorations of a personality char-acteristic (Humor Research Series, 3), 159–178. Berlin: Mouton de Gruyter.
Liao, Chao-chih. 2003. Jokes, humor and Chinese people. Taiwan: Crane. Lin, Yu-tang. 1994. Chinese people. Beijing: Xuelin Press.
Littman-Ovadia, Hadassah & Shiri Lavy. 2012. Character strengths in Israel Hebrew Adaptation of the VIA Inventory of Strengths. European Journal of Psychological Assessment 28. 41–50. Martin, Rod A. 1996. The Situational Humor Response Questionnaire (SHRQ) and Coping Humor
Scale (CHS): A decade of research findings. Humor: International Journal of Humor Research 9. 251–272.
Martin, Rod A. & Herbert M. Lefcourt. 1983. Sense of humor as a moderator of the relation between stressors and moods. Journal of Personality and Social Psychology 45. 1313–1324.
Martin, Rod A., Patricia Puhlik-Doris, Gwen Larsen, Jeanette Gray & Kelly Weir. 2003. Individual differences in uses of humor and their relation to psychological well-being: Development of the Humor Styles Questionnaire. Journal of Research in Personality 37. 48–75. McGhee, Paul E. 1999. Humor, health and the amuse system. Dubuque: Kendall/Hunt. Papousek, Ilona & Gunter Schulter. 2008. Effects of a mood-enhancing intervention on
sub-jective well-being and cardiovascular parameters. International Journal of Behavioral Medicine 15. 293–302.
Proctor, Carmel L., P. Alex Linley & John Maltby. 2008. Youth life satisfaction: A review of the literature. Journal of Happiness Studies 10. 583–630.
Ruch, Willibald. 1997a. State and trait cheerfulness and the induction of exhilaration: A FACS study. European Psychologist 2. 328–341.
Ruch, Willibald. 1997b. Will the real relationship between facial expression and affective experience please stand up: The case of exhilaration. In Paul Ekman & Erika L. Rosenberg (eds.), What the face reveals: Basic and applied studies of spontaneous expression using the Facial Action Coding System, 89–108. Oxford: Oxford University Press.
Ruch, Willibald. 1998. Tools used for diagnosing humor states and traits. In Willibald Ruch (ed.), The sense of humor: Explorations of a personality characteristic, 405–412. Berlin: Mouton de Gruyter.
Ruch, Willibald & Amy Carrell. 1998. Trait cheerfulness and the sense of humor. Personality and Individual Differences 24. 551–558.
Ruch, Willibald & Jennifer Hofmann. (2012). A temperament approach to humor. In Paola Gremigni (ed.), Humor and health promotion, 79–112. New York: Nova Science. Ruch, Willibald & Gabriele Köhler. 1999. The measurement of state and trait cheerfulness. In
Ivan Mervielde, Ian Deary, Filip De Fruyt & Fritz Ostendorf (eds.), Personality psychology in Europe 7, 67–83. Tilburg: Tilburg University Press.
Ruch, Willibald & Gabriele Köhler. 2007. A temperamental approach to humor. In Ruch W. (ed.), The sense of humor: Explorations of a personality characteristic, 203–228. Berlin: Mouton de Gruyter. Ruch, Willibald, Gabriele Köhler, Lambert Deckers & Amy Carrell. 1994. The
State-Trait-Cheerfulness-Inventory-STCI International version. (Forms STCI-T, STCI-T peer, and STCI-S). Unpublished manuscript. University of Düsseldorf, Düsseldorf, Germany.
Ruch, Willibald, Gabriele Köhler & Christoph van Thriel. 1996. Assessing the temperamental basis of the sense of humor: Construction of the facet and standard trait forms of the State-Trait-Cheerfulness-Inventory– STCI. Humor: International Journal of Humor Research 9. 303–339.
Ruch, Willibald, Gabriele Köhler & Christoph van Thriel. 1997. To be in good or bad humor: Construction of the state form of the State-Trait-Cheerfulness-Inventory-STCI. Personality and Individual Differences 22. 477–491.
Ruch, Willibald, Otilia Mitrache, Claudia Esser & René T. Proyer. 2011. Cheerfulness and everyday humorous conduct. Anuarul Institutului de Istorie“George Baritiu” din Cluj-Napoca-Seria Humanistica 9. 67–87.
Ruch, Willibald, René T. Proyer & M. Weber. 2009. Humor as a character strength among the elderly. Zeitschrift für Gerontologie und Geriatrie 13(18). 1–6.
Samson, Andrea, Oskar Huber & Willibald Ruch. 2013. Seven decades after Hans Asperger’s observations: A comprehensive study of humor in individuals with
Atutism Spectrum Disorders. Humor: International Journal of Humor Research 26. 441–460. Sarid, Orly, Itshak Melzer, Ilan Kurz, Danit R. Shahar & Willibald Ruch. 2010. The effect of
helping behavior and physical activity on mood states and depressive symptoms of elderly people. Clinical Gerontologist 33. 1–13.
Steiger, James H. 1990. Structural model evaluation and modification: An interval estimation approach. Multivariate Behavioral Research 25. 173–180.
Tapia-Villanueva, Luis, Ivan Armijo, Ximena Pereira & Maria Elisa Molina. 2014. Chilean Spanish version of the State Trait Cheerfulness Inventory (STCI-T-60, trait form): Individual and couple forms. Humor: International Journal of Humor Research 27. 481–498.
Thompson, Richard, Willibald Ruch & Rudiger U. Hasenöhrl. 2004. Enhanced cognitive perfor-mance and cheerful mood by standardized extracts of Piper methysticum (Kava-Kava). Human Psychopharmacology: Clinical and Experimental 19. 243–250.
Thorson, James A., F. C. Powell, Ivan Sarmany-Schuller & William P. Hampes. 1997. Psychological health and sense of humor. Journal of Clinical Psychology 53. 605–619. Tucker, Ledyard R. & Charles Lewis. 1973. A reliability coefficient for maximum likelihood factor
analysis. Psychometrika (38). 1–10.
Ye, Shengquan. 2006. Validation of the temporal satisfaction with life scale in a sample of Chinese university students. Social Indicators Research 5. 475–492.
Yip, Jeremy A. & Rod A. Martin. 2006. Sense of humor, emotional intelligence, and social competence. Journal of Research in Personality 40. 1202–1208.
Zweyer, Karen, Barbara Velker & Willibald Ruch. 2004. Do cheerfulness, exhilaration, and humor production moderate pain tolerance? A FACS study. Humor: International Journal of Humor Research 17. 85–119.
Bionotes
Guo-Hai Chen
Guo-Hai (Porter) Chen, a full professor in management at the School of Business, Guangdong University of Foreign Studies, Guangzhou, China. He earned his PhD from The University of Hong Kong.He is also the Depuy Chairperson and General Secretary of Guangdong Academy of Human Resources. His research focus has been on organizational behavior, HR service, coaching, and humor from psychological and educational perspectives. He has so far published 20 books and over 80 articles on management, education and psychology.
Willibald Ruch
Willibald Ruch is a Full Professor of Psychology at the University of Zurich, Switzerland. His research interests are in the field of humor and laughter, cheerfulness and smiling. In his doctoral dissertation at the University of Graz (Austria) in 1980, he developed a taxonomy of jokes and cartoons and studied their relation to personality. His more recent work, together with his research team at the University of Zurich, includes humor from a positive psychology perspective, the effectiveness of humor training programs and clown interventions, the ability to laugh at oneself, the fear of being laughed at (i. e., gelotophobia), and the measurement of humor.
Yan-Na Li
Yan-Na Li is affiliated with the School of English for International Business, Guangdong University of Foreign Studies. Her research interests is mainly in research of relationship between thinking styles and business English learning proficiency and psychology of humor. She obtains the MA degree with research results of the relationship between thinking styles and business English learning proficiency.