HAL Id: hal-01160143
https://hal.archives-ouvertes.fr/hal-01160143
Submitted on 4 Jun 2015HAL is a multi-disciplinary open access
archive for the deposit and dissemination of sci-entific research documents, whether they are pub-lished or not. The documents may come from teaching and research institutions in France or abroad, or from public or private research centers.
L’archive ouverte pluridisciplinaire HAL, est destinée au dépôt et à la diffusion de documents scientifiques de niveau recherche, publiés ou non, émanant des établissements d’enseignement et de recherche français ou étrangers, des laboratoires publics ou privés.
Metal Substitution Effects on the Charge Transport and
Spin Crossover Properties of
[Fe1–xZnx(Htrz)2(trz)](BF4) (trz = Triazole)
Constantin Lefter, Simon Tricard, Haonan Peng, Gábor Molnár, Lionel
Salmon, Philippe Demont, Aurelian Rotaru, Azzedine Bousseksou
To cite this version:
Constantin Lefter, Simon Tricard, Haonan Peng, Gábor Molnár, Lionel Salmon, et al.. Metal Substitu-tion Effects on the Charge Transport and Spin Crossover Properties of [Fe1–xZnx(Htrz)2(trz)](BF4) (trz = Triazole). Journal of Physical Chemistry C, American Chemical Society, 2015, 119 (16), pp.8522-8529. �10.1021/acs.jpcc.5b01117�. �hal-01160143�
O
pen
A
rchive
T
OULOUSE
A
rchive
O
uverte (
OATAO
)
OATAO is an open access repository that collects the work of Toulouse researchers and
makes it freely available over the web where possible.
This is an author-deposited version published in :
http://oatao.univ-toulouse.fr/
Eprints ID : 13962
To link to this article : DOI:10.1021/acs.jpcc.5b01117
URL :
http://dx.doi.org/10.1021/acs.jpcc.5b01117
To cite this version :
Lefter, Constantin and Tricard, Simon and Peng, Haonan and
Molnár, Gábor and Salmon, Lionel and Demont, Philippe and
Rotaru, Aurelian and Bousseksou, Azzedine Metal Substitution
Effects on the Charge Transport and Spin Crossover Properties of
[Fe1–xZnx(Htrz)2(trz)](BF4) (trz = Triazole). (2015) Journal of
Physical Chemistry C, vol. 119 (n° 16). pp. 8522-8529. ISSN
1932-7447
Any correspondance concerning this service should be sent to the repository
administrator:
staff-oatao@listes-diff.inp-toulouse.fr
Metal Substitution E
ffects on the Charge Transport and Spin
Crossover Properties of [Fe
1
−x
Zn
x
(Htrz)
2
(trz)](BF
4
) (trz = Triazole)
Constantin Lefter,
†,‡Simon Tricard,
†Haonan Peng,
†Gábor Molnár,
†Lionel Salmon,
†Philippe Demont,
§Aurelian Rotaru,*
,‡and Azzedine Bousseksou*
,††LCC, CNRS, and Université de Toulouse (UPS, INP), Toulouse, F-31077 cedex 4, France
‡Faculty of Electrical Engineering and Computer Science & Advanced Materials and Nanotechnology Laboratory (AMNOL), Stefan
cel Mare University, 720229 Suceava, Romania
§Institut CarnotCIRIMAT, Université de Toulouse, Toulouse, 31062 cedex 9, France
ABSTRACT: In this study we analyze the metal substitution effects on the structural, morphological, charge transport, and spin transition properties of the [Fe1−xZnx(Htrz)2(trz)](BF4) (trz = triazole, x = 0, 0.26, or 0.43) compound using electron microscopy, powder X-ray diffraction, optical reflectivity, Raman, FTIR,57Fe Mössbauer, and broadband (10−2−106 Hz) dielectric spectroscopies. The crystal structure and the morphology of the objects remain nearly unaffected, whereas the thermal spin transition shifts from 362 to 316 K and the thermal hysteresis width decreases from 45 to 8 K for increasing values of x. For each compound the electrical conductivity drops when the iron(II) electronic configuration is switched from the low-spin to the high-spin state. A strong overall decrease in conductivity with increasing Zn concentration is also observed in both spin states. These results, together with the analysis of the charge carrier dynamics, suggest that the ferrous ions participate directly in the charge transport mechanism, explaining the strong spin-state dependence of the electrical properties in this compound.
1. INTRODUCTION
Spin crossover (SCO) complexes of 3d4−3d7transition-metal ions are known to display a bistability between their high-spin (HS) and low-spin (LS) electronic configurations.1−3The spin-state switching can be induced by various external stimuli, such as temperature, pressure, magneticfield, light irradiation, or gas sorption, and leads to a significant change of magnetic, optical, mechanical, and electrical properties. The recent progress in the nanoscale synthesis and organization of SCO compounds4,5has opened up novel perspectives for the study of charge transport properties of these materials at the nanoscale and even at the single molecule levels.6,7 Indeed, a number of recent theoretical8,9and experimental10−29achievements with respect to the possible interplay between SCO and conductivity properties gives hope that in the near future SCO complexes might be integrated in functional nanoelectronic and spintronic devices.
We recently investigated the charge transport properties of the SCO compound [Fe(Htrz)2(trz)](BF4) (trz = triazole) and revealed a strong dependence of the dc10 and ac11 conductivities on the spin state of the iron(II) ions. The LS (1A
1g) state was found to be systematically more conductive than the HS (5T
2g) state in samples with different morphologies (nanoparticles and microrods) and sizes (ranging from 15 nm to several micrometers). In addition, the charge carrier relaxation frequencies also displayed a significant decrease when going from the LS to the HS state.11 We tentatively
ascribed these observations to a conduction process via polaron hopping. In the frame of this model, the conductivity would rise upon the HS to LS switching (chiefly) due to an increase of the hopping frequency. This can be linked to the spin-state of the system through the variation of the phonon frequencies and/or through the variation of the hopping activation barriers.10 While their interpretation remains rather challenging at this stage, the accumulated experimental observations have already allowed several groups to elaborate simple nanoelectronic devices based on this compound, providing appealing perspectives for nanoscale switching and memory applica-tions.12−16 It is also worth noting that interesting size effects can be anticipated when going from the activated hopping10to the tunneling regime13because the spin transition was reported to have an opposite effect on the charge transport in these two limiting cases (typically one can expect tunneling bellow 10 nm).
The present work was motivated by the weak understanding of the physical phenomena that underlies the electrical conduction and its spin-state dependence in the title compound. The crystal structure of [Fe(Htrz)2(trz)](BF4) has been only recently inferred from high-quality powder X-ray diffraction (PXRD) measurements.30The same orthorhombic
space group (Pnma) has been found in the two spin states. The structure consists of chains of the [Fe(Htrz)2(trz)]n cationic motif (see Figure 1), wherein the BF4 anions are located in
cavities formed by the triazole ligands. Each chain is surrounded by six identical chains, which are connected through hydrogen bonds. An important aspect of the structure is the lack of voids, which could trap solvent molecules. The aim of the zinc(II) dilution in the present work is to break the supposed chain of conduction along the one-dimensional (1D) structure by exploiting the fact that the 3d orbitals of Zn(II) are fully occupied. On the other hand, the ionic radius of Zn(II) is close to the ionic radius of HS Fe(II), allowing for an isostructural substitution of the ferrous ions. Indeed, this type of metal dilution approach has been intensively used in spin crossover research in order to study the role of the cooperativity on the spin crossover phenomena.31−34 We have studied the charge transport properties of three different powders with formulas [Fe1−xZnx(Htrz)2(trz)](BF4), where x = 0, 0.26, or 0.43. Besides the electrical properties, each powder was carefully characterized for its morphology, crystal structure, and SCO properties.
2. EXPERIMENTAL METHODS
The undiluted microrods of the triazole coordination network [Fe(Htrz)2(trz)](BF4) (hereafter referred to as S1) were synthesized as described in ref 10. A 138 mg portion of 1-H-1,2,4-triazole (3 equiv) was mixed with 225 mg of Fe(BF4)2· 6H2O (1 equiv) in 2 mL of an HBF4solution at 2 wt % and left without agitation. A violet powder precipitated after 1 day. The dispersion was centrifuged and the precipitate was washed with water and dried under vacuum. The Zn-substituted samples were synthesized in a similar way, using 202 mg of Fe(BF4)2· 6H2O (0.9 equiv) + 23 mg of Zn(BF4)2·6H2O (0.1 equiv) for sample S2 and 180 mg of Fe(BF4)2·6H2O (0.8 equiv) + 45 mg of Zn(BF4)2·6H2O (0.2 equiv) for sample S3. EDX (energy dispersive X-ray spectroscopy) gave Zn:Fe ratios of ca. 1:1.3 and 1:3 for S2 and S3, respectively.
The spin transition of the samples was followed through variable-temperature optical reflectivity measurements in a dry nitrogen atmosphere. The reflectance was determined by means of an optical microscope (Olympus BX51) equipped with a CCD camera (Andor IkonM) and a 543 nm band-pass filter. The sample temperature was controlled using a Linkam THMS600 liquid nitrogen cryostat. During the experiment the temperature was changed at a rate of 2 K/min.
For the structural characterization of the compounds, we used FTIR, Raman, 57Fe Mössbauer, and PXRD methods. FTIR spectra were recorded at room temperature with a PerkinElmer Spectrum 100 spectrometer in ATR mode
(resolution ca. 1 cm−1) between 650 and 4000 cm−1. Variable-temperature Raman spectra were acquired using a LabramHR (Horiba) Raman microspectrometer (resolution ca. 3 cm−1) combined with a Linkam THMS600 cryostage. The 632.8 nm line of a He−Ne laser (0.1 mW) was focused on the sample by a×50 objective (numerical aperture = 0.5), which was also used to collect the scattered photons. These were filtered by an edge filter, but were not analyzed for their polarization state due to the random orientation of the particles in the sampled volume. Zero-field57Fe Mössbauer spectra were recorded using a flow-type liquid nitrogen cryostat and a conventional constant acceleration type Mössbauer spectrom-eter.γ-rays were provided by a57Co (Rh) source (ca. 20 mCi). The samples (∼30 mg) were enclosed in a Plexiglas sample holder with an optimized diameter. The spectrum deconvolu-tions were done with the assumption of Lorentzian line shapes using the Recoil software. The PXRD patterns of the samples have been recorded at room temperature using a Panalytical MPD XPertPro powder diffractometer [Cu Kα1, Ge(111) monochromator, X’Celerator detector] within the range 5°− 80° (2θ) by using a scan speed of 30°/h.
Particle size was determined by transmission electron microscopy (TEM) using a JEOL JEM-1011 (100 kV) instrument. TEM samples were prepared by placing a drop (10μL) of the nanoparticles suspended in dichloromethane on a carbon-coated copper grid. High-resolution imaging was performed on a JEOL JSM 2100F (200 kV) equipped also with a SDD Bruker EDX detector (resolution 127 eV) for elemental analysis.
Alternating current conductivity measurements were carried out as a function of frequency (10−2−106Hz) and temperature (270−400 K) by means of a BDS 4000 broadband dielectric spectrometer coupled to a Quatro Cryosystem (Novocontrol Technologies, Hundsangen, Germany) at an applied ac voltage of 1 V. Frequency sweeps were carried out isothermally. For electrical measurements, the powder samples were compacted between two stainless steel electrodes in a Teflon sample holder.
3. RESULTS AND DISCUSSION
3.1. Zn Substitution Effects on the Structure, Morphology, and Spin Transition Properties. Representa-tive TEM images of the samples are shown in Figure 2. Each sample displays similar particle morphology, forming microrods with an average length of ca. 2μm and a diameter of 200−300 nm. The same size and shape of the particles of the different samples is very important in order to be able to compare their conductivity. In conjunction with the TEM observations, EDX measurements were also carried out in order to evaluate the Zn/Fe ratio in the samples and to investigate the spatial distribution of the metal ions, which is also an important issue. The analysis performed on different rods for each sample revealed an average of 26 atom % of Zn in S2 and 43 atom % of Z n i n S 3 , w h i c h a r e t h e r e f o r e i d e n t ifie d a s [Fe0.74Zn0.26(Htrz)2(trz)](BF4) and [Fe0.57Zn0.43(Htrz)2 (trz)]-(BF4), respectively. The TEM-EDX analysis revealed also a homogeneous distribution of the Zn and Fe ions within the volume of the microrods, and no sign of ion segregation was observed (see Figure S1 in the Supporting Information).
The insertion of Zn ions within the crystal structure was investigated through X-ray diffraction and multiple spectro-scopic techniques (FTIR, Raman, Mössbauer spectroscopies). The powder X-ray diffractograms (Figure 3) show a globally
similar pattern for each compound, with some differences for sample S3. For samples S1 and S2, the main diffraction peaks are grouped for values of 2θ at 10° and 11°; 18° and 19°; and 24°, 25°, and 26°. The additional diffraction peaks visible in the spectra of sample S3 are consistent with a small HS fraction at room temperature in this compound (vide infra). Indeed, as was shown in ref 10, the LS to HS transition involves a shift of the diffraction peaks toward lower 2θ angles, due to the lattice expansion. In particular, the shifts of the Bragg peaks around 24°−26° upon the SCO are rather important. This effect is clearly observed in sample S3, with the shoulders at lower angles. Overall these PXRD results can be interpreted in agreement with the EDX analysis, indicating that the Zn ions do not segregate in our compounds and instead replace some of the Fe centers to give closely isostructural compounds.
Vibrational spectroscopy is also a useful technique to analyze the impact of metal dilution on the structure of our compounds and is a straightforward way to observe the spin transition with temperature. FTIR and Raman spectra of the three compounds are presented in the Supporting Information (Figures S2 and S3 and Tables S1 and S2). The most relevant conclusions can, however, be inferred from the temperature-dependent low-frequency Raman spectra, which are shown in Figure 4. As
discussed previously,35 the Raman spectra of the compound [Fe(Htrz)2(trz)](BF4) exhibit characteristic changes between 100 and 300 cm−1due to the spin transition. At 293 K (LS state) the sample S1 displays intense Raman modes around 135, 197, 211, 285, and 299 cm−1. When going to the HS state (413 K), one observes Raman peaks around 105, 136, 150 (shoulder), 180, and 190 cm−1. These spectra are essentially the same as those reported in ref 35. The same peaks and the same changes also appear in the Zn-diluted compounds, confirming their similar structure. (See also the midfrequency spectra in Figure S3 of the Supporting Information.) While the HS spectra of the three compounds are almost identical, in the LS state spectra of the diluted compounds we observe additional peaks around 160−166 cm−1and a broadening of the peaks at 135 and 245 cm−1in both samples (S2 and S3). This difference between the HS and LS spectra can be explained by the fact that the ionic radius of Zn(II) matches that of the HS Fe(II). The high-temperature Raman spectra are characteristic of the HS state for each sample without any significant residual LS fraction, which can be inferred clearly from the complete disappearance of the Raman peaks at 285 and 299 cm−1. On the other hand, even if the low-temperature Raman spectra are clearly characteristic of the LS state, it is difficult to estimate if the transition is complete in this direction due to the spectral overlaps. To verify if there is a residual HS fraction in the samples, we acquired57Fe Mössbauer spectra at low temper-atures (i.e., in the LS state). These spectra are shown in Figure 5 and the hyperfine parameters are collected in Table 1. In each case the spectrum can be properlyfitted by only one doublet, characteristic of the LS form of Fe(II). From these Mössbauer and Raman data we can thus conclude that the spin transition of the ferrous ions is complete in both the heating and cooling modes for each sample.
This spin transition in the samples is also visible through their optical properties, since their color turns from violet to white upon heating. This bleaching of the1A→1T ligand-field absorption band (centered at ca. 545 nm) is completely reversible and provides thus a convenient way to follow the SCO phenomena in our samples. The thermal variation of the optical reflectance in the green spectral region is shown in Figure 6 for each sample. As expected, the spin transition is shifted toward lower temperatures, and the hysteresis width decreases for increasing Zn substitution (Table 2). Such metal dilution effects are well-known and widely used by the spin crossover community to tune and investigate spin transition properties (see, for example, refs 1, 2, and 32−35). A short
Figure 2.Selected TEM images of samples S1−S3 (top to bottom).
Figure 3.Room-temperature powder X-ray diffractograms of samples S1−S3.
Figure 4.Low-frequency Raman spectra of samples S1−S3 in the two spin states (293 K, LS; 413 K, HS).
report on the Zn dilution of the title compound, wherein a similarthough somewhat less pronouncedshift of the spin transition was previously reported for a 20% Zn doping.36The downshift of the spin transition upon Zn doping can be explained by the fact that the ionic radius of the Zn2+ion (96 pm) is much closer to the ionic radius of Fe2+ions in the HS state (92 pm) than in the LS state (75 pm);37i.e., the LS lattice is destabilized due to the misfit of the Zn ions. On the other hand, the hysteresis in SCO compounds is known to occur due to the elastic interactions between the SCO centers. Since the Zn dilution leads to a decrease of the concentration of the SCO-active iron ions, the cooperativity of the system decreases, which is reflected by the shrinking of the hysteresis as well as by an increasingly gradual transition.1,2,32−38
3.2. Zn Substitution Effects on Charge Transport and Dielectric Properties. Broadband dielectric spectroscopy provides access to a wide range of electrical properties. In particular, the complex conductivityσ*(ω,T) and its frequency and temperature dependences give important information about the charge transport mechanism. The frequency dependence of the real part,σ′(ω), of the complex conductivity is reported in Figure 7a−c for each compound at different
temperatures both in the heating and cooling branches. The shape of the dispersion curves and the sample conductivity are strongly dependent on the spin state and the Zn dilution. For S1 the frequency dispersion of the electrical conductivity is strongly dependent on the spin state and temperature (Figure 7a), in good agreement with our previous reports on the pure complex.10,11 The conductivity σ′(ω) shows, at all temper-atures, a typical low-frequency plateau, characteristic of a nonlocalized or a long-range charge carrier mobility. Above the crossover frequency,ωc, the conductivityσ′(ω) increases with increasing frequency, obeying a power law. In other words, the ac conductivity spectra follow Jonscher’s power law39
σ ω σ ω σ ω ω ′ = + = + ⎡ ⎣ ⎢ ⎢ ⎛ ⎝ ⎜ ⎞ ⎠ ⎟⎤ ⎦ ⎥ ⎥ A ( ) n 1 n dc dc c (1)
Figure 5.57Fe Mössbauer spectra of samples S1−S3 recorded in the
LS state.
Table 1.57Fe Mössbauer Parameters of the Spectra Shown in Figure 5a
sample δ (mm/s) ΔEQ(mm/s) Γ/2 (mm/s)
S1 0.412(1) 0.270(1) 0.161(1) S2 0.451(2) 0.289(3) 0.155(3) S3 0.45(1) 0.31(2) 0.19(2)
aThe spectrum analysis was performed by assuming a single low-spin
ferrous species and Lorentzian line shapes.δ, isomer shift vs α-Fe at room temperature;ΔEQ, quadrupole splitting;Γ/2, width at
half-maximum.
Figure 6.Temperature dependence of the optical reflectance at 543 nm for samples S1−S3 presenting hysteresis loops between the heating and cooling modes.
Table 2. Spin Transition Temperatures of the Samples S1− S3 in the Cooling and Heating Cycles and the
Corresponding Hysteresis Loop Widths from Optical Reflectivity and Direct Current Conductivity
T1/2↓ (K) T1/2↑ (K) ΔT (K) sample opt refla dc condb opt refl dc cond opt refl dc cond
S1 340 348 385 377 45 29 S2 324 324 336 331 12 7 S3 312 314 320 320 8 6
aOptical reflectivity.bDirect current conductivity.
Figure 7.Frequency dependence of the ac conductivity at different temperatures in the heating (red open symbols) and cooling (blue filled symbols) modes for samples S1 (a), S2 (b), and S3 (c). Characteristic conductivity spectra in the LS state (red symbols) and HS state (blue symbols) for each sample (d).
whereσdcis the dc conductivity;ωcis the crossover frequency from the dc to the dispersive region, representing the hopping frequency of charge carriers; A is a temperature- and frequency-dependent parameter; and n is an exponent frequency-dependent on both frequency and temperature in the range 0 < n ≤ 1. This behavior is characteristic of the charge transport in disordered materials and was interpreted by Jonscher39 as a universal dynamic response (UDR). For S2 and S3, the plateau at low frequency is strongly reduced and the dispersion of the ac conductivity shifts to lower frequency, i.e.,ωcdecreases (Figure 7b,c), in agreement with the more insulating character of the diluted samples. Indeed, the conductivityσ′ of the samples at 10−2Hz (dc regime) and at 293 K (LS state) is ca. 10−10S cm−1 for S1, 10−13S cm−1for S2, and 10−16S cm−1for S3. This huge decrease in conductivity upon Zn substitution is observed in the whole investigated frequency and temperature range, i.e., in both spin states and conductivity regimes (ac and dc).
The thermal dependence of the real part of conductivity at fixed frequencies (Figure 8) shows a thermally activated
behavior, as well as a hysteresis loop, the width of which is strongly dependent on the Zn dilution level. Upon increasing the Zn fraction, the conductivity hysteresis loops become narrower, in reasonably good agreement with the optical reflectivity measurements (Table 2). At the LS−HS transition the conductivity drops by 2 orders of magnitude for S1, 1 order of magnitude for S2, and less than 1 order of magnitude for S3. In other words, the LS state is more conductive than the HS state in each sample, but the Zn substitution attenuates the conductivity difference between the two states. The activation energies of the conductivity were extracted at different frequencies using the Arrhenius law (see Figure S4, Supporting Information): σ′ =σ′ ⎛− σ ⎝ ⎜ ⎞ ⎠ ⎟ E k T exp 0 B (2)
whereσ0′ is the pre-exponential factor and Eσis the activation energy of the conduction process. For the three samples, the different values of Eσobtained from the Arrheniusfit in the LS and HS states at different frequencies are reported in Figure 9.
Even if the quality of thefit becomes rather low for samples S2 and S3, we can draw several important conclusions. First, the activation energy in the LS state is systematically lower than in the HS state. Second, the Zn dilution does not influence considerably the activation barriers of the conductivity. The activation energy has no frequency dependence below the cutoff frequency (ωc), but it decreases strongly for higher frequencies in each sample and in both spin states. The frequency at which the activation energy varies decreases upon increasing the percentage of the Zn dilution. This observation is in good agreement with the decrease ofωcwith the dilution.
We have also extracted the values ofωcand n by a nonlinear fitting procedure using eq 1 for each sample and each temperature. The temperature dependence of these two parameters are reported in Figures S5 and S6 in the Supporting Information. In these figures we observe the same hysteretic behavior related to the spin transition phenomenon. There is a clear decrease of the power law exponent n when going from the LS to the HS state, but no clear correlation exists with the Zn dilution; at room temperature (LS state) the values of n fall between 0.5 and 0.6 for each sample. The thermal variation of the hopping frequency ωcbrings more information about the charge transport mechanism in the samples. Most importantly, the hopping frequency decreases very significantly with the Zn dilution. In the LS state we found the hopping frequency to be 138 s−1 for S1, 0.12 s−1 for S2, and 0.01 s−1 for S3. Furthermore, ωc is always higher in the LS state, but its variation is decreasing with increasing amount of Zn impurities. Overall, the behavior ofωcshows a clear correlation with that
Figure 8.Temperature dependence of the ac conductivity for samples S1−S3 at low (a, c, e), and high frequencies (b, d, f).
Figure 9.Frequency dependence of the conductivity activation energy for samples S1−S3 in the two spin states.
of the conductivity σ′. We can thus suggest that the strong decrease of the conductivity with the Zn dilution as well as by the LS to HS transition is primarily governed by the decrease of the hopping frequency.
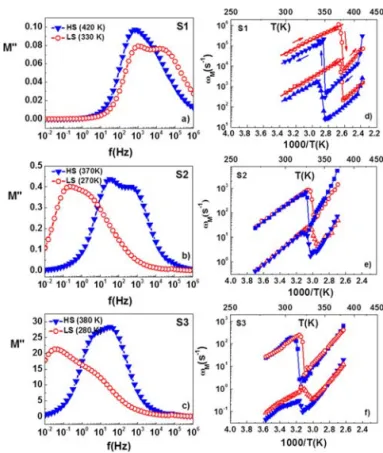
The dispersion behavior of the electrical conductivity in the frequency domain can also be interpreted in terms of conductivity relaxation time using the electric modulus, M* = 1/ε*, representation.40,41In the M* representation, a relaxation peak is observed for the conductivity process in the frequency spectra of the imaginary part M″ of the complex electric modulus M*. The frequency spectrum of the electrical modulus can be related to the mobility of the charge carriers.40−44 In particular, the broad relaxation peak, which is often seen in the M″ vs ω curves, represents the separation between long-range (or nonlocalized) and short-range (localized) conduction. Figure 10 shows the frequency response of the electric modulus
at selected temperatures. It is important to notice that the spectra for each sample clearly present two overlapping peaks, which we have fitted using the Havriliak−Negami (HN) empirical equation:44 ωτ * = ′ + ″ = − − + * α β ∞ ∞ M M iM M (M M ) [1 (i ) ] 0 M (3)
where M∞ = 1/ε∞ and M0= 1/ε0 are the limiting low- and high-frequency moduli, τM is a mean characteristic relaxation time related to the peak frequency ωM, while α and β are fractional shape parameters (0 <α, β < 1). The inverse of the maximum peak frequency of the M″ spectra represents the time scale of the transition from the long-range to short-range mobility and is defined as the characteristic conduction relaxation time (τM = 1/ωM). The temperature dependence of the relaxation peak frequencies is shown in Figure 10. For each sample, we can observe the hysteresis associated with the spin transition due to a decrease ofωMwhen going from the LS to the HS state, even if this variation is attenuated for increasing Zn doping level. One can note also that the relaxation frequencies for the same temperature and same spin state decrease drastically when Zn impurities are inserted. In the LS state the values ofωM1andω
M1are 5× 10²s−1and 4× 10⁴s−1 for sample S1, 4.5× 10⁻¹s−1and 2.7× 101s−1for sample S2, and 8× 10⁻²s−1and 2.3× 101s−1for sample S3.
It is tempting to correlate in a more quantitative manner the thermal behavior ofωM, ωc, and σdc, which are all thermally activated and show qualitatively similar evolution both with the spin transition and Zn dilution. Indeed, the temperature dependence of bothωMandωcobeys an Arrhenius law that can be described by the following equations
ω =ω ⎛− ⎝ ⎜ ⎞ ⎠ ⎟ E k T exp c 0h h B (4) ω = ⎛− ⎝ ⎜ ⎞ ⎠ ⎟ E E k T exp h 0M M B (5)
involving Eh, ω0h and EM, ω0M as activation parameters, respectively. We could obtain satisfactory fits for all kinds of activation parameters only for sample S1 (Table 3). For this compound, the activation energies extracted from electric modulus analysis agree with the values of dc conductivity and hopping frequency activation energies. In other words, similar energy barriers are involved both in the relaxation and conducting processes and it can therefore be assumed that these different representations of charge transport are equivalent. This conclusion is also supported by the very similar values obtained for the frequency pre-exponential factors (ω0h, ω0M1, and ω0M2). When comparing the spin-state dependence of activation parameters there is an obvious decrease of the activation energy when going from the HS to the LS state, while the spin-state dependence of the pre-exponential factors is less obvious. On the other hand, the activation energies (in a given spin state) are very similar in the pure and Zn-diluted samples (see Figure 9). The dramatic
Figure 10.Frequency dependence of the loss modulus in the LS and HS states for samples S1 (a), S2 (b), and S3 (c). Temperature dependence of the two deconvoluted relaxation peak frequencies for samples S1 (d), S2 (e), and S3 (f).
Table 3. Activation Parameters for Sample S1 in the HS and LS States Obtained from Arrhenius Dependence of the Direct Current Conductivity, the Hopping Frequency (ωc), and the Loss Peak Frequency (ωM) in the Heating (↑) and Cooling (↓) Modes
spin state Eσ(eV) σ0(S cm‑1) Eh(eV) ω0h(s‑1) EM1(eV) ω0M1(s‑1) EM2(eV) ω0M2(s‑1)
HS 0.61↑ 1× 10⁻² 0.59↑ 2× 10¹⁰ 0.67↑ 2× 10¹¹ 0.59↑ 2× 10¹⁰
0.61↓ 1× 10⁻² 0.58↓ 1× 10¹⁰ 0.64↓ 3× 10¹⁰ 0.58↓ 1× 10¹⁰
LS 0.51↑ 6× 10⁻² 0.56↑ 3× 10¹¹ 0.47↑ 4× 10¹⁰ 0.57↑ 5× 10¹¹
decrease ofσdc, ωM, and ωc with the dilution cannot be thus related to a change of the activation barriers. We suggest, therefore, that these changes are related either to a decrease of the charge carrier density (number of iron centers) and/or to a change of the hopping distance and the associated active phonon modes.
4. CONCLUSIONS
Electrical properties of a Zn-diluted series of the [Fe1−xZnx(Htrz)2(trz)](BF4) spin crossover compound were studied by broadband dielectric spectroscopy in a large frequency and temperature range. This study represents the first investigation of the influence of substitution of the “active” Fe centers by “inactive” Zn ions on the charge transport properties of a spin crossover compound. The metal substitution was found to be homogeneous, and the obtained compounds appeared closely isostructural. The iron ions kept their spin transition properties in the diluted samples, but as expected, a loss of cooperativity and a shift of the spin transition toward lower temperatures were observed with increasing the iron dilution by zinc. We have demonstrated that spin crossover phenomena can be detected through the temperature dependence of ac conductivity and dielectric loss, and we show that virtually all material-dependent electrical parameters, such as electrical conductivity, electric modulus, cutoff frequency, relaxation peak frequency, display a spin-state dependence. In particular, we have shown that the spin transition from the LS to the HS state led to a systematic decrease of the electrical conductivities and carrier hopping frequencies, which were related to the higher values of the activation energy in the HS state. The Zn substitution of active iron centers does not change the activation barriers but leads to an important decrease of the charge carrier hopping frequencies, which is reflected by the drop of the electrical conductivity by ca. 6 orders of magnitude (for x = 0.43). Taking into account the close structural and morphological similarity of the pure and Zn-diluted samples, these results indicate that the ferrous ions with open 3d6electronic shell directly participate in the charge transport process, in contrast to the Zn(II) ions, which have a closed 3d10shell.
■
ASSOCIATED CONTENT*
S Supporting InformationEDX, FTIR, and Raman data and additional analysis of the conductivity measurements. This material is available free of charge via the Internet at http://pubs.acs.org.
■
AUTHOR INFORMATIONCorresponding Authors
*A.R. e-mail: rotaru@eed.usv.ro.
*A.B. e-mail: azzedine.bousseksou@lcc-toulouse.fr.
Notes
The authors declare no competingfinancial interest.
■
ACKNOWLEDGMENTSThis work was founded by the joint French−Romanian project UEFISCDI, contract nos. 9RO-FR/01.02.2013 and ANR-12-IS07-0003-01. S.T. thanks the European community for financial support (Grant PCIG11-GA-2012-317692). C.L. thanks the French Ministry of Foreign Affairs (MAEE) for an Eiffel Scholarship.
■
REFERENCES(1) Gütlich, P.; Hauser, A.; Spiering, H. Thermal and Optical Switching of Iron(II) Complexes. Angew. Chem., Int. Ed. Engl. 1994, 33, 2024−2054.
(2) Gütlich, P.; Goodwin, H. A. Topics in Current Chemistry. Spin Crossover in Transition Metal Compounds; Springer-Verlag: Berlin, 2004; Vol. 233−235.
(3) Bousseksou, A.; Molnar, G.; Salmon, L.; Nicolazzi, W. Molecular Spin Crossover Phenomenon: Recent Achievements and Prospects. Chem. Soc. Rev. 2011, 40, 3313−3335.
(4) Cavallini, M. Status and Perspectives in Thin Films and Patterning of Spin Crossover Compounds. Phys. Chem. Chem. Phys. 2012, 14, 11867−11876.
(5) Shepherd, H. J.; Molnár, G.; Nicolazzi, W.; Salmon, L.; Bousseksou, A. Spin Crossover at the Nanometre Scale. Eur. J. Inorg. Chem. 2013, 2013, 653−661.
(6) Ruiz, E. Charge Transport Properties of Spin Crossover Systems. Phys. Chem. Chem. Phys. 2014, 16, 14−22.
(7) Molnar, G.; Salmon, L.; Nicolazzi, W.; Terki, F.; Bousseksou, A. Emerging Properties and Applications of Spin Crossover Nanoma-terials. J. Mater. Chem. C 2014, 2, 1360−1366.
(8) Baadji, N.; Sanvito, S. Giant Resistance Change across the Phase Transition in Spin-Crossover Molecules. Phys. Rev. Lett. 2012, 108, 217201−1−217201−5.
(9) Aravena, D.; Ruiz, E. Coherent Transport through Spin-Crossover Single Molecules. J. Am. Chem. Soc. 2012, 134, 777−779.
(10) Rotaru, A.; Gural’skiy, I. y. A.; Molnar, G.; Salmon, L.; Demont, P.; Bousseksou, A. Spin State Dependence of Electrical Conductivity of Spin Crossover Materials. Chem. Commun. 2012, 48, 4163−4165.
(11) Lefter, C.; Gural’skiy, I. y. A.; Peng, H.; Molnár, G.; Salmon, L.; Rotaru, A.; Bousseksou, A.; Demont, P. Dielectric and Charge Transport Properties of the Spin Crossover Complex [Fe-(Htrz)2(trz)](BF4). Phys. Status Solidi RRL 2014, 8, 191−193.
(12) Rotaru, A.; Dugay, J.; Tan, R. P.; Gural’skiy, I. y. A.; Salmon, L.; Demont, P.; Carrey, J.; Molnar, G.; Respaud, M.; Bousseksou, A. Nano-Electromanipulation of Spin Crossover Nanorods: Towards Switchable Nanoelectronic Devices. Adv. Mater. 2013, 25, 1745−1749. (13) Prins, F.; Monrabal-Capilla, M.; Osorio, E. A.; Coronado, E.; van der Zant, H. S. J. Room-Temperature Electrical Addressing of a Bistable Spin-Crossover Molecular System. Adv. Mater. 2011, 23, 1545−1549.
(14) Etrillard, C.; Faramarzi, V.; Dayen, J.-F.; Letard, J.-F.; Doudin, B. Photoconduction in Fe(Htrz)2(trz)(BF4)·H2O Nanocrystals. Chem.
Commun. 2011, 47, 9663−9665.
(15) Lefter, C.; Tan, R.; Dugay, J.; Tricard, S.; Molnár, G.; Salmon, L.; Carrey, J.; Rotaru, A.; Bousseksou, A. Light Induced Modulation of Charge Transport Phenomena across the Bistability Region in [Fe(Htrz)2(trz)](BF4) Spin Crossover Micro-Rods. Phys. Chem.
Chem. Phys. 2015, 17, 5151−5154.
(16) Dugay, J.; Giménez-Marqués, M.; Kozlova, T.; Zandbergen, H. W.; Coronado, E.; van der Zant, H. S. J. Spin Switching in Electronic Devices Based on 2D Assemblies of Spin-Crossover Nanoparticles. Adv. Mater. 2015, 27, 1288−1293.
(17) Gopakumar, T. G.; Matino, F.; Naggert, H.; Bannwarth, A.; Tuczek, F.; Berndt, R. Electron-Induced Spin Crossover of Single Molecules in a Bilayer on Gold. Angew. Chem.,Int. Ed. 2012, 51, 6262− 6266.
(18) Pronschinske, A.; Chen, Y.; Lewis, G. F.; Shultz, D. A.; Calzolari, A.; Buongiorno Nardelli, M.; Dougherty, D. B. Modification of Molecular Spin Crossover in Ultrathin Films. Nano Lett. 2013, 13, 1429−1434.
(19) Osorio, E. A.; Moth-Poulsen, K.; van der Zant, H. S. J.; Paaske, J.; Hedegård, P.; Flensberg, K.; Bendix, J.; Bjørnholm, T. Electrical Manipulation of Spin States in a Single Electrostatically Gated Transition-Metal Complex. Nano Lett. 2009, 10, 105−110.
(20) Meded, V.; Bagrets, A.; Fink, K.; Chandrasekar, R.; Ruben, M.; Evers, F.; Bernand-Mantel, A.; Seldenthuis, J. S.; Beukman, A.; van der Zant, H. S. J. Electrical Control over the Fe(II) Spin Crossover in a
Single Molecule: Theory and Experiment. Phys. Rev. B 2011, 83, 245415−1−245415−13.
(21) Alam, M. S.; Stocker, M.; Gieb, K.; Muller, P.; Haryono, M. Student, K.; Grohmann, A. Spin-State Patterns in Surface-Grafted Beads of Iron(II) Complexes. Angew. Chem., Int. Ed. 2010, 49, 1159− 1163.
(22) Salmon, L.; Molnar, G.; Cobo, S.; Oulie, P.; Etienne, M.; Mahfoud, T.; Demont, P.; Eguchi, A.; Watanabe, H.; Tanakae, K.; et al. Re-Investigation of the Spin Crossover Phenomenon in the Ferrous Complex [Fe(HB(pz)3)2]. New J. Chem. 2009, 33, 1283−1289.
(23) Shi, S.; Schmerber, G.; Arabski, J.; Beaufrand, J. B.; Kim, D. J.; Boukari, S.; Bowen, M.; Kemp, N. T.; Viart, N.; Rogez, G.; et al. Study of Molecular Spin-Crossover Complex Fe(phen)2(NCS)2Thin Films.
Appl. Phys. Lett. 2009, 95, 043303−1−043303−3.
(24) Faulmann, C.; Jacob, K.; Dorbes, S.; Lampert, S.; Malfant, I.; Doublet, M. L.; Valade, L.; Real, J. A. Electrical Conductivity and Spin Crossover: A New Achievement with a Metal Bis Dithiolene Complex. Inorg. Chem. 2007, 46, 8548−8559.
(25) Takahashi, K.; Cui, H. B.; Okano, Y.; Kobayashi, H.; Einaga, Y.; Sato, O. Electrical Conductivity Modulation Coupled to a High-Spin-Low-Spin Conversion in the Molecular System [FeIII(qsal)2
][Ni-(dmit)2]3·CH3CN·H2O. Inorg. Chem. 2006, 45, 5739−5741.
(26) Nihei, M.; Takahashi, N.; Nishikawa, H.; Oshio, H. Spin-Crossover Behavior and Electrical Conduction Property in Iron(II) Complexes with Tetrathiafulvalene Moieties. Dalton Trans. 2011, 40, 2154−2156.
(27) Koo, Y.-S.; Galán-Mascarós, J. R. Spin Crossover Probes Confer Multistability to Organic Conducting Polymers. Adv. Mater. 2014, 26, 6785−6789.
(28) Mahfoud, T.; Molnar, G.; Cobo, S.; Salmon, L.; Thibault, C.; Vieu, C.; Demont, P.; Bousseksou, A. Electrical Properties and Non-Volatile Memory Effect of the Fe(HB(pz)3)2Spin Crossover Complex
Integrated in a Microelectrode Device. Appl. Phys. Lett. 2011, 99, 053307−1−053307−3.
(29) Miyamachi, T.; Gruber, M.; Davesne, V.; Bowen, M.; Boukari, S.; Joly, L.; Scheurer, F.; Rogez, G.; Yamada, T. K.; Ohresser, P.; et al. Robust Spin Crossover and Memristance across a Single Molecule. Nat. Commun. 2012, 3, 938−1−938−6.
(30) Grosjean, A.; Négrier, P.; Bordet, P.; Etrillard, C.; Mondieig, D.; Pechev, S.; Lebraud, E.; Létard, J.-F.; Guionneau, P. Crystal Structures and Spin Crossover in the Polymeric Material [Fe(Htrz)2(trz)](BF4)
Including Coherent-Domain Size Reduction Effects. Eur. J. Inorg. Chem. 2013, 5−6, 796−804.
(31) Sorai, M.; Ensling, J.; Gutlich, P. Mössbauer-Effect Study on Low-Spin 1A1 ⇌ High-Spin 5T2 Transition in Tris(2-picolylamine)
iron Chloride. 1. Dilution Effect in [FexZn1‑x(2PIC)Cl2.C2H5OH].
Chem. Phys. 1976, 18, 199−209.
(32) Martin, J. P.; Zarembowitch, J.; Bousseksou, A.; Dworkin, A.; Haasnoot, J. G.; Varret, F. Solid-State Effects on Spin Transitions Magnetic, Calorimetric, and Mössbauer-Effect Properties of FexCO1‑x(4,4′-bis-1,2,4-triazole)2(NCS)2·H2O Mixed-Crystal
Com-pounds. Inorg. Chem. 1994, 33, 6325−6333.
(33) Spiering, H.; Meissner, E.; Koppen, H.; Muller, E. W.; Gutlich, P. The Effect of the Metal Lattice Expansion on the High-Spin Low-Spin Transitions. Chem. Phys. 1982, 68, 65−71.
(34) Hauser, A.; Vef, A.; Adler, P. Intersystem Crossing Dynamics in Fe(II) Coordination-Compounds. J. Chem. Phys. 1991, 95, 8710− 8717.
(35) Moussa, N. O.; Ostrovskii, D.; Garcia, V. M.; Molnar, G.; Tanaka, K.; Gaspar, A. B.; Real, J. A.; Bousseksou, A. Bidirectional Photo-Switching of the Spin State of Iron(II) Ions in a Triazole Based Spin Crossover Complex within the Thermal Hysteresis Loop. Chem. Phys. Lett. 2009, 477, 156−159.
(36) Coronado, E.; Galan-Mascaros, J. R.; Monrabal-Capilla, M.; Garcia-Martinez, J.; Pardo-Ibanez, P. Bistable Spin-Crossover Nano-particles Showing Magnetic Thermal Hysteresis near Room Temper-ature. Adv. Mater. 2007, 19, 1359−1361.
(37) Tanasa, R.; Enachescu, C.; Stancu, A.; Varret, F.; Linares, J.; Codjovi, E. Study of Impurities Effect in Spin Crossover Compounds
Using First Order Reversal Curves (FORC) Method. Polyhedron 2007, 26, 1820−1824.
(38) Rotaru, A.; Dirtu, M. M.; Enachescu, C.; Tanasa, R.; Linares, J.; Stancu, A.; Garcia, Y. Calorimetric Measurements of Diluted Spin Crossover Complexes [FexM1‑x(btr)2(NCS)2]·H2O with MII= Zn and
Ni. Polyhedron 2009, 28, 2531−2536.
(39) Jonscher, A. K. The ‘Universal’ Dielectric Response. Nature 1977, 267, 673−679.
(40) Macedo, P. B.; Moynihan, C. T.; Bose, R. Role of Ionic Diffusion in Polarisation in Vitreous Ionic Conductors. Phys. Chem. Glasses 1972, 13, 171−179.
(41) Gerhardt, R. Impedance and Dielectric Spectroscopy Revisited: Distinguishing Localized Relaxation from Long-Range Conductivity. J. Phys. Chem. Solids 1994, 55, 1491−1506.
(42) Molnar, G.; Cobo, S.; Mahfoud, T.; Vertelman, E. J. M.; van Koningsbruggen, P. J.; Demont, P.; Bousseksou, A. Interplay Between the Charge Transport Phenomena and the Charge-Transfer Phase Transition in RbxMn[Fe(CN)6]y·H2O. J. Phys. Chem. C 2009, 113,
2586−2593.
(43) Rouahi, A.; Kahouli, A.; Challali, F.; Besland, M. P.; Vallee, C.; Yangui, B.; Salimy, S.; Goullet, A.; Sylvestre, A. Impedance and Electric Modulus Study of Amorphous TiTaO Thin Films: Highlight of the Interphase Effect. J. Phys. D: Appl. Phys. 2013, 46, 065308−065315.
(44) Havriliak, S.; Negami, S. A Complex Plane Representation of Dielectric and Mechanical Relaxation Processes in some Polymers. Polymer 1967, 8, 161−210.