HAL Id: hal-02990062
https://hal.archives-ouvertes.fr/hal-02990062
Submitted on 19 Nov 2020HAL is a multi-disciplinary open access archive for the deposit and dissemination of sci-entific research documents, whether they are pub-lished or not. The documents may come from teaching and research institutions in France or abroad, or from public or private research centers.
L’archive ouverte pluridisciplinaire HAL, est destinée au dépôt et à la diffusion de documents scientifiques de niveau recherche, publiés ou non, émanant des établissements d’enseignement et de recherche français ou étrangers, des laboratoires publics ou privés.
Molecular-Scale Understanding of the Embrittlement in
Polyethylene Ocean Debris
Christopher Garvey, Marianne Impéror-Clerc, Stéphan Rouzière, Gwénaël
Gouadec, Olivier Boyron, Laura Rowenczyk, Anne-Françoise Mingotaud,
Alexandra ter Halle
To cite this version:
Christopher Garvey, Marianne Impéror-Clerc, Stéphan Rouzière, Gwénaël Gouadec, Olivier Boyron, et al.. Molecular-Scale Understanding of the Embrittlement in Polyethylene Ocean Debris. En-vironmental Science and Technology, American Chemical Society, 2020, 54 (18), pp.11173-11181. �10.1021/acs.est.0c02095�. �hal-02990062�
Molecular scale understanding of the embrittlement
1
in polyethylene ocean debris
2
Christopher J. Garvey1,2,3,4*†, Marianne Impéror-Clerc,1 Stéphan Rouzière,1 Gwenaël Gouadec,5 3
Olivier Boyron,6 Laura Rowenczyk,7 Anne Françoise Mingotaud7 and Alexandra ter Halle7* 4
5
1. Laboratoire de Physique des Solides, UMR 8502, CNRS, Université Paris Saclay, France. 6
2. Lund Institute for Advanced Neutron and X-ray Scattering, Lund, Sweden. 7
3. Biofilm—Research Center for Biointerfaces and Biomedical Science Department, Faculty of 8
Health and Society, Malmö University, Malmö, Sweden 9
4. Australian Nuclear Science and Technology Organisation, Locked Bag 2001, Kirrawee DC, 10
NSW 2232, Australia. 11
5. Sorbonne Université, CNRS, Laboratoire MONARIS, c49, F75252, Paris, France. 12
6. C2P2 - LCPP Group, UMR CNRS 5265, Université de Lyon, ESCPE Lyon, Bat 308F, 43 13
Bd du 11 novembre 1918, 69616 Villeurbanne, France. 14
7. Laboratoire des IMRCP, Université de Toulouse, CNRS UMR 5623, Université Paul 15
Sabatier, 118, route de Narbonne, F-31062 Toulouse Cedex 09, France. 16
17 18
KEYWORDS 19
polymer, plastics, polyethylene, weathering, X-ray scattering, Raman spectroscopy, differential 20
scanning calorimetry, size exclusion chromatography 21
22
ABSTRACT 23
The fate of plastic waste is a pressing issue since it forms a visible and long-lived reminder of 24
the environmental impact of consumer habits. In this study we examine the structural changes in 25
the lamellar arrangements of semi-crystalline polyethylene (PE) packaging waste with an aim to 26
understand the physical mechanisms of embrittlement in PE exposed to the marine environment. 27
PE microplastics and macroplastics from identifiable PE packaging were collected in the Atlantic 28
Ocean and compared to new PE boxes. Several experimental techniques interrogate the effects of 29
environmental exposure on their bulk and surface properties. Size exclusion chromatography 30
determines the molecular weight distribution of the PE polymer chains and differential scanning 31
calorimetry gives the crystallinity. Small and wide angles X-ray scattering examines the packing 32
of PE chains into semi-crystalline lamellae. Longitudinal acoustic mode Raman spectroscopy 33
provides a complementary measurement on the length of PE polymer chains extending through 34
the crystalline lamellar domains. The overall picture at the molecular scale is that although PE 35
becomes more crystalline with environmental exposure, the lamellar order present in new packing 36
boxes, is disrupted by the weathering process. This process has important implications for 37
embrittlement and subsequent degradation. 38
39
TOC Abstract Art 40
41
42 43
44
INTRODUCTION 45
In recently past decades consumer habits have changed the dominant packaging material 46
deposited into the biosphere.1, 2 Polyethylene, and more generally polyolefins, are produced
47
extremely efficiently on an industrial scale and have become the first choice for low cost single 48
use barrier materials. This usage was once dominated by cellulose, had well-defined pathways for 49
the degradation and metabolic utilisation by the biosphere of the glucose monomer; such pathways 50
for polyethylene are limited.3 As a result the environmental load of polyethylene waste steadily
51
increases with little incorporation into the biosphere.1, 2 In this study we consider the
physico-52
chemical transformations of an important thermoplastic, polyethylene, under the influence of 53
prolonged environmental exposure, drifting in the ocean. 54
The conceptual framework for organisation of polyethylene in packaging4, and understanding
55
the subsequent nanostructural changes due to environmental exposure are outlined in Fig. 1. 56
Physically, this structure represents the competition between the energetically favourable 57
crystallisation process and its kinetic limitation by the entanglement of the long extended polymer 58
chains which span the amorphous regions and could enter the a given lamellae more than once.4
59
There is a kinetic arrest of the crystallisation process started from the melt4 and so the degree of
60
crystallisation for packaging materials is a strong function of the processing conditions (thermal 61
history and shear) and initial starting material (molecular weight and chain branching). Previously 62
we have shown that exposure to UV light causes growth of the crystalline lamellae through 63
progressive release of the kinetic constraints via chain scission.5, 6 This physical transformation,
64
increasing crystallinity, has been shown to immediately influence the mechanical stability of the 65
material (embrittlement)6 but also the permeability of the polyethylene to oxygen and subsequent
66
chemical reaction/degradation. 67
Here we combine several experimental approaches that provide complementary perspectives on 68
selected PE samples, going from original PE packaging, to weathered macroplastics (>20 mm) and 69
weathered microplastics (1 to 5 mm - Tables SI-1 and SI-2). The objective is to obtain a deeper 70
understanding of the nano-structural evolution of the PE materials during environmental exposure, 71
especially the evolution of the lamellar organisation. First, differential scanning calorimetry (DSC) 72
and size exclusion chromatography (SEC) provide information on the kinetic arrest process; DSC 73
by providing the crystallinity (with no assumption on the crystallite morphology) and SEC by the 74
indication of the molecular weight distribution of the constituent polymer chains. Wide angle X-75
ray scattering (WAXS) provides, again, an experimental perspective on the crystallinity of the 76
materials, and results are compared to those obtained from DSC. Furthermore, since WAXS is 77
sensitive to the packing of the PE chains inside the crystalline lamellae, it gives a measure of the 78
coherence length along specific crystallographic directions - D110/D200 - of the crystalline
79
arrangement of the PE chains (Fig. 1). 80
81
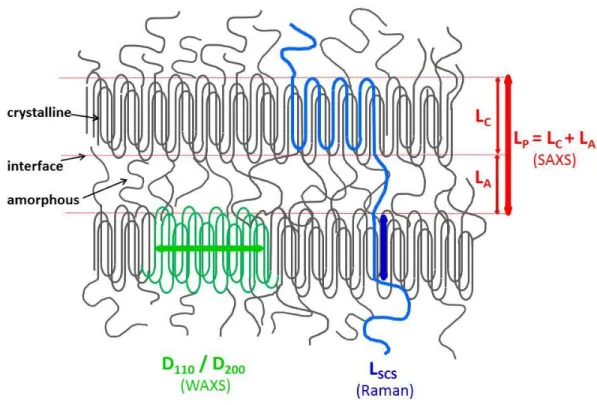
Fig. 1: The semi-crystalline lamellar model for PE. The individual chain highlighted in blue
82
spans both crystalline and amorphous regions and extends over several crystalline lamellae. The 83
long period LP (measured by SAXS) is the distance between adjacent crystalline lamellae; Lp is
84
the sum of the lamella thickness (LC) and the extension of the amorphous sub-region (LA). The
85
crystalline order is characterized by WAXS through the coherence lengths (in green). Inside 86
crystalline lamellae, polymer chains are all parallel to each other. They may also be slightly tilted 87
but for simplicity, the Figure is drawn without a tilt angle. The straight chain segment length 88
LSCS is measured by Raman spectroscopy across the crystalline lamellae. Note that LSCS and LC
89
may be slightly different (see text). 90
91
The nanoscale organisation of PE is probed by combining small angle X-ray scattering (SAXS) 92
and Raman spectroscopy. A peak in the SAXS measurements gives direct evidence of the lamellar 93
semicrystalline organisation4 and the characteristic distances in the lamellar structure (Fig. 1; the
94
long period LP is the sum of a crystalline lamella thickness LC and of the amorphous sub-region
95
extension LA; the linear crystallinity, linC, is defined by the ratio linC = LC/LP). Longitudinal
96
acoustic mode (LAM) Raman measurements are sensitive to LSCS, the length of the straight
polyethylene chain segments inserted through the lamellae (Fig. 1). Values of LC and LSCS are
98
always very close, but not exactly identical, as will be discussed afterwards. For example, a tilt 99
angle (typically 35°, following literature data 7-10) of the polymer chains may be present inside the
100
crystalline lamellae, depending on the way the PE samples were prepared. However, in Figure 1, 101
for simplicity, the semi-crystalline organisation is depicted with no tilt angle. Values of LC and
102
LSCS are compared with the caveat that X-ray scattering probes the bulk organisation of the PE
103
chains in the volume of the transmitted X-ray beam (about 1 mm3), whereas Raman spectroscopy
104
is probing smaller volumes (a few m3) at the surface of the sample.
105 106
MATERIALS AND METHODS 107
SAMPLE COLLECTION 108
Macroplastics and microplastics were collected from the Guyavoile sailing vessel in the 109
accumulation area of the North Atlantic subtropical gyre, in May 2014 and June 2015, during the 110
“7th Continent” French expedition.11 Macroplastics were visible from the boat and floated on the
111
sea surface. Microplastics were collected using a manta net (mesh size 300 µm). Details of how 112
the debris were collected, sorted out and stored are described elsewhere.11 All the sample’s
113
collection details and labelling are given in Tables SI-1 and SI-2. Some samples were not analysed 114
by the full suite of techniques due to limited amount of sample. 115
116
SIZE EXCLUSION CHROMATOGRAPHY AND DIFFERENTIAL SCANNING
117
CALORIMETRY (DSC) 118
High temperature SEC and DSC analyses were used to analyse the molecular weight distribution 119
and crystallinity of PE samples, respectively. The experimental practice and analysis have been 120
discussed elsewhere12 and are detailed in the Supplementary Information (SI).
121 122
X-RAY SCATTERING 123
X-ray scattering involves the measurement of the scattered intensity at a defined angle relative 124
to the incident X-ray beam, . The scattered intensity, I, is expressed as a function of the scattering 125
vector, q, defined by: 126
𝑞 = 4𝜋. 𝑠𝑖𝑛(𝜃 2⁄ )/𝜆 (1)
127
,where is the wavelength of the incident radiation. WAXS and SAXS measurements, which 128
differ in the range of scattering vectors considered, were both performed on a homebuilt instrument 129
(Laboratoire de Physique des Solides, Université Paris-Sud, France) operating with 130
monochromatic copper radiation (CuK = 0.1542 nm) delivered to the sample by a multilayer W/Si
131
optics coupled with a rotating anode generator (Rigaku HU3R, 40kV-40mA). 132
WAXS images were recorded on a sensitive image plate detector MAR345 (marXperts, 133
Hamburg, Germany) with a pixel size of 0.150 mm2, placed at a distance of 100 mm from the
134
sample. Acquisition time for each measurement was 300 s. WAXS 1-D diagrams were obtained 135
by radial integration of the intensity of each image. The analysis and processing of the 1-D WAXS 136
data in terms of coherence length of the D110 and D200 crystallographic planes and fractional
137
crystallinity are detailed in the SI. 138
2D SAXS images were acquired on a two-dimensional Pilatus 200K detector (Dectris, Baden, 139
Switzerland) using a sample to detector distance of 1236 mm. The gaps between detector modules 140
were eliminated by combining 2 images with slight positional offsets. The size of the X-ray beam 141
on the sample was 0.8 x 0.8 mm2. The data was reduced to the radially averaged intensity versus
142
q form, I(q), using the measurement geometry, a pixel size of 0.172 mm2 and a background
143
subtraction of the empty beam in air, scaled by the sample transmission using the NIKA macros13
144
written for IgorPro (Wavemetrics, Oswego, USA). The final q-range was 0.094 < q < 1.64 nm-1.
146
RAMAN SPECTROSCOPY 147
In semi-crystalline polymers, the Straight Chain Segments length 𝐿𝑆𝐶𝑆 can be approximated from
148
the position of Raman first-order Longitudinal Acoustic Mode (LAM) using Mizushima–
149 Simanouti equation14, 15: 150 𝐿𝑆𝐶𝑆 = 1 2𝑐𝜎𝐿𝐴𝑀√𝜌𝐸 (2) 151
In Eq. (2), is the density of the crystallites, E their Young’s modulus and c is the speed of light. 152
In this study we shall use = 972 kg.m-3 (the experimental density of PE single crystals16) and E
153
= 305 GPa (Young’s modulus in the direction of “all-trans” PE chains in interaction). 17-20 Eq. (2)
154
pairs one unique 𝜎𝐿 wavenumber with each 𝐿𝑆𝐶𝑆 value and the experimental spectrum 𝐼𝐿𝐴𝑀(𝜎𝐿) is 155
classically converted into a Lamellar Thickness Distribution (LTD) using Eq. (3) 21 (see details in
156
the SI) where the (1 − 𝑒− ℎ𝑐𝑘𝑇𝜎𝐿) term is the thermal population factor from Maxwell-Boltzmann 157 statistics: 158 𝑁(𝐿𝑆𝐶𝑆) ∝ 𝐼𝐿𝐴𝑀(𝜎𝐿) × (1 − 𝑒 −ℎ𝑐 𝑘𝑇𝜎𝐿) × 𝜎𝐿2 (3) 159
Samuel and Hamagushi22 recently introduced a correction factor in Eq. (3) but discarding it 160
makes no difference for our samples, as discussed in the SI. 161
All spectra were recorded in backscattering mode using the 514.5 nm line of an Innova 90C-162
6UV Ar+ ion laser (Coherent) and a LabRam HR 800 Raman spectrometer equipped with an Ultra
163
Low Frequency (ULF) module for Rayleigh scattering filtration (Horiba Jobin Yvon). A minimum 164
of five spectra were recorded for each sample. Depending on the signal to noise ratio, either the 165
most intense one or the average one was fitted, after correction of the ULF-induced distortion 166
through a procedure described in the SI. Further details on the experimental setup, the probed 167
volume, fluorescence quenching and peak fitting procedures may also be found in the SI. 168
169
STATISTICAL ANALYSIS 170
Statistical tests were performed on the full set of data. A Fisher test was first performed to compare 171
the variances of the samples before applying a Student’s t-test if appropriate. Owing to the low 172
number of macro samples, Fisher’s test failed in some cases. Mann Whitney tests were then 173
performed considering non-parametric data. The corresponding indications are reported in the 174
Figures. 175
176
RESULTS AND DISCUSSION 177
The focus is the nanostructural evolution of PE, crystallization, in several types of original 178
packaging and weathered samples. Firstly, we assess the differences between commercial 179
packaging samples (Nesquik and Folgers boxes, code names Ne and Fo) and the corresponding 180
weathered macroplastics (w-Ne and w-Fo). Secondly, these macroplastics are compared to several 181
microplastics of unknown origin. Because of the much smaller physical dimensions of the latter 182
(see Table SI 1), it is assumed that they have been weathered for a longer time, and have therefore 183
reached a more advanced oxidation state.12 However, because the history of the samples (before
184
they were collected) and the starting material are not well defined, the conditions of formation of 185
the debris are largely unknown. Secondly, owing to the small number of microplastics presented 186
here (10), statistical tests were systematically performed to compare with original packaging and 187
the paired macro-plastics. 188
SIZE EXCLUSION CHROMATOGRAPHY 190
SEC was performed to determine the molecular weight distribution of the polymer chains. 191
Typical SEC profiles are shown in Figure SI 1. The cumulative weight fractions obtained from the 192
analysis are shown in Fig. 2. The analysis is elaborated in Table SI 3. Samples D19 and C8 did not 193
have sufficient material for the analysis. 194
195
196
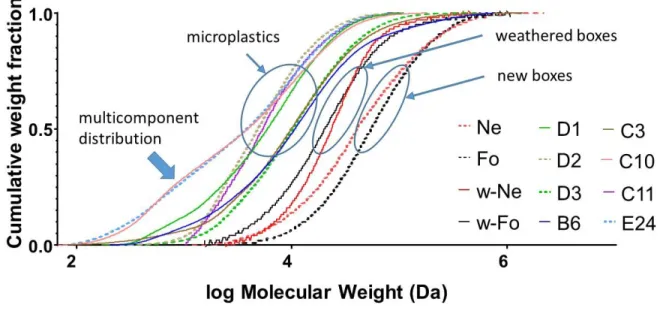
Fig. 2: Cumulative weight fraction showing the mass distribution of the polymer chains in the
197
different samples. 198
199
The cumulative mass distributions shown in Fig. 2 indicate a strong decrease in molecular weight 200
when the weathered boxes (w-Ne, w-Fo) are compared to the original ones (Ne, Fo). The micro-201
plastics present even lower molecular weights and their distribution tends to become multi-202
component, as can be seen from the tails in Fig. 2. 203
Table SI 3 summarizes the initial interpretation of the SE molecular weight distributions in terms 204
g.mol-1) for all microplastics and their size distribution is better described by a multimodal
206
distribution, with average molecular weights Mn1, Mn2 and corresponding average degrees of
207
polymerisation, N1, N2. Microplastics E24, C11 and C10 have a mean Mn value close to 1000
208
g.mol-1, indicating that they have, on average, smaller polymer chains than D1, D2, B6, C3 and
209
D3 microplastics. Macro or new materials have a significantly higher Mn value and longer polymer 210
chain lengths than the micro debris. The polydispersity index (PDI) is in general much larger for 211
microplastics. The statistical significance of these observations is shown in Fig. SI 2. 212
213
In conclusion, SEC shows a strong decrease of the polymer chain length between the original 214
packaging and the macroplastics. Interestingly, the size distributions of the microplastics are 215
usually multimodal. A spatially homogeneous scission would result in only a broadening of the 216
initial distribution. Here a spatially heterogeneous scission is most likely taking place. It could be 217
attributed to a preferred degradation at the surface (compared to the bulk) or related to selective 218
degradation in the semi-crystalline morphology (coexistence of crystalline and amorphous parts, 219
see Fig. 1) or a combination of both mechanisms. 220
221 222
DIFFERENTIAL SCANNING CALORIMETRY 223
DSC brings insights on: i) the kinetic arrest of PE crystallisation; and ii) the aging processes that 224
altered the polymer organization (through the enthalpy of first fusion). Samples C8, D19 and E24 225
were too small to be characterized. 226
Fig. SI 3 shows typical DSC traces and the results of the statistical analysis are given in Table 227
SI 4. The new boxes and macroplastics do not exhibit measureable differences whereas all 228
microplastics have significantly higher crystallinity values (70 %, on average, compared to 50 229
% for macroplastics). 230
The melting can either be characterized by the peak position or at the beginning of the transition, 231
i.e. the onset value (Table SI 4). No significant difference in the melting peak position was
232
observed (Fig. SI 3). The onset temperatures were significantly lower for macro- compared to 233
microplastics. The melting of the D1, B6 and C10 microplastics starts around 123-124°C. For the 234
other microplastics, the fusion starts at higher temperatures: around 128°C for D2, C11 and C3; 235
around 130°C for D3. 236
By comparing the SEC (Table SI 3) and DSC (Table SI 4) characterizations, it appears that the 237
samples which are melting at lower temperatures (B6 and C10) exhibited the highest PDI. This is 238
relevant with shortened chains being able to melt earlier. Moreover, the samples with the lower 239
crystallinity exhibit a lower onset temperature of melting (macro versus micro samples). Owing to 240
the very narrow distribution of the melting temperature between the microplastics (Fig SI 3), it is 241
however impossible to compare SEC and DSC results more precisely. This is not surprising since 242
physical properties are known to be poorly sensitive to molecular weight in these long chain 243
polymers, contrary to small molecules and oligomers.4
244 245
WAXS 246
The radially averaged WAXS profile of Nesquik commercial packaging is shown In Fig. 3, along 247
with the original 2D pattern (in the inset). Similar data are available for the other samples in Fig. 248
SI 4. The WAXS patterns typically consist of many sharp and radially symmetric Debye-Scherrer 249
rings and a single broad peak which is characteristic of the poorly defined interatomic distances of 250
an amorphous solid.23 The radial isotropy shows the lack of orientation expected from PE (powder
251
pattern), along with a very limited number of spotty diffraction rings from filler or pigment 252 material. 253 10 12 14 16 18 inte nsity (a .u. ) q (nm-1) 110 200 amorphous 254
Fig. 3: Typical radially averaged WAXS data (red crosses) from Nesquik packaging material.
255
Inset shows the corresponding 2D pattern. The black solid line shows the fit with three Gaussians 256
described in the SI. Each lattice plane is shown in red on the cartoon next to the corresponding 257
Bragg peak. 258
259
Using the crystal structure from Bruno et al.,24 our analysis has focussed on the 10 < q < 18 nm
-260
1 q-range containing the 110 and 200 reflexions and the broad amorphous halo. There are
261
numerous other peaks due to other less intense X-ray reflexions from PE and from the many 262
additives (e.g. colouring and fillers) which are found in commercial PE packaging.25 The important
263
fitted parameters are summarised in Table SI-5. From the FWHMs of the Bragg peaks (see Eqn’s 264
SI 3 and SI 4) we obtain the average coherence lengths D110 and D200 (see Fig. 1). The results of
265
the analysis are given in Table 1. Crystallinities determined by WAXS and DSC are different but 266
agree qualitatively (Figure SI-5). It is important to note that WAXS crystallinity is very sensitive 267
to the data fitting procedure, and to the way the contributions of Bragg peaks are separated from 268
the contribution of the amorphous peak.26 This may explain that for all microplastics the values of
269
the crystallinity derived from WAXS are overestimated compared to DSC. 270
The two average coherence lengths inside crystallite lamellae (D110 and D200 - Fig. 1) are
271
significantly smaller for the microplastics than for the macroplastics (Table 1). For example, the 272
value of D110 decreases in average value from 34 to 23 nm between macro and microplastics. The
273
coherence length is defined as the extension of crystalline order normal to the specified 274
crystallographic direction. We find that the in-plane crystalline order extends over a few tens of 275
nanometres and decreases with weathering. Note here that the overall lateral size of the crystalline 276
lamellae is expected to be much larger than the coherence length, typically of a few microns.4 The
277
in-plane order of the lamellae can be visualized as a collection of nano-sized crystalline domains. 278
In conclusion, a higher crystallinity of these samples is associated to a smaller coherence length in 279
the in-plane direction of the lamellae. 280
281
SAXS 282
In the semi-crystalline polymer model (Fig. 1) PE is organised in alternating lamellae of 283
crystalline and amorphous polyethylene (PE) with electron densities, c and a , and thicknesses 284
Lc and La, respectively. Because of this contrast in electron density, it is possible with SAXS to 285
measure the inter-lamellar spacing, called the long period LP, with LP = Lc + La. Fig. 4 shows the 286
variation in 2D scattering patterns and the corresponding 1D SAXS profiles for different samples: 287
Commercial Nesquik packaging (Ne), the corresponding weathered sample (w-Ne) and two 288
microplastics (D19 and D1). All other SAXS patterns are given in Figure SI 6. As with WAXS, 289
all the SAXS patterns are isotropic, and there is no preferential orientation of the lamellar structure. 290
We will thus restrict the following discussion to the radially averaged 1D data. 291
292
Nesquik weathered Nesquik
293 0.1 1 100 1000 10000 0.20.40.60.81.01.21.41.6 50 100 150 200 I.q 2 q (nm-1) intens ity ( au.) q (nm-1) 0.1 1 100 1000 10000 0.20.40.60.81.01.21.41.6 100 150 200 250 300 350 I.q 2 q (nm-1) intens ity ( au.) q (nm-1) 294 295 D1 D19 296 0.1 1 100 1000 10000 0.20.40.60.81.01.21.41.6 50 100 150 200 250 300 I.q 2 q (nm-1) intens ity ( au.) q (nm-1) 0.1 1 100 0.20.40.60.81.01.21.41.6 0 50 100 I.q 2 q (nm-1) intens ity ( au.) q (nm-1) 297
Fig. 4: Typical SAXS 1D profiles, with the corresponding 2D images (top right hand side insets)
298
and Lorentz transformed data (bottom left hand side insets). 299
300
The intensity of the broad lamellar peak exhibits strong variations depending on the sample (Fig. 301
The weathered macro debris (w-Ne and w-Fo) have a slightly less obvious feature. The 303
microplastics exhibit either a very weak lamellar peak (D13 and C11), or no peak at all (C3, C10 304
and E24). Importantly, despite not exhibiting ordered lamellae, these samples do not exhibit any 305
strongly different DSC crystallinities compared to the other samples in the same group: packaging; 306
macroplastics; and microplastics. An exception is E24, the only sample that has no lamellar peak 307
and a low crystallinity, comparable to that of the macroplastics. 308
The position of the peak in reciprocal space, qmax, may be converted to the real space lamellar
309 spacing: 310 𝐿𝑃 = 2𝜋 𝑞𝑚𝑎𝑥 (4) 311
The very broad SAXS peak is superimposed upon a sloping background. A convenient way of 312
visualising the position of qmax is the Lorentz plot27 - q2.I(q) (shown for the four spectra of Figure
313 4). 314
In order to estimate the linear crystallinity (linC=Lc/(La+Lc)) from those samples exhibiting a
315
clear lamellar diffraction feature, we applied a cosine transform to the Lorentz transformed data. 316
We thus obtained the linear correlation function (1(x)), which maximum corresponds to Lc.6:
317 𝛾1(𝑥) = ∫ 𝐼(𝑞)𝑞0∞ 2cos(𝑞𝑥)𝑑𝑞 ∫∞𝐼(𝑞)𝑞2 0 𝑑𝑞 (5) 318
The values obtained from the Lorentz plot and the subsequently cosine transformed data were 319
consistent but the transform method was not suitable for those samples which exhibited very weak 320
features. The SAXS plot for sample C8 was truncated by the limited solid angle of the 2D SAXS 321
detector and it was difficult to extrapolate the high-q behaviour. The distributions of the LP for
322
samples that exhibit diffraction feature and/or were amenable to transformation to (x) are shown
323
in Fig. SI 7 and reported in Table 1. The value of LP is rather constant for all samples, with LP
close to 20 nm. According to Mann-Whitney test, no significant difference between the macro- 325
and microplastics is observed. 326
The values of linC are higher than the values obtained from DSC and WAXS measurements 327
(Fig. SI 5), with linC values close to 80% instead of 50% for the macroplastics. This difference if 328
generally rationalised by considering that the value obtained for linC is not sensitive to the 329
amorphous material outside the semicrystalline lamellae.4WAXS analysis does not rely on the
330
assumption of a lamellar structure whereas SAXS analysis does and some samples could consist 331
of bulk amorphous regions outside lamellae. In Table 1, last column, by proportional subtraction 332
of values of linC from the overall crystallinity (determined by DSC), we estimate the amount of 333
lamellar regions inside the material, in coexistence with extra amorphous regions. 334
In conclusion, unlike previous studies on PE samples with a well-defined environmental history,6
335
we do not observe change or growth of LP. Moreover, for microplastics, the long period peak in
336
SAXS is not present or has a very weak intensity. A clear trend to the disruption of the lamellar 337
order in the microplastics is observed. 338
339
RAMAN SPECTROSCOPY 340
Fig. 5a presents the low frequency Raman spectra collected from the samples and Fig. 5b gives 341
the normalised linear thickness distributions (LTD) calculated from the mathematically adjusted 342
LAM mode (Eqn.’s 2 and 3). Note that the fitted LAM position did not systematically match the 343
apparent one in the raw spectrum. This points the importance of a spectral treatment to correct for 344
the filtering-induced distortion, for superimposing contributions (mostly Rayleigh diffusion wing) 345
and for the difficulty to set Raman shift origin precisely on the laser wavenumber with a pixel 346
width 0.5 cm-1 (see discussion in SI).
All the fitted LAM positions and corresponding L values (LSCS-avg) are given in Table SI 6, as
348
well as the most probable L value (LSCS-mp) and the FWHM retrieved from each LTD (see SI). As
349
a consequence of the distribution asymmetry, the most probable LSCS is systematically about 2 nm
350
below the average value. 351
352
Fig. 5: (a) Low frequency Raman spectra corrected for the Rayleigh filtering stage (see SI); two
353
spectra are given when distinct populations were observed depending on the point of analysis; 354
In/Out labels specify which packaging wall was analysed; spectra from samples Fo, D2, C10 and 355
E24 were truncated for clarity (b) LSCS number distribution obtained from the fitted LAM profile 356
(see Eqns 2 and 3 and SI). 357
358
The SCSs may be at an angle with the normal to PE lamellae but the average tilt is
359
usually low enough (~35°)23-26 to still consider LSCS a good estimate for the lamellar
360
thickness. As a matter of fact, the excellent agreement observed between the LSCS-mp
values obtained from low frequency Raman spectroscopy and LC values derived from
362
SAXS (Table 1), while not specifically investigated here, is suggestive of a relatively
363
low tilt angle in our samples.
364
The SCSs may be at an angle with the normal to PE lamellae but the average tilt is low enough 365
(~35°)7-10 to consider L
SCS a good estimate for the lamellar thickness. There is a small but
366
systematic difference between the LSCS-mp values obtained from low frequency Raman
367
spectroscopy and LC values derived from SAXS (Table 1), while not specifically investigated here,
368
is suggestive of a relatively low tilt angle. Yet, SAXS results are averaged over the entire thickness 369
of the samples whereas the penetration depth of Raman spectroscopy (a few micrometers below 370
the surface, see SI) makes it possible to evidence structural differences between the inner and outer 371
walls of the Folgers and Nesquik samples, without the need for sample sectioning. Besides, the 372
Raman method is able to give a clear indication of the crystalline lamellar thickness when this is 373
not possible for SAXS measurements, i.e. there is no SAXS diffraction feature. 374
The LTD is systematically increased by about 4 nm in the inner wall compared with the outer 375
one (Tables 1 and SI 6). This is the first time, to our knowledge, that an inside vs. outside difference 376
has been characterized in the literature on commercial PE packaging. This difference most 377
probably results from a temperature gradient during the blow-moulding process. For those 378
microplastics that reveal a two-mode distribution (D3, B6 and C11 samples) we might infer they 379
corresponded to the inner and outer walls of the original packaging. 380
The direct comparison between a pristine and weathered sample of either Nesquik or Folgers 381
packaging would obviously be questionable since they may not come from the same manufacturer 382
or batch (see Fig 5(a) the 40 cm-1 contribution that is detected in w-Ne but not observed in Ne
383
sample). Yet, the general impression given by Fig. 5b and the Raman derived parameters from 384
Table SI 6 is that most LSCS-mp values stand in the 15-20 nm range and that no systematic
385
evolution of the LTD can be evidenced going from the pristine PE samples to weathered 386
macroplastics and, ultimately, microplastics. The two outlier distributions are also the less reliable 387
ones: C8 sample had very diffuse Raman scattering and the lowest peaks from D3 sample were at 388
the 10 cm-1 detection limit (Fig. SI 8a).
389 390 391 392 393 394
Table 1. Summary of the experimental results: (i) SEC-derived average number of monomer units
395
per chain for monomodal (N) or bimodal (N1 and N2) size distributions (see Table SI 3 for details);
396
(ii) DSC- and WAXS-derived crystallinity; (iii) WAXS-derived D110 and D200 coherence lengths;
397
(iv) SAXS-derived values of the long period (LP), the linear crystallinity (linC) and LC = Lp*linC;
398
(v) Raman-derived most probable LSCS value; (vi) Estimation of the amount of lamellar phase (lam
399
phase, %) in coexistence with extra amorphous regions; #: sample not analysed; *: irrelevant data. 400
Sample N (N1, N2) SEC Cryst. (%) DSC Cryst. (%) WAXS D110 (nm) WAXS D200 (nm) WAXS LP (nm) SAXS LinC (%) SAXS LC (nm) SAXS LSCS-mp (nm) Raman Lam phase (%) Probed vol. 1 mg mm3 mm3 mm3 mm3 mm3 mm3 mm3 m3 Ne 721 53 53 33.8 28.4 20.2 78 15.8 15.4 – 18.5 (outer - inner) 68 Fo 1046 45 49 34.7 29.7 20.5 76 15.6 13.9 – 17.8 (outer - inner) 62 w-Ne 546 51 49 34.7 26.5 20.0 82 16.4 15.8 – 17.5 (outer – inner) 61 w-Fo 386 50 58 24.0 19.5 19.5 79 15.4 14.4 – 17.2 (outer – inner) 68 D1 82 64 74 23.1 20.8 no peak * * 18.2 * D2 111 (418/68) 72 76 23.6 20.8 19.8 * * 16.0 * D3 186 (386/61) 69 77 23.1 21.1 23 * * 19.1 – 24.2 (2 populations) * D19 # * 72 22.7 20.8 18.2 89 16.2 # 81 B6 125 (179/9) 64 75 22.7 20.5 19.5 84 16.4 16.0 – 18.4 (2 populations) 83 C3 139 (357/27) 71 77 34.7 32.0 no peak * * 19.9 * C8 # * 74 23.1 20.8 8.3 76 6.3 9.7 97 C10 39 (189/14) 60 73 22.3 20.5 no peak * * 16.5 * C11 36 72 77 23.6 21.1 18.5 * * 15.5 – 18.4 (2 populations) * E24 34 (193/12) # 52 23.6 19.2 no peak * * 15.0 *
To date most studies on the degradation of polyethylene have focussed on the chemical changes as a result of various interactions with light, the atmosphere and mechanical processes.28 The
dominant chemical reactions during degradation are polymer chain scission and/or oxidation. While ultimately degradation must be considered as a chemical process, physical changes in the solid state packing of polymer molecules have long been acknowledged as important determinant in the ability of many polymers to resist chemical and environmental degradation.29 Furthermore,
the scission of polymer chains by photodegradation has the effect of allowing polymer chains in kinetic arrest to adopt the lowest energy configuration and to crystallise further6, which implies a
clear link between chemical and physical changes.
A first objective of this work was to compare macroplastics (w-Ne and w-Fo samples) with their corresponding new packaging (Ne and Fo samples). What we observe is that although both samples undergo a reduction in molecular weight of PE, the sample with the greatest reduction in molecular weight (Fo to w-Fo) is the one that shows the greatest changes in nanostructure. Increase in crystallinity and decrease in the coherence length inside the crystalline lamellae are the two changes observed in this macroplastic. This trend is amplified for most microplastics. Importantly, all microplastics have much smaller molecular weight. As already known, scission of the polymer chains is the main chemical evolution that is taking place. We assert that this process underpins all the physical changes in the material. While macroplastics have crystallinities around 50 %, crystallinity in the microplastics is around 70 %, on average. This can be understood by the release of kinetic arrest to crystallization when polymer chains become shorter.
At the same time, Raman and SAXS do not evidence any systematic increase of the thickness of the crystalline lamellae, Lc and LSCS always being close to 16 nm. This is quite surprising, as one
with crystallisation occurring specifically at the crystalline/amorphous interface between lamellae, as was observed for PE systems exposed to specific doses of UV light.6 In addition, the lamellar
order is disappearing in most of the microplastics, as the peak related to the long period LP is very
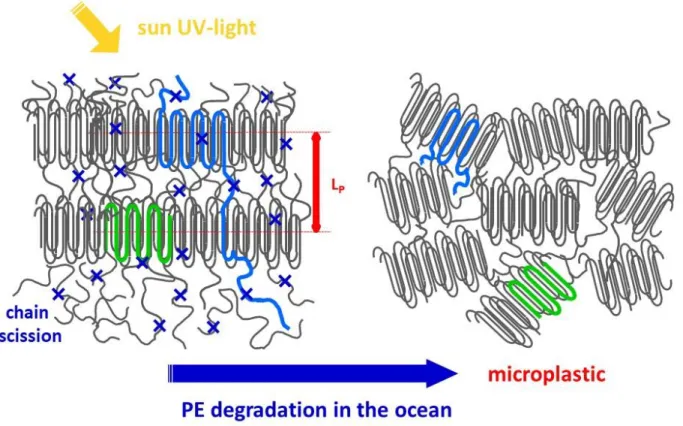
weak or absent. Figure 6 is a cartoon summarising the evolution in the nanoscale structure: increase of the crystallinity and disruption of the lamellar order are taking place simultaneously.
Lastly, it will be important for future studies to take into account the structural heterogeneities of the original samples. It is well evidenced in Raman spectroscopy, with differences in the crystalline lamellar thickness LSCS between the inside and outside surfaces of the packaging boxes.
To date the effect of lamellar thickness on the crack resistance of PE has been investigated indirectly but would seem to be important.30 There is also an open question regarding the
heterogeneous scission of the PE chains evidenced by SEC measurements, most clearly in the microplastics. The resulting bimodal molecular weight distributions could be attributed to a preferred degradation at the surface (compared to the bulk) or related to selective scission inside crystalline versus amorphous PE.
Figure 6. Summary of the observed evolution of semi-crystalline PE submitted to environmental
conditions. Chain scission (indicated by blue crosses) induces a strong decrease of the average chain length (blue chains) and two main structural changes: increase in crystallinity and disruption of the lamellar order. In addition, no significant change in the thickness of the lamellae is observed and coherence lengths are slightly smaller (green crystalline domains). On the bottom part of the macroplastics scheme, possible coexistence of lamellar regions with extra amorphous regions is not depicted.
While the structural conclusions of this work are clear for each of the samples we have examined here, to directly relate these changes to the long-term effects of physical aging in the marine environment, is more difficult. In the case where the linage of aged samples can be clearly established, macro samples and commercial packaging, we observe clear changes in the polymerisation degree of PE. Chain scission can been induced by exposure to high-energy radiation or photochemical degradation, and similar changes in crystallinity and subsequent embrittlement were observed.31-33 In the case of exposure to high energy radiation there is
substantial time lag (years) between the initial exposure/chain scission event and the full realisation of the structural changes.33 Studies on degradation in model aquatic and marine systems have
concluded that the effects of chemical degradation (oxidation) are causing both chain depolymerisation34 and mass loss35, which are associated with embrittlement of the bulk material
on a shorter time scale. Though in the latter study35 there was no explicit examination of the
changes in molecular weight. Thus, radiation-induced chain scission and chemical degradation are both likely to occur in the marine environment, but on rather different timescales and with quite different impacts on the bulk and surface degradation of PE particles.
The important structural conclusion of this study is the loss of ordered semi-crystalline lamellar structure in aged microplastics. The arrangements of the lamellae provide a barrier to the diffusion of gases into the bulk polymer.36 Assuming the crystalline regions present a barrier to diffusion of
oxidants (most importantly oxygen) into PE the loss of the lamellar structure shown in Fig. 6 would allow freer chemical degradation with time. We therefore suggest that this important physical change in the arrangement of PE may enhance further chemical degradation of PE.
ASSOCIATED CONTENT
Supporting Information.
AUTHOR INFORMATION
Corresponding Authors
*Christopher J. Garvey: Lund Institute for Advanced Neutron and X-ray Scattering, Lund, Sweden; and Biofilm—Research Center for Biointerfaces and Biomedical Science Department, Faculty of Health and Society, Malmö University, Malmö, Sweden. Email:
Alexandra ter Halle: Laboratoire des IMRCP, Université de Toulouse, CNRS UMR 5623, Université Paul Sabatier, 118, route de Narbonne, F-31062 Toulouse Cedex 09, France. Email :
[email protected] Present Addresses
†
1. Lund Institute for Advanced Neutron and X-ray Scattering, Lund, Sweden 2. Department of Biomedical Science, Malmö University, Malmö, Sweden
Author Contributions
The manuscript was written through contributions of all authors. All authors have given approval to the final version of the manuscript.
ACKNOWLEDGMENT
C.G. acknowledges the CNRS and Université Paris-Sud for financial support during his sabbaticals.
This project is supported by the Total Corporate Foundation and The French National Research Program for Environmental and Occupational Health of Anses (EST/2017/1/219).
ABBREVIATIONS
DSC, differential scanning calorimetry; FWHM, Full Width at Half Maximum; LAM, Longitudinal acoustic mode (Raman spectroscopy); linC, linear crystallinity; LTD, Lamellar Thickness Distribution; PDI, polydispersity index; PE, polyethylene; SAXS, small angle X-ray scattering; SEC, Size exclusion chromatography; WAXS, wide angle X-ray scattering.
REFERENCES
1. Geyer, R.; Jambeck, J. R.; Law, K. L., Production, use, and fate of all plastics ever made.
Science Advances 2017, 3 (7).
2. Jambeck, J. R.; Geyer, R.; Wilcox, C.; Siegler, T. R.; Perryman, M.; Andrady, A.; Narayan, R.; Law, K. L., Plastic waste inputs from land into the ocean. Science 2015, 347 (6223), 768-771.
3. Lucas, N.; Bienaime, C.; Belloy, C.; Queneudec, M.; Silvestre, F.; Nava-Saucedo, J. E., Polymer biodegradation: Mechanisms and estimation techniques. Chemosphere 2008, 73 (4), 429-442.
4. Strobl, G. R., The Physics of Polymers: Concepts for Understanding Their Structures and
Behavior. Springer: 2007.
5. Hsu, Y. C.; Truss, R. W.; Laycock, B.; Weir, M. P.; Nicholson, T. M.; Garvey, C. J.; Halley, P. J., The effect of comonomer concentration and distribution on the photo-oxidative degradation of linear low density polyethylene films. Polymer 2017, 119, 66-75.
6. Hsu, Y. C.; Weir, M. P.; Truss, R. W.; Garvey, C. J.; Nicholson, T. M.; Halley, P. J., A fundamental study on photo-oxidative degradation of linear low density polyethylene films at embrittlement. Polymer 2012, 53 (12), 2385-2393.
7. Bassett, D. C.; Hodge, A. M.; Olley, R. H.; Keller, A., On the morphology of melt-crystallized polyethylene - II. Lamellae and their crystallization conditions. 1981, 377 (1768), 39-60.
8. Voigt-Martin, I. G.; Mandelkern, L., A quantitative electron microscopic study of the crystallite structure of molecular weight fractions of linear polyethylene. Journal of Polymer
9. de Silva, D. S. M.; Zeng, X.-b.; Ungar, G.; Spells, S. J., On Perpendicular and Tilted Chains in Lamellar Crystals. Journal of Macromolecular Science, Part B 2003, 42 (3-4), 915-927.
10. Fritzsching, K. J.; Mao, K.; Schmidt-Rohr, K., Avoidance of Density Anomalies as a Structural Principle for Semicrystalline Polymers: The Importance of Chain Ends and Chain Tilt.
Macromolecules 2017, 50 (4), 1521-1540.
11. ter Halle, A.; Ladirat, L.; Gendre, X.; Goudouneche, D.; Pusineri, C.; Routaboul, C.; Tenailleau, C.; Duployer, B.; Perez, E., Understanding the Fragmentation Pattern of Marine Plastic Debris. Environmental Science & Technology 2016, 50 (11), 5668-5675.
12. ter Halle, A.; Ladirat, L.; Martignac, M.; Mingotaud, A. F.; Boyron, O.; Perez, E., To what extent are microplastics from the open ocean weathered? Environmental Pollution 2017,
227, 167-174.
13. Ilavsky, J., Nika: software for two-dimensional data reduction. J. Appl. Crystallogr.
2012, 45 (2), 324-328.
14. Mizushima, S.-i.; Simanouti, T., Raman Frequencies of n-Paraffin Molecules. Journal of
the American Chemical Society 1949, 71 (4), 1320-1324.
15. Snyder, R. G.; Krause, S. J.; Scherer, J. R., Determination of the distribution of straight-chain segment lengths in crystalline polyethylene from the Raman LAM-1 band. Journal of
Polymer Science: Polymer Physics Edition 1978, 16 (9), 1593-1609.
16. Blackadder, D. A.; Lewell, P. A., The density of polyethylene single crystals. Polymer
1968, 9, 249-263.
17. Palmö, K.; Krimm, S., Chain elastic modulus of polyethylene: A spectroscopically determined force field (SDFF) study. Journal of Polymer Science Part B: Polymer Physics 1996,
34 (1), 37-45.
18. Wassermann, T. N.; Thelemann, J.; Zielke, P.; Suhm, M. A., The stiffness of a fully stretched polyethylene chain: A Raman jet spectroscopy extrapolation. 2009, 131 (16), 161108. 19. Snyder, R. G.; Strauss, H. L.; Alamo, R.; Mandelkern, L., Chain-Length Dependence of Interlayer Interaction In Crystalline N-Alkanes From Raman Longitudinal Acoustic Mode Measurements. Journal of Chemical Physics 1994, 100 (8), 5422-5431.
20. Lüttschwager, N. O. B.; Suhm, M. A., Stretching and folding of 2-nanometer hydrocarbon rods. Soft Matter 2014, 10 (27), 4885-4901.
21. Snyder, R. G.; Scherer, J. R., Interpretation of longitudinal-acoustical-mode spectra of polymers. Journal of Polymer Science: Polymer Physics Edition 1980, 18 (3), 421-428. 22. Samuel, A. Z.; Hamaguchi, H.-o., A General Approach for Estimating
Lamella-Thickness Distribution in Polymers with Low-Frequency Raman Spectroscopy: Application to Lamella Formation in Crystallizing Polyethylene. 2018, 24 (37), 9333-9339.
23. Guinier, A., X-ray diffraction: in crystals, imperfect crystals, and amorphous bodies. Dover publications: 1994.
24. Bruno, J. A. O.; Allan, N. L.; Barron, T. H. K.; Turner, A. D., Thermal expansion of polymers: Mechanisms in orthorhombic polyethylene. Phys. Rev. B 1998, 58 (13), 8416-8427. 25. Tolinski, M., Additives for Polyolefins: Getting the Most out of Polypropylene,
Polyethylene and TPO. Elsevier Science: 2015.
26. Klug, H. P. A., X-Ray Diffraction Procedures - For Polycrystalline and Amorphous
27. Cser, F., About the Lorentz correction used in the interpretation of small angle X-ray scattering data of semicrystalline polymers. Journal of Applied Polymer Science 2001, 80 (12), 2300-2308.
28. Singh, B.; Sharma, N., Mechanistic implications of plastic degradation. Polymer
Degradation and Stability 2008, 93 (3), 561-584.
29. Krässig, H. A., Cellulose: Structure, Accessibility, and Reactivity. CRC Press Inc: 1993. 30. Fodor, J. S.; Lamborn, M. J.; DesLauriers, P. J., Correlating polyethylene microstructure to stress cracking: Development of primary structure parameters. Polymer 2018, 147, 8-19. 31. Fayolle, B.; Colin, X.; Audouin, L.; Verdu, J., Mechanism of degradation induced embrittlement in polyethylene. Polymer Degradation and Stability 2007, 92 (2), 231-238. 32. Fayolle, B.; Richaud, E.; Colin, X.; Verdu, J., Review: degradation-induced embrittlement in semi-crystalline polymers having their amorphous phase in rubbery state.
Journal of Materials Science 2008, 43 (22), 6999-7012.
33. Bhateja, S. K., Radiation-induced crystallinity changes in linear polyethylene: Influence of aging. Journal of Applied Polymer Science 1983, 28 (2), 861-872.
34. Colin, X.; Audouin, L.; Verdu, J.; Rozental-Evesque, M.; Rabaud, B.; Martin, F.; Bourgine, F., Aging of Polyethylene Pipes Transporting Drinking Water Disinfected by Chlorine Dioxide. I. Chemical Aspects. Polym Eng Sci 2009, 49 (7), 1429-1437.
35. Da Costa, J. P.; Nunes, A. R.; Santos, P. S. M.; Girao, A. V.; Duarte, A. C.; Rocha-Santos, T., Degradation of polyethylene microplastics in seawater: Insights into the
environmental degradation of polymers. J. Environ. Sci. Health Part A-Toxic/Hazard. Subst.
Environ. Eng. 2018, 53 (9), 866-875.
36. Eby, R. K., Diffusion in polymer with lamellar morphology polyethylene. Journal of