HAL Id: hal-00497734
https://hal.archives-ouvertes.fr/hal-00497734
Submitted on 3 Feb 2021
HAL is a multi-disciplinary open access
archive for the deposit and dissemination of
sci-entific research documents, whether they are
pub-lished or not. The documents may come from
teaching and research institutions in France or
abroad, or from public or private research centers.
L’archive ouverte pluridisciplinaire HAL, est
destinée au dépôt et à la diffusion de documents
scientifiques de niveau recherche, publiés ou non,
émanant des établissements d’enseignement et de
recherche français ou étrangers, des laboratoires
publics ou privés.
Modelling Local Seismograms of French Nuclear Tests
In Taourirt Tan Afella Massif, Hoggar, Algeria
Stéphane Gaffet, B. Massinon, J.-L. Plantet, Y. Cansi
To cite this version:
Stéphane Gaffet, B. Massinon, J.-L. Plantet, Y. Cansi. Modelling Local Seismograms of French
Nuclear Tests In Taourirt Tan Afella Massif, Hoggar, Algeria. Geophysical Journal International,
Oxford University Press (OUP), 1994, 199 (3), pp.964 - 974. �10.1111/j.1365-246X.1994.tb04028.x�.
�hal-00497734�
Geophys. J . Int. (1994) 119,964-974
Modelling local seismograms of French nuclear tests in Taourirt tan
Afella massif, Hoggar, Algeria
S.
Gaffet,'
B.
Massinon:
J.-L.
Plantet2 and
Y.
Cansi2
'
Institut de GCodynamique, 250 rue Albert Einstein, Sophia-Antipolis 1, 06560 Valbonne, FranceLaboratoire de DPtection et de GPophysique, B P 12, 91680 Bruye'res-le Chritel, France
Accepted 1994 June 10. Received 1994 June 10; in original form 1993 October 18
S U M M A R Y
The influence of topography on the shape and amplitude of seismograms recorded at short distances
is
investigated for a set of nuclear explosions detonated in the Taourirt tan Afella mountain, Hoggar, Algeria, which was the French nuclear test site during the 1960s. The wavefield observed on one side of the mountain compared to that on the other shows a large-amplitude phase generated by reflection of the direct field inside the mountain. This phase is back-diffracted and can be seen in one azimuth and not in the opposite. The existenceof
such a phase depends on the source location inside the mountain. The amplitudes of standard phases are also modified with a factorof
2.5 by the topography between observations made in one azimuth compared to the others.Key
words: nuclear explosion, numerical modelling, site effect.1 I N T R O D U C T I O N
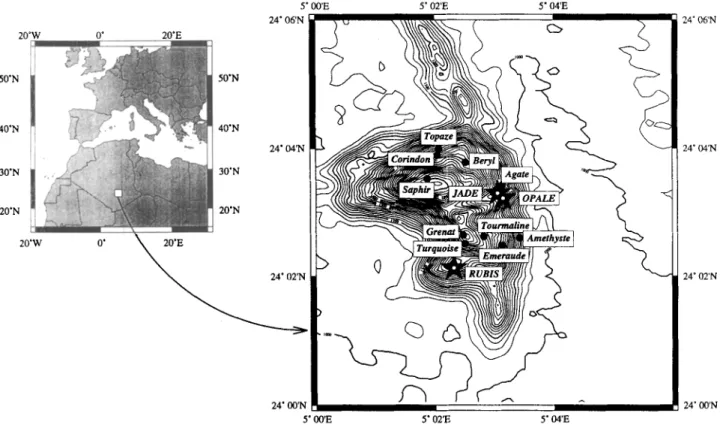
The French nuclear test site used in the 1960s is located in the Hoggar massif (Fig. l ) , 4 km west from In Eker, and
150 km north from Tamanrasset in the south of Algeria. The
topography has been processed with GMT software (Wessel
& Smith 1991). The test site is located in a granitic massif, the Taourirt tan Afella (5'2' N; 24'3' N), which is intruded
in two gneiss series (Faur6 1972; Boullier & Bertrand 1981).
The massif is intruded to the west side of a 1 km thick
mylonitic zone (Fig. 2, from FaurC 1972). This zone,
approximately oriented N-S separates the In Eker gneiss series (west side) and the Tefedest gneiss series (east side). Both series present a N-S schistosity. The area around the massif is covered by a thin layer of sand. The massif is 8 km
long in the N-S direction and 5.6 km wide in the E-W
direction and has a maximum height of 2000m in a region
with 1000 m mean elevation.
The study is an analysis of the relation between
topography and waveform of the French explosions
detonated in the Taourirt tan Afella massif. This study
concerns the influence of the topography on the ground
motions at local distances (i.e. from 1 km to 30 km) with the
aim of understanding the waveforms observed in the N-S
and E-W azimuths at BRI (approximately 2 km south-west
from the explosions studied), BRIII (15 km west), INA (i.e. In Amguel, 30km south). Teleseismic propagation is not accounted for here.
2 D A T A COLLECTED
Thirteen underground explosions were detonated in the massif between November 1961 and February 1966 (see Table 2). Three sets of the recorded ground velocities are displayed in Fig. 3, which correspond to the explosions Jade, Opale and Rubis respectively. Only Rubis has been recorded at short distance (1.73 km) from the source at BRI.
All explosions have been recorded at distances of around
15 km at BRIII and 30 km at INA.
The shape of the ground-velocity waveform differs greatly between these three explosions. The recordings at BRIII
and INA for Rubis show pure P wave and Rayleigh wave.
The recording of Opale at INA shows a longer surface wave
train on the horizontal component. The greatest difference is
found for recordings of explosion Jade which shows a long
and strong coda associated with surface waves at BRIII and INA. These differences may be explained by different causes, i.e. explosion working (spalling, coupling), water saturation in the source region (and its evolution between each experiment), or surrounding geological structures and topography which induce multipathing and amplification effects.
3 S T U D Y
Teleseismic influence of the tan Afella topography shape has
been detailed by Rocard (1964) and McLaughlin & Jih
964
5 24' 06" J 0' 2WE 5 0 " 4 0 " 30" 20" 24' Wlr; 5' 02'E 5' 04E 24' 06" 24' 04" 24' 02" 24' OO" 'E 5' 02'E 5' M E
Figure 1. Location of 1960s French nuclear test site. Explosions are depicted with black circles and stars. Stars are used for Jade, Opale and
Rubis, the explosions examined in this study.
(1988). Our main objective here is to understand the ground
displacement waveforms at local distances (less than 30 km)
in both N-S and E-W azimuths, in relation to the location
of the shot inside the massif and to the azimuth of recording.
To realize this objective, the global response of the Taourirt
tan Afella structure (Duclaux & Michaud 1970; Munier
1982) is considered to be made up of both topography and
crustal structure responses. The total displacement field
generated by topography and crustal structure is made of
multiple diffractions between topography and crustal structure. This implies that it is impossible to linearly separate the topographic effect from the underground- structure effect. The site effects presented below are related to the topography alone without taking into account the underground structure below it.
The results presented below are relative to the
topographical effects of Taourirt tan Afella. They show the
ground displacement modifications induced by (i) the topo- graphy shape and (ii) the detonation location inside the mountain. The numerical method used for computation is
the discrete wavenumber-boundary integral equation
method (Bouchon & Aki 1977; Gaffet & Bouchon 1989).
The wave-propagation velocities are (Y = 6 km s1 and
p
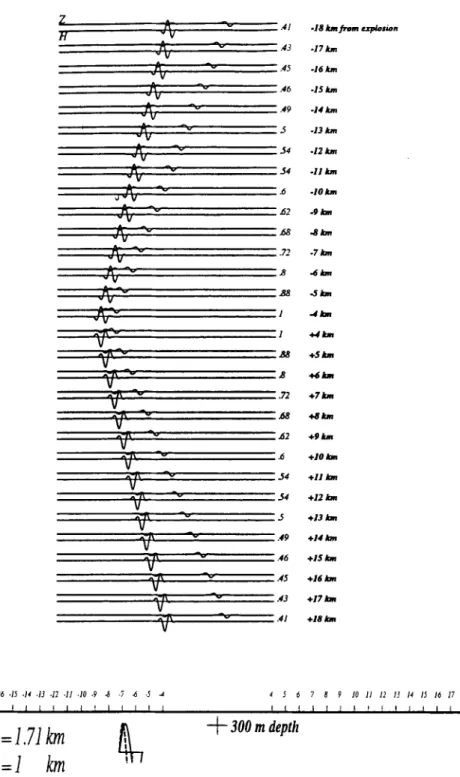
= a/fi, and the source-time function is a Ricker pulse.Figure 4 shows, as reference, the ground velocities
obtained for an explosion buried at 300 m depth under a flat
surface. The only waves generated are the direct P wave
followed by the Rayleigh wave of lower amplitude.
Preliminarily, an observational analysis is made with two fictitious explosions located in both sides of the massif along a NW-SE section as shown Fig. 5. The explosions are
buried at 290m and 100m depth for the north-western and
south-eastern explosions, respectively called explosions
I
and 11. Fig. 6 shows the ground velocity computed with a
Ricker source pulse central frequency of 3.5 Hz, at stations
distributed from 31 km to the north-west to 31 km to the
south-east of both explosions. The time duration is 13 s.
The first arrival is a P wave (P=;" and Psi) that propagates
alone in both azimuths for explosion I, while it consists of
two pulses (Pi' and P:;) delayed by 0.8 s in the north-west
and one pulse in the south-east ( P z ) for explosion 11. The
inverted polarity and amplitude variation of P:: compared
to P:; may indicate that the second pulse has been
generated by reflection of the direct P wavefield inside the
mountain.
The surface waves show a more complex shape and
amplitude behaviour for explosion I than for explosion 11.
(1) The relative amplitude in the north-west azimuth is 25
per cent and 40 per cent lower than the one obtained in the
south-east for explosions I and I1 respectively.
(2) Waveforms of R=;" and R;YAA, phases have a higher
frequency content for explosion I than has the R i w phase for
explosion 11.
(3) In the case of explosion 1, the main surface Rayleigh
wave train, R=;", is followed by a coda, RSYAA,, which may
consist of a back-diffracted surface wave inside the
south-eastern side of the massif. The symmetric observation
of such a coda cannot be made for explosion 11, i.e. this
observation implies that the hillside steepness strongly shapes the back-diffracted field.
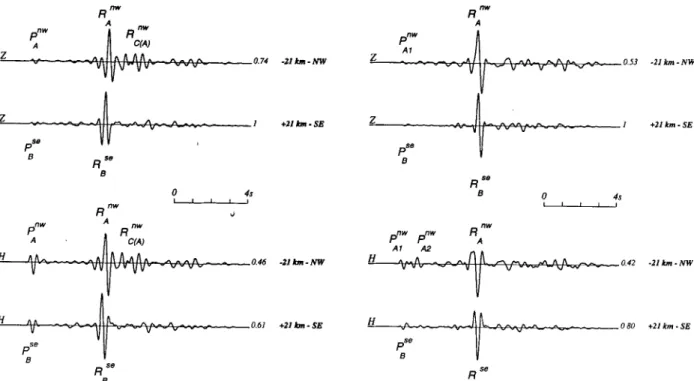
A detailed comparison of the ground velocities at 21 km is
displayed in Fig. 7 for both explosions. Besides the
966
S. Gaffet etal.
1 0
laourirt
Tan Afelia
In
Eker
2 4 0 0 0
Ti
medi i d
aouine
Petit
Taourirt
23" 5 0
Figure 2. This map, from FaurC (1972), illustrates the geological formation located around the Taourirt tan Afella test site.
Table 1. Location of the ground velocity recorders.
Code
Lat N
Lon
E
BRI
24
02
07.7
05 01
17.8
BRIII
24
02 00.8
04 55 01.9
INA
23 47
30.0
05
07
30.0
waveform differences observed between north and south, the relative amplitude given in Fig. 7 shows that the surface
ellipticity (called E, and defined here by the ratio
HmaX/Zmax) of the Rayleigh wave remains constant,
whatever the azimuth is, for a given explosion location. On
the other hand, ellipticity varies when source location
changes, i.e. = 0.60 and E~~ = 0.80 while E = 0.6812
(Ben-Menahem & Singh 1981) should be obtained without
mountain topography and a Poisson ratio of 0.25 as used in
this paper. Thus, the phase velocity of the main Rayleigh wave train is modified by source site condition.
967
RUBIS
JADE
w, tOPALE
t 1 2 3 4 5 6 7 8 1 l 1 , . 8 , 1 I 1BRlll Z
n 0 5 0 51
BRZll E W
4 ' ' n . -95 IFigure 3. Ground velocity recorded for Jade, Opale and Rubis at locations BRI for Rubis, and BRIII and INA for Jade, Opale and Rubis. Locations of receivers are shown in Table 1.
Figure 8 displays the realistic geographical configurations
that correspond to explosions Jade, Opale and Rubis. The sections and relative explosion locations obtained for Jade
and Opale are so similar at the wavelengths studied, i.e.
A, = 1 km (see right side of Fig. 7), that they will now be
considered as one detonation point. This means that the Rayleigh waveform differences observed at BRIII (Fig. 3) cannot now be associated with the topographical effects studied but should be related to the explosion source itself.
Besides the N-S section for Rubis and the two W-E
sections, the N-S section related to Jade/Opale does not
respect any cylindric aspect, i.e. in this case, results obtained
by the corresponding 2-D simulation will be solely
descriptive and should be cautiously related to real data such as those mentioned hereafter, at INA for instance.
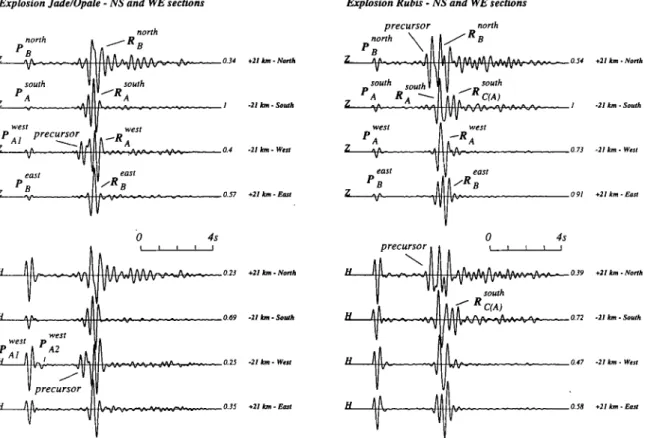
Taking into account the previous remark, Figs 9 and 10
display the ground velocities calculated in N-S and E-W azimuths for explosions Jade/Opale and Rubis. The source
pulse is a ,Ricker function centred at 3.5Hz. The
time-window duration is 13 s. Explosion Jade/Opale is
buried at 370m vertical and 310m normal depths, the explosion Rubis is buried at 550m vertical and 450m normal depths. Explosion Jade/Opale is located inside the
mountain i.e. approximately 100 m above the 1000 m mean
elevation of the surrounding tableland, while explosion
Rubis is buried at a level approximately 100m under this 1000 m elevated plateau.
The phases noted PngOrth and R>Orth (Fig. 9) show similar
waveforms for both explosion sites Jade/Opale and Rubis.
Though R;Prth has a longer duration of large-amplitude
oscillations for Rubis, i.e. approximately one cycle more,
compared to Jade/Opale, the relative amplitude of the
surface wave train RngOrth of Jade/Opale is 1.5 times the
relative amplitude for Rubis at epicentral distances greater than 15 km. The relative amplitudes obtained in the N-S azimuth are very different between both sites. The relative amplitude for Jade/Opale is 2.5 times the one for Rubis; this
result reproduces well the observation of P and Rayleigh
wave-amplitude ratio at station INA (Fig. 3). Rubis shows a
longer Rayleigh wave train RTuth, followed by a coda
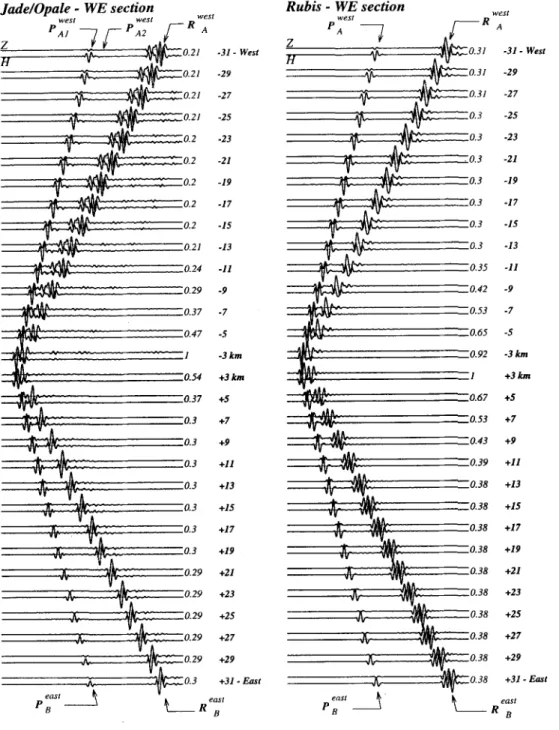
The W-E section ground velocities are compared in Fig. 10 for both sites. The topographic heterogeneity dimensions
of the two configurations are 5 km long X 1 km height for
Jade/Opale and approximately 3 km long X 0.5 km height
for Rubis. This implies that coupling wavelengths for Rubis should be reduced by half compared to Jade/Opale. Such an
effect is clear in the eastern azimuth with R T t frequency
behaviour between both sites, while it does not appear in
the western azimuth. Two consecutive P waves, P X s t large
and
P:yt
low amplitudes, delayed by 0.8 s, are generated at the explosion site corresponding to Jade/Opale. This minorsecond phase may be a diffracted P surface wave, its time
delay and small amplitude being induced by the propagation along the mountain topography. The Rayleigh wave train,
RTst
generated at the Jade/Opale site has a longer timeduration, 1.7 s, and a smaller relative amplitude than that
observed for Rubis. It also shows a low-amplitude Rayleigh Rsouth C ( A ) , than
RYth
for explosion Jade/Opale.968 S.
Gaffer
et al.Velocity at 3.5
HZ
-
Time window: 7.80 s0 c l - V
-
..
-16 h -IS h -I4 km -13 km -12 km -11 km -10 h -9 h 5 h 4br + 4 h +5 h &in +I h + a h +9 h +I0 hFigure 4. Horizontal (H) and vertical ( Z ) components of the ground velocity computed for an exposion buried at 300m depth under a flat surface in a homogeneous space. The source is a Ricker pulse centred at 3.5 Hz. The time window is 7.8 s. Receivers are identified by their epicentral distances (from -18 km to +18 km).
wave train that arrives before the main surface wave train, and this precursor does not appear for the Rubis site.
A general observation of stacks presented in Figs 9 and 10 is that seismograms obtained in the N-S azimuth show more complex time duration, waveform and frequency content behaviours than those calculated for the W-E section. This
observation may be related to a more complex N-S
topography shape (see Fig. 8), therefore inducing a more
complex wave diffraction scheme by topography than the
one for the W-E section.
A detailed comparison between ground-velocity com-
ponents calculated at 21 km epicentral distance from each
side, i.e. azimuths, for both Jade/Opale and Rubis sites
is displayed in Fig. 11. The different phases discussed
previously are labelled above each component. A new time,
surface ellipticity, based on the relative amplitudes found for
969
24' 06h 24' 04" 24' 02" 24' 00" 5 24- 06" -5 0 5 24' 02" -5 0 5 offset in km 24' OO" 'E 5' 02'E 5' WEFigure 5. Geometrical configuration used to compute the seismograms presented in Figs 6 and 7. A NW-SE section crosses the tan Afella massif with two fictitious explosions called I and I1 in the text. Locations in 1-D section are given on the right side, with elevation in metres and offset from explosion in kilometres.
each component, remains constant whatever the azimuth is and appears to be sensitive to both topographic hetero-
geneity shape and explosion location. E = 0.68 for explosion
Jade/Opale in the N-S azimuth, E-0.62 in the W-E
azimuth while ~ e 0 . 7 2 for explosion Rubis in the N-S
azimuth and E = 0.64 in the W-E azimuth.
The different components stacked in Fig. 11 align both P arrivals and the main Rayleigh wave trains, i.e.
.
Precursors are depicted before the mainR;o;:hgor south
Table 2. French explosions and their characteristics.
Explosion Date Time UT Lat N Lon E rnb
Agate 1961/11/07 llh 29m 59.931s 24' 3' 25.5" 5O 3' 7.6"
Beryl 1962/05/01 10h OOm 00.458s 24' 3' 46.8" 5' 2' 30.8"
Emeraude 1963/03/18 10h 02m 00.351s 24' 2' 28.9'' 50 3' 7.9"
Amethyste 1963/03/30 09h 59m 00.328s 24' 2' 36.0" 5" 3' 25.2"
Rubia 1963/10/20 13h OOm 00.011s 24' 2' 7.8" 5O 2' 19.0" 5.6 ( USGS )
opale 1964/02/14 Ilh OOm 00.347s 24' 3' 13.1" 5O 3' 8.6"
Topaze 1964/06/15 13h 40m 00.367s 24' 3' 59.8" 5O 2' 4.4" Turquoise 1964/11/28 10h 30m 00.035s 24' 2' 30.7" s4 2' 30.1" Saphip 1965/02/27 llh 30m 00.039s 24' 3' 31.4" 5O 1' 52.3" 5.8 ( U S G S ) Jade 1965/05/30 llh OOm 00.037s 24' 3' 18.0'' 5O 3' 3.1" Corindon 1965/10/01 10h OOm 00.043s 24" 3' 53.7" 5O 2' 2.6" Tourmaline 1965/12/01 10h 30m 00.088s 24" 2' 37.4" 5" 2' 48.9" 5.1 ( USGS )
Grenat 1966/02/16 Ilh OOm 00.035s 24" 2' 39.0" 5" 2' 28.4"
Rayleigh wave train for explosion Jade/Opale in the west and for explosion Rubis in the north. These precursors are generated with a similar and symmetric diffraction scheme (see the W-E section for Jade/Opale and the N-S section
for Rubis in Fig. 8). These precursors are generated by the
direct
P wavefield diffracted into Rayleigh wave on the
opposite side of the mountain while the main Rayleigh wave
train is generated by the direct P wavefield diffracted into
Rayleigh wave on the nearby topography. Except for explosion Rubis in the N-S section, the main frequency content varies from one side to the other for each section and explosion. It appears that the more the topography steepens, the lower the frequency of the main Rayleigh wave train becomes. This phenomenon appears simul- taneously on both components. Such behaviour is not seen for Rubis at the N-S section, which it may be explained by identical steepness on both sides of the mountain.
4 CONCLUSION
The results show the great influence of topography on the ground velocity recorded in the frequency band 1-4Hz, at epicentral distances from 3 to 31 km for three explosions detonated inside the granitic massif of the Taourirt tan Afella. The general result is that the topography alone strongly shapes the ground velocities, their amplitudes and their frequency contents.
The main results are as follows.
(1) The back-scattered wave strongly shapes the seismo- grams. The surface wave appears to be generated after
970
S. Gaffet etal.
Explosion I(NW)
-
N147
section nw nw nw P - R - r R Z u C(Al -31-
NW -29 -27 -25 -23 -21 -19 -1 7 -15 -13 -11 -9 -7 -5 -3 km +3 km +5 +7 +9 +I1 +13 +15 +I 7 +I9 +21 +23 +25 +27 R 9 +31- S EExplosion II (SE)
-
N147
section P nw-l r P nw I--R nw H Z .. 0.34 0.34 0.34 0.34 0.34 0.66 0.66 n , "mP 0.66 n."5,
0.65 0.65 P -31 - N W -29 -27 -25 -23 -21 -19 -17 -15 -13 -11 -9 -7 -5 -3 km +3 h +s +7 +9 +11 +13 +15 +I 7 +19 +21 +23 +25 +27 +29 +31- SEFigure 6. Comparison of ground velocity computed at epicentral distances of 3-31 km from each side of the mountain, for explosions I (left side) and I1 (right side). The first column in the right side of each stack gives the relative amplitude for each explosion, the second column gives the epicentral distances. See text for explanation. Time duration is 13 s and source time function is a Ricker pulse centred at 3.5 Hz.
Expbswn I (NW)
-
N147 sectionP""
Expbswn II (SE)
-
NI47 sectionI R "lY z T & - - 1 +I1 km
-
SE B R " 0-
4s R""
J 0.46 -21 bn-Nw V 0.61 +21bn-S.E H PSe I R se B RA"W P"" A7 053 - 2 l k m - N W z -I + Z I k m - S E R *' 4s 0-
R""
P"" P"" 0.42 . 2 1 h t m - NWFigure 7. Comparison of the NW and SE horizontal and vertical ground-velocity components recorded for explosions I and I1 at 21 km epicentral distance. The names of different phases are given with their significances explained in the text. Relative amplitudes are given for
each 24' 06" 24' 04" 24' 02" 24' OO" I'E 5' W E 5' WE 24' 06" 5
::
loo0 -5 0 5 Jade::
lMxf 24' 02" -5 0 5 Opale -5 0 5 I , I I 24' OO" f i W -*L t l O O 0 I ' I I -5 0 5 RubisFigure 8. Realistic configuration for Jade, Opale and Rubis. Two 2-D sections (N-S and W-E) are reported on the right side for each detonation point. Elevation and offset from shot are given in metres and in kilometres, respectively.
972 S.
Gaflet
etal.
Jade/Opale-
N S section SOUlll m I 0 89 0 89 0 89 0 89 0 9 0 9 0 9 0 91 0.91 0.92 0.93 0.92 0.91 0.83 0.91 I 0.47 0.38 0.34 0.31 -31-
Solitli -29 -27 -25 -23 -21 -I 9 -1 7 -15 -13 -11 -9 -7 -5 -3 kin +3 km +5 +7 +9 +I1 +I3 +15 +I7 +I 9 +21 +23 +25 +27 +29 +31- NorthRubis
-
N S section S O l 4 t h soutl, SOUlli P . 1 RA 7 f - RC(.A) - A H 2 0.35 0.35 0 35 0 35 0.35 0 35 0 0.36 0.36 0.36 0.36 -31-
South -29 -27 -25 -23 -21 -19 -17 -15 -13 -11 -9 -7 -5 -3 km +3 km +5 +7 +9 +11 +13 +15 +I 7 +19 +21 +23 +25 +27 +29 +31- NodhFigure 9. Stacks of ground velocities for explosions Jade/Opale and Rubis and receivers in the N-S section. The time duration is 13 s and the source function is a Ricker pulse centred at 3.5 Hz. Relative amplitude for each explosion and negative, i.e. southern azimuth, and positive, i.e. northern azimuth, offsets from explosions are reported in the right side first and second column respectively of each stack. Different phases are labelled and discussed in the text.
of
973 west Jade/Opale-
WE section Z wesI A 0.21 0.2 1. 0.2 0.2 0.24 1 0 29 r - 0 37 0.47 J 0.54 0.37 0.3 0.3 0.3 0.3 0.3 4 0.29 i 0.29 A 0.29 -31 - West -29 -27 -25 -23 -21 -19 -1 7 -15 -13 -11 -9 -7 -5 -3 km +3 km +5 +7 +9 +I1 +I3 +15 +I 7 +19 +21 +23 +25 +27 +29 +31 -East east1
Y '6Rubis
-
WE section west west P - 1 0.31 0.31 0.3 0.3 0.3 0.35 0.65 -0.92 1 0.38 A 0.38 ens1 4 A -31-
West -29 -27 -25 -23 -21 -19 -17 -15 -13 -11 -9 -7 -5 -3 km +3 km +5 +7 +9 +I I +13 +15 +I 7 +19 +21 +23 +25 +27 +29 +31 -EastFigure 10. Same as Fig. 9 but for the W-E section displayed in Fig. 8.
974 S. Gaffet et
al.
Explosion Jade/Opale
-
NS and W E sectionsnorth 0.31 +2f km . Nwlh 0.4 -21 km . We$: 0.57 +Zf km . Em1 0 4s I
-
0.23 +2f bn. Nonh 0.69 -21 km-
South 0.25 -21 km . WeslExplosion Rubis
-
NS and W E sections0.54 +2f km . Nonh I 2 1 km -Sou:h 0.73 -21 k m . We$: 0 4s 0.39 +If km . Nonh 0.72 -21 km . South 0.47 -21 km . West
Figure 11. Comparison of the N, S, W and E horizontal and vertical ground velocity components calculated for explosions Jade/Opale and Rubis at 21 km epicentral distance. The relative amplitudes are given for each explosion and component. Source-time function and window duration are those defined in Figs 9 and 10. Phases labelled in Figs 9 and 10 are reported and discussed in the text.
diffraction of the direct field onto both the opposite and the
nearby sides of the massif.
(2) The back-scattered field is made up of both a
P
surface wave and a Rayleigh wave train.
(3) We show that for a receiver located at the same
epicentral distance, the amplitude of the vertical ground
velocity may vary with a factor of 3, from one side of the
massif to the other.
(4) We show that the duration of the surface wave train
may be strongly enlarged depending on the azimuth of
observation.
(5) Precursors to the main Rayleigh wave trains may
exist, depending on diffraction conditions of the direct
P
wavefield.
(6) The steepness of the topography determines the frequency content.
ACKNOWLEDGMENTS
This work was supported by the Advanced Research Projects Agency and was monitored by the Air Force Office of Scientific Research under Grant 90-0356.
REFERENCES
Ben-Menahem, A. & Singh, S.J., 1981. Seismic waves and sources, Springer-Verlag, New York.
Bouchon, M. & Aki, K., 1977. Discrete wavenumber representation of seismic source wave fields, Bull. seism. SOC. Am., 67,
Boullier, A.-M. & Bertrand, J.-M., 1981. Tectonique tangentielle profonde et couloirs mylonitiques dans le Hoggar central polycyclique (AlgCrie), Bull. SOC. ge‘ol. France, XXXIII, 17-22. Duclaux, F. & Michaud, L., 1970. Conditions expkrimentales des
tirs nuclCaires souterrains franpis, 1961-1966, C. R. Acad. Sci. Paris, 270, 189-192.
FaurC, J., 1972. Recherche sur les effets gCologiques d’explosions nuclCaires souteraines dans un massif de granite Saharien, Report CEA-R-4257.
Gaffet, S . & Bouchon, M., 1989. Effects of two-dimensional topographies using the discrete wavenumber-boundary integral equation method in P-SV cases, J . acoust. SOC. Am., 85,2277-2283.
McLaughlin, K.L. & Jih, R.-S., 1988. Scattering from near source topography: teleseismic observations and numerical simula- tions, Bull. seism. SOC. A m . , 78, 1399-1414.
Munier, G., 1982. Construction d’un modble de croate sous le Hoggar Central, Report CEAILDG 53-82.
Rocard, Y., 1964. Formation du signal seismique lors d-une explosion souterraine, C. R. Acad. Sci. Paris, 258,2373-2375. Wessel, P. & Smith, W.H.F., 1991. Free software helps map and
display data, EOS Trans. Am. geophys. Un., 72,441. 259-277.