HAL Id: hal-01053778
https://hal.archives-ouvertes.fr/hal-01053778
Submitted on 1 Aug 2014
HAL is a multi-disciplinary open access
archive for the deposit and dissemination of
sci-entific research documents, whether they are
pub-lished or not. The documents may come from
teaching and research institutions in France or
abroad, or from public or private research centers.
L’archive ouverte pluridisciplinaire HAL, est
destinée au dépôt et à la diffusion de documents
scientifiques de niveau recherche, publiés ou non,
émanant des établissements d’enseignement et de
recherche français ou étrangers, des laboratoires
publics ou privés.
Different Er3+ environments in Mg-based
nanoparticles-doped optical fibre preforms
Francesco d’Acapito, Wilfried Blanc, Bernard Dussardier
To cite this version:
Francesco d’Acapito, Wilfried Blanc, Bernard Dussardier. Different Er3+ environments in Mg-based
nanoparticles-doped optical fibre preforms. Journal of Non-Crystalline Solids, Elsevier, 2014, 401,
pp.50-53. �10.1016/j.jnoncrysol.2013.12.040�. �hal-01053778�
Different Er
3+environments in Mg-based nanoparticles-doped optical fibre
preforms
F. d’Acapitoa, W. Blancb,∗, B. Dussardierb
aCNR-IOM-OGG Grenoble
bUniv. Nice Sophia Antipolis, CNRS, LPMC, UMR7336, 06100 Nice, France
Abstract
Developing new rare-earth ions-doped optical fibres for power amplifiers and lasers requires continuous improvements in fibres spectroscopic properties. To overcome some limitations inherent to silica glass, it is proposed to embed rare-earth ions in dielectric nanoparticles. In this article we focus on the modifications of the Er3+ions spectroscopy in
Mg-silicate nanoparticles doped into optical fiber preforms. Through EXAFS and fluorescence measurements, we demonstrate that different local environments are experienced by Er3+ions, attributed to the depolymerization of the phosphate network. These results gain insight into the tayloring of luminescence properties.
Keywords: silica, erbium, nanoparticles, magnesium, EXAFS, fluorescence, optical fiber
1. Introduction
Developing new rare-earth ions (RE)-doped optical fibres for power amplifiers and lasers requires contin-uous improvements in the fibres spectroscopic proper-ties besides reduction in device size and economical ef-ficiency. However, some potential applications of RE-doped fibres suffer from limitations in terms of spectro-scopic properties resulting from RE clustering or inap-propriate local environment when they are inserted into silica. An interesting solution consists in using silica as a mechanical host and support of the fibre optical waveguide, and in embedding RE-ions within nanopar-ticles (NP) of appropriate composition and structure [1, 2, 3].
The original route proposed by LPMC to obtain NP in fibres is based on the industrial MCVD (Modified Chemical Vapor Deposition) process. As silicate sys-tems have a strong stable immiscibility when they con-tain divalent metal oxides, we take advantage of thermal treatments inherent to this process to obtain NP through the phase separation mechanism. Through this route, NP are grown in-situ within the material when alkaline-earth ions (Mg, Ca and Sr) are incorporated into the fi-bre core [4, 5, 6]. In particular cases the effect of the
∗
Corresponding author. Tel.: 076-799; Fax.: +33-492-076-754
Email address: [email protected] (W. Blanc)
divalent metal is also to prevent the clustering of Er3+
in phosphate phases as shown for similar samples in [7].
In these samples, the spectroscopic behaviour of Er3+
ions depends on the concentration of the alkaline-earth ions [8]. To explain these modifications, we study, in this article, the local order around Er3+by Extended X-ray Absorption Spectroscopy (EXAFS) which permits to cast a link between local geometry and optical
re-sponse. EXAFS at the Er − LIII edge has already
re-vealed to be effective in the description of the site of
Er3+ [7] and Yb3+ [2] in optical fibre preforms with
nanoparticles obtained by phase separation. It revealed a marked affinity between the RE and phosphate phases.
2. Experimental
2.1. Sample preparation
Preforms were fabricated by the conventional MVCD
technique [9]. The so-called ’solution doping
tech-nique’ [10] was applied to incorporate magnesium and
erbium ions: the core porous layer, doped with GeO2
and P2O5, is soaked with an alcoholic solution of
ErCl3 : 6H2O and MgCl2 : 6H2O of desired
concen-trations. After drying of the solvent, the core layer is sintered down to a dense glass layer. Then the tube is collapsed into a solid rod, referred to as preform, at an elevated temperature higher than 1800◦
C. Preforms are stretched into 125-µm fibres using a drawing tower at
Figure 1: SEM pictures of Mg-0.1 (left) and Mg-1.5 (right) preforms.
temperatures higher than 2000◦
C under otherwise nor-mal conditions. Here we report on samples labeled as Mg-X doped with solutions containing X=0, 0.1, 0.3,
0.5, 0.7, 1 and 1.5 mol/l of MgCl2 salts. To
inves-tigate the role of phosphorus, two samples were pre-pared without this element and are labeled Mg-XnoP. Preform compositions were estimated from Energy
Dis-persive X-Ray measurements (160 × 130µm2 scanned
area in the core) and Electron Probe Microanalyses. It was found that GeO2and P2O5mean concentrations are
0.8 mol% and 0.4 mol%, respectively. MgO concentra-tion increases from 0.1 (Mg-0.1) to 5.5 mol% (Mg-1.5). Doping with Mg leads to the formation of nanoparticles in the core. SEM pictures for the Mg-0.1 and Mg-1.5 samples are presented in Fig.1. As previously observed, the mean size of the nanoparticles increases with Mg concentration [8]. It is about 50 nm in Mg-0.1 up to hundreds of nm in Mg-1.5. Optical losses induced by the NP have been discussed in a previous paper [8]. The erbium concentration of 0.01 mol/l was kept constant in the doping solution and the erbium ion concentration in samples was previously estimated to be 200 ppm [8].
2.2. Photoluminescence
Emission spectra of Mg-doped core of the preforms were recorded at room temperature. The beam from a continuous 980 nm, 250-mW fiber-coupled laser diode was coupled into the tested preform through a
single-mode fiber-coupler. The 1550 nm fluorescence was
collected from the second coupler arm and it was di-rected, through an isolator, to an optical spectrum an-alyzer (Anritsu MS9701C). The resolution of the OSA was 1 nm. Emission spectra reported in Fig.2 are aver-aged on twenty sweeps and the signal is smoothed on
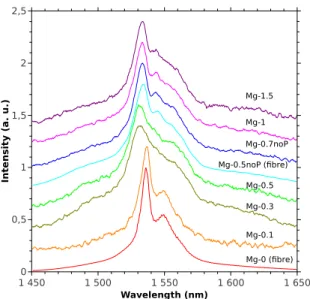
In te n s it y ( a . u .) 0 0,5 1 1,5 2 2,5 Wavelength (nm) 1 450 1 500 1 550 1 600 1 650 Mg-0 (fibre) Mg-0.1 Mg-0.3 Mg-0.5 Mg-0.7noP Mg-1 Mg-1.5 Mg-0.5noP (fibre)
Figure 2: Emission spectra of Mg-doped preforms (continuous lines) and fibres (dashed lines) recorded at room temperature. Excitation wavelength is 980 nm. Each spectrum is shifted vertically by 0.2.
F W H M ( n m ) 20 25 30 35 40 45 50 M a x im u m ( n m ) 1 531 1 532 1 533 1 534 1 535 1 536 1 537 [Mg]solution (mol/l) −0,2 0 0,2 0,4 0,6 0,8 1 1,2 1,4 1,6 −0,2 0 0,2 0,4 0,6 0,8 1 1,2 1,4 1,6
Figure 3: FWHM (triangles) and wavelength of the maximum of flu-orescence intensity (squares) vs Mg concentration. Open symbols are related to the samples without P.
eleven points. FWHM and wavelength of the maximum of fluorescence intensity are reported in Fig.3.
2.3. X-ray Absorption Spectroscopy
XAS measurements have been carried out at the GILDA-CRG beamline BM08 at the European Syn-chrotron Radiation Facility [11]. The monochromator was equipped with a pair of Si(311) crystals and was run in dynamical (horizontal) focusing mode [12]. The harmonic rejection as well as the vertical focusing was achieved by using a pair of Pd-coated mirrors with a cut-off energy Ecuto f f = 18 keV. This optical arrangement
permitted to obtain a focal spot of about 200×200 µm on the sample location, small enough to probe the core of the preform. The absorption coefficient was measured in fluorescence mode by using an energy resolving de-tector (12-elements array High Purity Ge). The spectra are shown in Fig.4 whereas the related Fourier Trans-forms are shown in Fig.5.
The structural model used for the quantitative data anal-ysis is the same used in previous literature for this class
of systems [13, 14, 15]: a RE ion linked to a S iO4
tetradedron with a well defined O distance and Er-O-Si bond angle. Here we note that, due to the similar backscattering amplitude and phase of Si, P and Mg it is not possible to distinguish these three atoms in the second coordination shell. The data analysis was car-ried out with the ATHENA and ARTEMIS [16] codes and the theoretical XAS paths were generated with the Feff8.10 code [17] starting from the Er2S i2O7 crystal
structure [18]. The EXAFS signal was modelized by us-ing the main scatterus-ing signals originatus-ing from the Er-O-Si triangular configuration as thoroughly discussed in [14]. The Debye Waller factor of the second shell was
fixed to 0.002 Å2 whereas the number of oxygen first
neighbors was linked to the Er-O bond length by using the data from the Bond Valence Method (BVM, [19]). BVM has been suggested in literature as an effective method in XAS data analysis to reduce the correlation between fit parameters [20]. By using the parameters published in [21] the relationship between the number
of O atoms NOand the Er-O bond length REr−Ocan be
approximated as :
NO≈63.343 − 67.499 × REr−O+ 18.695 × R2Er−O
The results of the quantitative analysis are shown in Table1.
3. Results and Discussion
From Fig.2 and Fig.3, Er3+ fluorescence properties
can be separated into three Mg-concentration domains.
Sample NO REr−O(Å) σ2O(Å2) REr−S i (Å)
Mg-0 4 2.30(2) 0.01(5) -4 2.37(2) 0.01(5) -Mg-0.1 7(1) 2.31(6) 0.013(6) 3.7(2) Mg-0.3 6.9(7) 2.30(4) 0.013(4) 3.7(1) Mg-0.5 6.9(7) 2.29(4) 0.011(4) 3.7(1) Mg-0.5noP 6(1) 2.24(3) 0.006(1) 3.6(1) Mg-0.7noP 7(1) 2.28(6) 0.014(6) 3.6(2) Mg-1 6.3(7) 2.26(4) 0.012(4) 3.6(1) Mg-1.5 6.2(7) 2.26(4) 0.012(4) 3.6(1)
Table 1: Results of the quantitative analysis of the EXAFS data. Sam-ple Mg-0 is fitted with a crystalline ErPO4model.
2 3 4 5 6 7 8 EXAFS signal k * χ (k) Photoelectron Wavevector k [°A -1] 0.4 Mg-0 Mg-0.1 Mg-0.3 Mg-0.5 Mg-0.5-noP Mg-0.7 Mg-1.0 Mg-1.5 Mg-1.5 res.
Figure 4: EXAFS spectra of the various Mg-doped samples (0.1-1.5) compared with a sample without divalent codopant (0). For Mg-1.5 also the fit is shown (+) with the residual (×).
0 1 2 3 4 5 6 Magnitude of the FT [ ° A -2 ] R [°A] 0.2 Mg-0 Mg-0.1 Mg-0.3 Mg-0.5 Mg-0.5-noP Mg-0.7 Mg-1.0 Mg-1.5 Mg-1.5 res.
Figure 5: Fourier Transforms of the spectra shown in Fig.4. For Mg-1.5 also the fit is shown (+) with the residual (×).
At low concentration (Mg-0 and Mg-0.1), FWHM is about 20-25 nm and the main peak position is at 1536 nm. These values correspond to those measured in a P-doped silica fiber [22]. For intermediate Mg concentra-tion (Mg-0.3 and Mg-0.5), FWHM increases up to 45-50 nm, the peak position shifts to shorter wavelengths and the spectrum appears poorly structured. As par-ticle sizes increase compare to previous samples, one may expect that the fluorescence spectrum could be in-fluenced by reabsorption effect. However, this effect would shift peak position to longer wavelengths. For the highest Mg concentration (Mg-1 and Mg-1.5), FWHM and peak position values are 35-40 nm and 1533 nm, re-spectively, whereas structures appear in the long
wave-length side of the line. These two values are close
to those reported for samples without P (open sym-bols in Fig.3). They can also be compared with values reported for alumino-germano-silicate fibre (type II in [22]): FWHM and peak position are 40 nm and 1533 nm, respectively.
The EXAFS spectra (Fig.4) show less differences re-spect to optical fluorescence with the exception of Mg-0 sample which contains more oscillating components than the others as also confirmed by the Fourier Trans-form (FT) (Fig.5). As previously reported for this sam-ple [7], the additional signals above the first coordina-tion shells are due to the formacoordina-tion of nuclei with the
ErPO4 structure. This P-cage effect has been already reported [23]. However, the fluorescence spectrum of Mg-0 does not present any features of crystalline phase [24] suggesting that this phase is not spatially extended and consist of only a few coordination shells (around 4-5 Å ). The Mg-doped samples exhibit a dominant os-cillation due to a Er-O coordination shell (Fig. 4). The FT confirms this idea as it shows only a dominant main peak at about 1.8 Å (Fig. 5). This situation is typical of rare-earth ions embedded in a glassy matrix. By
increas-ing Mg concentration, REr−O smoothly decreases from
2.31 down to 2.26 Å and the resulting N0decreases from
7 to 6 (Table 1).
Both fluorescence and EXAFS measurements demon-strate that Er3+ions experience different environements with Mg concentration. In the Mg-0 sample, a well or-ganised solvation shell is formed by P around Er as al-ready observed with this RE [23, 24] and Yb [2]. In the Mg-doped samples, the composition of the environment can not be determined exactly from EXAFS measure-ments as Mg, Si and P can not be distinguished with EXAFS analyses. However, we have reported that, in Mg-doped samples, Er ions are located in the nanopar-ticles which contain also P and Mg ions [25]. Concen-trations of these three elements in the NP are expected to
be higher than the mean concentrations reported in 2.1. Then, Mg-0.3 and Mg-0.5 results could be explained by assuming a P-rich and/or well polymerized environ-ment. Indeed, the degree of glass polymerization has been found to be correlated to the RE-O bond length in phosphate glasses [26]. In the case of ultraphosphate glasses, N0=7.3 and REr−O=2.29 Å have been reported
by [26], in accordance with Mg-intermediate
concen-tration results. Moreover, FWHM of Er3+ emission
bands in phosphate glasses is usually larger compare to those reported in silicate [27]. When Mg concen-tration increases, phosphate network tends to depoly-merize [28, 29]. In the less polydepoly-merized metaphosphate glass, N0=6.3 and REr−O=2.23 Å [26], as observed for
the highest Mg concentration. FWHM tends also to decrease when Mg is added to a phosphate glass [30]. However, for the highest Mg concentrations, the pres-ence of P in the local environment of Er can not be as-serted from these measurements as same characteristics are obtained in P-doped samples (Mg-1 and Mg-1.5) and P-free samples (Mg-0.5noP and Mg-0.7noP).
4. Conclusion
In this article we report on the modification of the er-bium ions environment by changing Mg concentration. Different environments are identified by comparing flu-orescence and EXAFS measurements. These changes are attributed to the depolymerization of the phosphate network. These results gain insight into the tayloring of luminescence properties of RE-doped optical fibres.
Acknowledgements
Authors greatly acknowledge Mich`ele Ude and Stanislaw Trzesien (LPMC) for the preparation of the preforms, Olivier Tottereau (Univ. Nice Sophia An-tipolis, CNRS, CRHEA, UPR 10, Valbonne, France) for SEM/EDX measurements and Ivan Kasik for EPMA measurements realized at the Institute of Photonics and Electronics of the Academy of Sciences of the Czech Republic. GILDA is a project jointly financed by CNR and INFN.
References
[1] B. Samson, P. Tick, N. Borrelli, Optics letters 26 (2001) 145– 147.
[2] C. Oppo, R. Corpino, P. Ricci, M. Paul, S. Das, M. Pal, S. Bhadra, S. Yoo, M. Kalita, A. Boyland, J. Sahu, P. Ghigna, F. dAcapito, Optical Materials 34 (2012) 660 – 664.
[3] J. Thomas, M. Myara, L. Troussellier, E. Burov, A. Pastouret, D. Boivin, G. M´elin, O. Gilard, M. Sotom, P. Signoret, Optics express 20 (2012) 2435–2444.
[4] W. Blanc, B. Dussardier, G. Monnom, R. Peretti, A.-M. Jurdyc, B. Jacquier, M. Foret, A. Roberts, Appl. Opt. 48 (2009) G119– G124.
[5] W. Blanc, B. Dussardier, M. C. Paul, Glass Technology - Euro-pean Journal of Glass Science and Technology Part A 50 (2009) 79–81.
[6] W. Blanc, V. Mauroy, B. Dussardier, Int. J. of Nanotechnology 9 (2012) 480–487.
[7] F. dAcapito, C. Maurizio, M. Paul, T. S. Lee, W. Blanc, B. Dus-sardier, Materials Science and Engineering: B 146 (2008) 167 – 170.
[8] W. Blanc, V. Mauroy, L. Nguyen, B. Shivakiran Bhaktha, P. Seb-bah, B. P. Pal, B. Dussardier, Journal of the American Ceramic Society 94 (2011) 2315–2318.
[9] H. P. J.B. Mac Chesney, P.B. Oapos Connor, Proc IEEE 62 (1974) 1280–1281.
[10] S. P. J.E. Townsend, D. Payne, Elect. Lett. 23 (1987) 329–331. [11] F. D’Acapito, S. Colonna, S. Pascarelli, G. Antonioli,
A. Balerna, A. Bazzini, F. Boscherini, F. Campolungo, G. Chini, G. Dalba, I. Davoli, P. Fornasini, R. Graziola, G. Licheri, C. Meneghini, F. Rocca, L. Sangiorgio, V. Sciarra, V. Tullio, S. Mobilio, ESRF Newsletter 30 (1998) 42.
[12] S. Pascarelli, F. Boscherini, F. D’Acapito, J. Hrdy, C. Menegh-ini, S. Mobilio, J. Synchrotron Rad. 3 (1996) 147.
[13] F. D’Acapito, S. Mobilio, P. Gastaldo, D. Barbier, L. F. Santos, O. Martins, R. M. Almeida, J. Non-Cryst. Solids 293-295 (2001) 118–124.
[14] F. D’Acapito, S. Mobilio, S. Scalese, A. Terrasi, G. Franz`o, F. Priolo, Phys. Rev. B 69 (2004) 153310.
[15] F. D’Acapito, S. Mobilio, P. Bruno, D. Barbier, J. Philipsen, J. Appl. Phys. 90 (2001) 265.
[16] B. Ravel, M. Newville, J. Synchrotron Rad. 12 (2005) 537–541. [17] J. J. Rehr, R. C. Albers, Rev. Mod. Phys. 72 (2000) 621–654. [18] Y. Smolin, Y. Shepelev, Acta Crystall. B 26 (1970) 484. [19] I. D. Brown, D. Altermatt, Acta Crystallographica Section B 41
(1985) 244–247.
[20] M. Newville, Physica Scripta 2005 (2005) 159.
[21] I. D. Brown, 2011. Http://www.iucr.org/resources/data/datasets/bond-valence-parameters.
[22] E. Desurvire, Erbium-doped fiber amplifiers: Principles and ap-plications, Wiley (New York), 1994.
[23] A. Saitoh, S. Matsuishi, C. Se-Weon, J. Nishii, M. Oto, M. Hi-rano, H. Hosono, J. Phys. Chem. B 110 (2006) 7617–7620. [24] R. Peretti, A. Jurdyc, B. Jacquier, W. Blanc, B. Dussardier,
Op-tical Materials 33 (2011) 835–838.
[25] W. Blanc, C. Guillermier, B. Dussardier, Opt. Mater. Express 2 (2012) 1504–1510.
[26] M. Karabulut, E. Metwalli, A. Wittenauer, R. Brow, G. Maras-inghe, C. Booth, J. Bucher, D. Shuh, Journal of Non-Crystalline Solids 351 (2005) 795 – 801.
[27] S. Jiang, M. Myers, N. Peyghambarian, Journal of Non-Crystalline Solids 239 (1998) 143 – 148.
[28] G. Walter, U. Hoppe, T. Baade, R. Kranold, D. Stachel, Journal of non-crystalline solids 217 (1997) 299–307.
[29] I. Wacławska, M. Szumera, Journal of thermal analysis and calorimetry 84 (2006) 185–190.
[30] S. Jiang, T. Luo, B.-C. Hwang, F. Smekatala, K. Seneschal, J. Lucas, N. Peyghambarian, Journal of Non-Crystalline Solids 263264 (2000) 364–368.