HAL Id: hal-02993638
https://hal.archives-ouvertes.fr/hal-02993638
Submitted on 16 Nov 2020
HAL is a multi-disciplinary open access
archive for the deposit and dissemination of sci-entific research documents, whether they are pub-lished or not. The documents may come from teaching and research institutions in France or abroad, or from public or private research centers.
L’archive ouverte pluridisciplinaire HAL, est destinée au dépôt et à la diffusion de documents scientifiques de niveau recherche, publiés ou non, émanant des établissements d’enseignement et de recherche français ou étrangers, des laboratoires publics ou privés.
Mechanical Shielding in Plant Nuclei
Rituparna Goswami, Atef Asnacios, Pascale Milani, Stéfanie Graindorge, Guy
Houlné, Jérôme Mutterer, Olivier Hamant, Marie-Edith Chabouté
To cite this version:
Rituparna Goswami, Atef Asnacios, Pascale Milani, Stéfanie Graindorge, Guy Houlné, et al.. Me-chanical Shielding in Plant Nuclei. Current Biology - CB, Elsevier, 2020, 30 (11), pp.2013-+. �10.1016/j.cub.2020.03.059�. �hal-02993638�
Graphical Abstract Click here to access/download;Graphical Abstract;GraphAbstractRev21March.tif
Mechanical shielding in plant nuclei
Rituparna Goswamia,b, Atef Asnaciosc, Pascale Milanid,Stéfanie Graindorgea, Guy Houlnéa, J.
Mutterera, Olivier Hamantb* and Marie-Edith Chaboutéa1*
a Institut de biologie moléculaire des plantes, CNRS, Université de Strasbourg, 67084
Strasbourg, France
b Laboratoire de Reproduction et Développement des Plantes, Université de Lyon, UCB Lyon
1, ENS de Lyon, INRAE, CNRS, 69364 Lyon, France
c Laboratoire Matières et Systèmes Complexes, Université de Paris, CNRS, Université
Paris-Diderot, 75013 Paris, France
d BioMéca, ENS de Lyon, 69364 Lyon, France
*Correspondence: [email protected] ; [email protected]
1 Lead contact
Summary
In animal single cells in culture, nuclear geometry and stiffness can be affected by mechanical cues, with important consequences for chromatin status and gene expression. This calls for additional investigation into the corresponding physiological relevance in a multicellular context and in different mechanical environments. Using the Arabidopsis root as a model system, and combining morphometry and micro-rheometry, we found that hyperosmotic stress decreases nuclear circularity and size and increases nuclear stiffness in meristematic cells. These changes were accompanied by enhanced expression of touch response genes. The nuclear response to hyperosmotic stress was rescued upon return to iso-osmotic conditions, and could even lead to opposite trends upon hypo-osmotic stress. Interestingly, nuclei in a mutant impaired in the functions of GIP/MZT1 proteins at the nuclear envelope, were almost insensitive to such osmotic changes. The gip1gip2 mutant exhibited constitutive hyperosmotic stress response with stiffer and deformed nuclei, as well as touch response gene induction. The mutant was also resistant to lethal hyperosmotic conditions. Altogether we unravel a stereotypical geometric, mechanical and genetic nuclear response to hyperosmotic stress in plants. Our data also suggest that chromatin acts as a viscous elastic gel that stiffens in hypertonic conditions, and that the nuclear envelope-associated protein GIPs act as negative regulators of this response.
Keywords: Nuclear mechanics; micro-rheometry; AFM; nuclear shape; nuclear envelope; hyperosmotic stress; touch gene; Arabidopsis; root tip; GIP/MZT1
Introduction
All living organisms are able to sense and respond to mechanical forces during their development [1]. Typically in animal cells, mechanical stress affects the cytoskeleton at the cell cortex [2]. Mechanical stress also has intracellular effects on nuclear shape and stiffness [3,4] and this may ultimately impact 3D chromatin organization and gene expression [5– 8].This either implies propagation of mechanical signals through the nucleus via biochemical cascades or more directly, through the LINC complexes at the nuclear envelope, at the nexus between cytoskeleton and nucleoskeleton [9–11]. Thus the stress born by the cytoskeleton can be transmitted to the nucleoskeleton, composed of lamins, and to chromatin [12–14]. Changes in tension levels at the nuclear envelope can also impact the entry of transcription factors [15] Yet, the interplay between nuclear shape and stiffness, and its contribution to nuclear function, is still not fully understood in animals [16–18] and is completely unknown in plants. Mechanical stress can be induced by changing osmotic conditions, through modification of the internal hydrostatic pressure that affects the cell cortex [19]. Thus, the role of membrane tension in cell polarity can be revealed by modifying the osmolarity of the medium in which single cells in culture are kept [20]. Hyperosmotic stress was also shown to shrink the nucleus through an uneven distribution of macromolecules between cytoplasm and nucleoplasm [21] and to affect gene expression by modifying chromatin compaction [3]. Under natural conditions, high salinity and drought are the most frequent causes of osmotic stress in plants [22]. Osmotic stress leads to changes in chromatin remodeling and gene expression to protect the cell [23–25].
As in animals, gene expression in plants is in part under mechanical control. For instance, the expression of 2.5% of the genome is significantly affected by a gentle touch in Arabidopsis [26,27]. Furthermore, the expression of the transcription factor PtaZFP2 linearly correlates with stem bending in poplar [28], and the expression level of homeodomain master regulator SHOOT MERISTEMLESS scales to tissue folding and can be induced by mechanical perturbation during organogenesis at the shoot apical meristem [29]. Yet, whether osmotic conditions affect nuclear mechanics and shape, and whether gene expression relates to such modifications is unknown.
Variation in nuclear shape is observed in mutants impaired in LINC components or in plant-specific proteins found at the nuclear envelope. Among them are the plant functional
homologs of lamins (KAKU4, NEAP, CRWN1-4) [30–33], as well as human MZT1 homologs, GCP3 interacting proteins (GIP) 1 and 2 [34]. GIP1 and GIP2 are associated to microtubule nucleation complexes via the gamma-tubulin protein complex3 (GCP3) [35,36]. Later on, they were also found to be associated to centromeric chromatin [34,37] (see Figure 2A). Here we explore the relation between nuclear stiffness and morphology in the multicellular context of the Arabidopsis root tip. Combining hyperosmotic stress, gip1gip2 mutations, nuclear shape and micro-rheometric measurements, as well as RNAseq analysis, we show that nuclear stiffness and touch gene expression scale with the osmotic environment of the cell. In addition, we show that plants defective in GIP proteins exhibit this response constitutively, correlating with an increased ability of the plant to resist hyperosmotic stress.
Results
Hyperosmotic stress decreases nuclear circularity and size in root tip cells
Building on results obtained in animal cells where osmotic stress affects nuclear shape [21], we tested the nuclear response to hyperosmotic stress in Arabidopsis root tips. Nine-day-old Arabidopsis seedlings expressing the inner nuclear membranuclear envelope SUN1-GFP marker [38] were exposed to 0.3 M mannitol for 16 hours (Figure 1). Nuclear shape was analysed by confocal microscopy, focusing on the central part of the root meristem and the external layers of the root (epidermis and cortex, see white frames in Figures 1A and 1B). Whereas most nuclei displayed round shapes in untreated seedlings, the treated nuclei exhibited irregular shapes and reduced size that were further quantified (Figures 1A-1B). Nuclear circularity was equal to 0.93 0.001 in control seedlings, (n = 99), and 0.85 0.008 in treated seedlings (n = 98), which is significantly different from the control (p-value =
3.23e-16, Figure 1C). Nuclear area reached 75% of its initial area, from 41.1 0.75 µm2 in
untreated seedlings to 32.1 1 µm2 in treaded seedlings (p-value = 1.63e-11, Figure 1E).
Similar findings were observed when considering the 3D nature of the nuclei (see method
details): nuclear sphericity decreased from 0.59 0.008 in control plants (n = 20) to 0.53
0.01 in treated plants (n = 20, p-value = 0.0006, Figure 1D); upon hyper-osmotic stress, nuclear volume reached 71% of its initial volume (n = 20, p-value = 0.0001, Figure 1F). As the trends in 2D and 3D are comparable, and because 3D measurements are more difficult to extract in our confocal microscopy set-up, we mainly focused our analysis on 2D measurements in the following.
Interestingly, under lower osmotic stress conditions, i.e. 0.15 M mannitol, no nuclear deformation could be detected in root meristems indicating the presence of a threshold in the
response (n control = 54, n treated = 68, p-values = 0.16 and 0.17 for nuclear circularity and area
respectively, Figures S1A-S1D). To confirm that the response is not mannitol specific, we also tested another osmolyte. A 0.15 M NaCl treatment, similar in osmolarity to 0.3 M mannitol, induced a decrease in nuclear circularity and area comparable to what observed
with 0.3 M mannitol (circularity of 0.84 0.01 and area of 31.95 1.75 µm2 after treatment,
n control = 91, n treated = 51, p-values = 1.98e-8 and 0.0043 respectively, Figures S1E-S1H). In order to see if changes in nuclear geometry could reflect changes in cell shape [39], we analyze cytoplasmic detachment from the cell wall in our root meristem under hyperosmotic
stress (0.3M mannitol). This effect was mild and the overall cell shape was not modified (Figures S1I-S1K, see white arrows in J, K). As the impact on the nucleus is in contrast severe, the nucleocytoplasmic volume ratio decreased significantly from 0.25 0.01 to 0.19 0.008 (n = 20, p-value = 0.0022), while the cell volume remained unchanged (p-value = 0.19, Figures 1G and 1H). Altogether, this demonstrates that hyperosmotic shock in root meristems decreases nuclear circularity and area, without significantly changing cell volume.
Nuclear shape defects in gip1gip2 mimic hyperosmotic stress
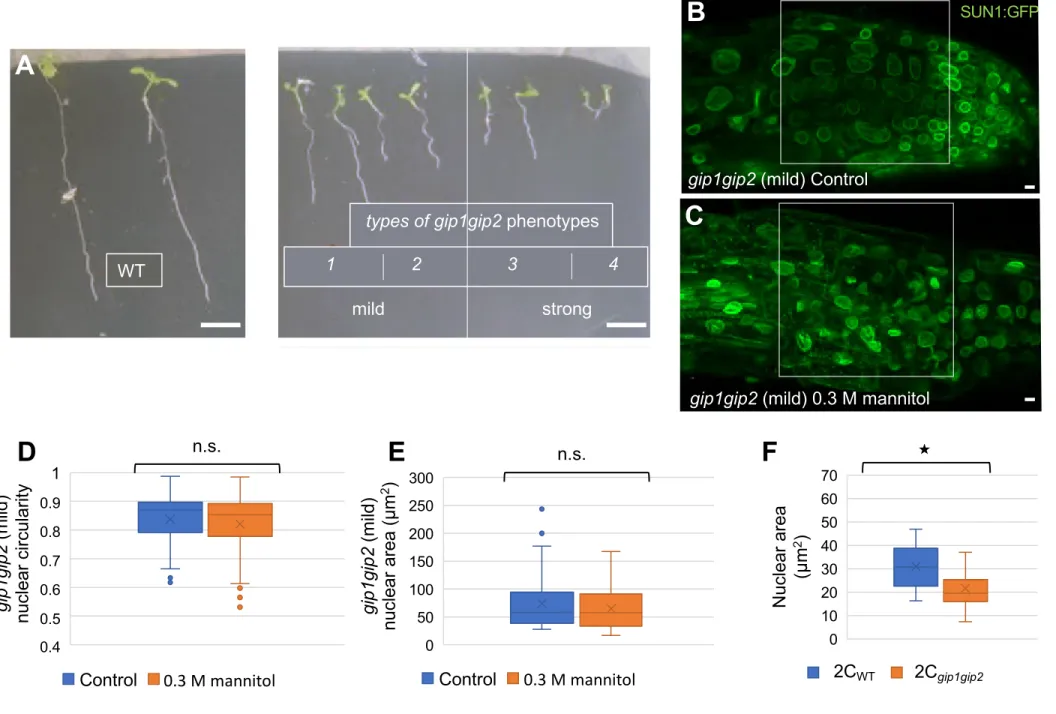
The gip1gip2 knocked-down mutant is impaired in the recruitment of microtubule nucleation complexes and centromeric chromatin architecture leading to ploidy defects [36,37] (Figure 2A). The mutant also exhibits severe developmental defects. Root growth is altered, and is variable from mild to strong phenotype (Figure S2A). As previously shown, root meristem nuclei from gip1gip2 SUN1-GFP seedlings exhibit shape defects [34] (Figure 2B) that resemble that of wild-type (WT) nuclei under hyperosmotic stress (Figure 1B). To go beyond this qualitative comparison, we characterized the nuclear shape of the mutant. Nuclear circularity in gip1gip2 was equal to 0.78 0.013 (n = 74, Figure 2D), which was significantly
lower than the untreated WT (0.93 0.001, n = 99, p-value = 2.19e-26, see Figure 1C).
However, nuclear area was increased in gip1gip2 and reached 63.8 3.45 µm2 on average (n
= 74, Figure 2E), to compare to 41.1 0.75 µm2 in untreated WT (n = 99, p-value = 9.79e-12,
see Figure 1D). Increased average nuclear area may relate to increased ploidy levels in the mutant [36,37]. In order to compare nuclear area between WT and mutant independent of ploidy, we analysed the area of WT and gip1gip2 nuclei in 2C flow-sorted root nuclei. This revealed that 2C gip1gip2 nuclei exhibit significantly smaller nuclei when compared to WT
nuclei (n 2C WT = 18 and n 2C gip1gip2 = 19, p-value = 0.0014, Figure S2F). This demonstrates
that gip1gip2 has more compact nuclei than the WT nuclei. This confirms that gip1gip2 nuclei fully mimic WT nuclei under hyperosmotic stress, at least from a geometric standpoint. Next, we investigated whether hyperosmotic stress could aggravate the gip1gip2 phenotype. To do so, we treated gip1gip2 seedlings with 0.3 M mannitol, as shown above for the WT. In such conditions, no more deformation was observed in gip1gip2 nuclei (Figures 2B and 2C):
nuclear circularity (0.74 0.017; n = 45) and nuclear area (62.8 5.53 µm2; n = 45) were not
significantly different from the untreated gip1gip2 control (0.78 0.013 and 63.8 3.45 µm2
we reached the same conclusions when analysing gip1gip2 seedlings with milder phenotypes (Figures S2B-S2E). Altogether, these results suggest that gip1gip2 may constitutively activate a hyperosmotic response.
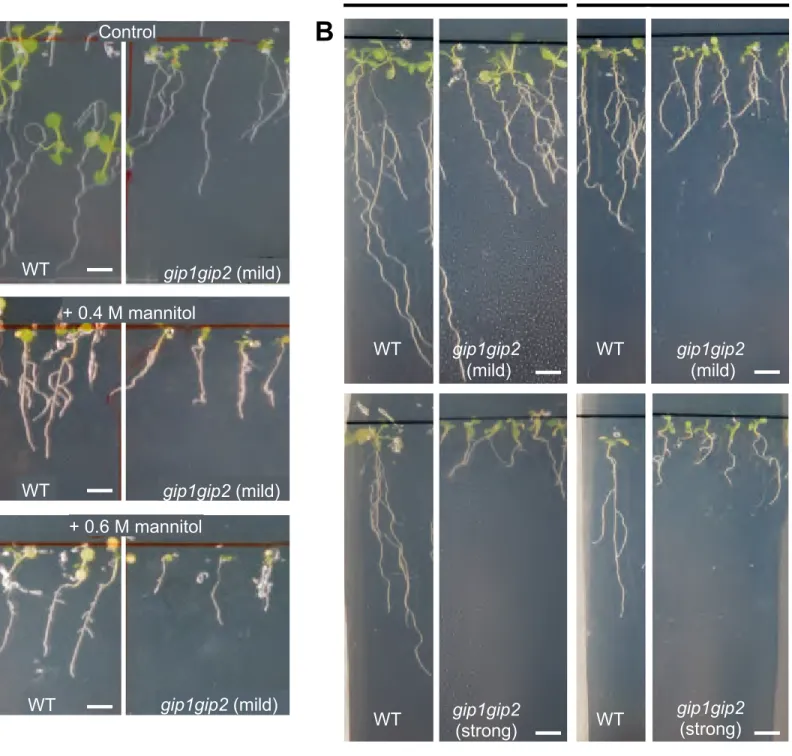
gip1gip2 mutants resist to high hyperosmotic stress
If the gip1gip2 mutant nuclei already exhibit a hyperosmotic-like response, this may also prime the plant to resist to hyperosmotic conditions. In order to test that hypothesis, we analysed the mutant phenotype upon 0.4 M and 0.6 M mannitol treatment. In these severe hyperosmotic conditions, widespread cell death occurred in WT root meristems (Figures 3A and 3B). In contrast, most of the gip1gip2 root tip cells from seedlings exhibiting a mild phenotype survived the treatment (Figures 3A and 3B).
In the surviving WT cells, nuclei were strongly deformed upon treatment with 0.4 and 0.6 M
mannitol, when compared to iso-osmotic control (n control = 38, n 0.4 M = 39, n 0.6 M = 41,
p-values for control vs. 0.4 M and control vs. 0.6 M are 2.903e-9, 1.51e-6 and 1.60e-10, 3.58e-10 for nuclear circularity and area, respectively, Figures 3C and 3D). Furthermore, when compared to 0.3 M mannitol (Figures 1C and 1E), nuclear circularity was even more reduced at 0.4 M mannitol value = 0.038) while the nuclear area was lower at 0.6 M mannitol (p-value = 0.019). No significant differences were observed between 0.4 M and 0.6 M mannitol (p-values = 0.094 and 0.075, respectively for nuclear circularity and area, Figures 3C and 3D). This indicates a threshold in the response to hyperosmotic stress for the WT. In contrast,
the gip1gip2 nuclear shapes remained unchanged in these harsher osmotic conditions (n control
= 58, n 0.4 M = 22, n 0.6 M = 43; p-values, control vs. 0.4 M and control vs. 0.6 M, are 0.33, 0.61
and 0.99, 0.53 for nuclear circularity and area, respectively, Figures 3E and 3F). This suggests that a maximum of nuclei deformation exists in the WT, and that gip1gip2 already reaches it in control conditions.
To test how the gip1gip2 mutant root grows in such harsh osmotic conditions, we analysed the impact of such conditions on root length in the WT and mutant. Nine-day-old seedlings were grown in normal conditions and then transferred on 0.4 M and 0.6 M mannitol for 2 days. In the WT, final root length was decreased by a factor 5 after transfer to 0.4 M (n =13,
p-value 3.8e-7) and by a factor 18.2 after transfer to 0.6 M mannitol (n = 12, p-value =
3.54e-5, Figure 3G). Although we also saw an impact on root length in gip1gip2, this was much milder: final gip1gip2 root length was decreased by a factor 2 after transfer to 0.4 M (n = 10,
p-value = 0.0029) and by a factor 4.4 after transfer to 0.6 M mannitol (n = 13, p-value =
1.74e-6 Figure 3G, Figure S3A). Note that the gip1gip2 mutant also seemed to resist to such harsh conditions even in the long term: after 15 days in harsh osmotic conditions, the
gip1gip2 exhibited reduced leaf senescence when compared to the WT ( n = 14, Figures 3H
and 3I).
Next, we measured root growth for 5 days in our standard hyperosmotic conditions (0.3 M mannitol) using WT as well as mild and severe gip1gip2 mutants. As expected, in these conditions, root growth was dramatically reduced in the WT (Figure 3J). In contrast, root growth was only slightly affected in the mild gip1gip2 mutants but the difference was too
small to be statistically significant (n control = 7, n treated = 6, p-value = 0.095, Figure 3I, Figure
S3B). In the severe gip1gip2 mutants, root growth was unchanged (n control = 6, n treated = 7,
p-value = 0.63, Figure 3J, Figure S3B).
Altogether, we identify three nuclear responses to hyperosmotic stress in the WT: up to 0.15 M mannitol, nuclear shape is stable; at 0.3 M mannitol, nuclei shrink and become more circumvoluted; above 0.3 M mannitol, nuclei are even more deformed but cells die, consistent with growth defects under such harsh hyperosmotic conditions. Because the gip1gip2 mutant nuclei are already more compact than the WT, this may also prime the mutant to resist hyperosmotic stress.
Nuclear deformation upon hyperosmotic stress or with defective GIPs correlates with nuclear stiffening
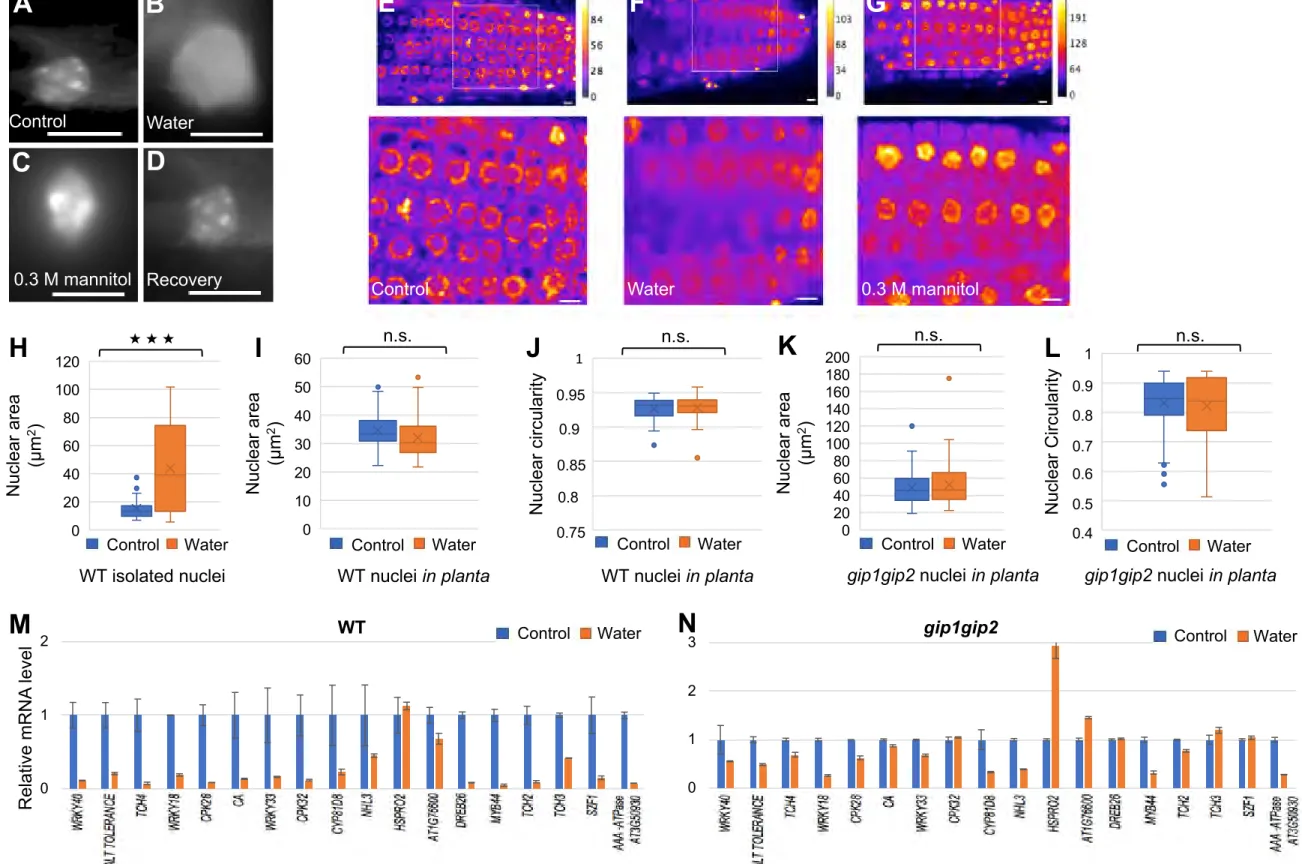
In theory, wavy nuclear envelope could result from cytoplasmic forces acting on a soft nucleus (in which case the cytoskeleton would shape the nucleus upon hyperosmotic stress), or from nuclear factors shaping and stiffening the nucleus (in which case, the nucleoskeleton and/or chromatin would shape the nucleus upon hyperosmotic stress). To discriminate between these two scenarios, we isolated nuclei from root meristems and checked their shape. Although extracted nuclei appeared smaller than nuclei in tissues, shape defects were still
maintained in WT extracted nuclei upon mannitol treatment (n control WT = 33, n treated WT = 57,
p-values = 2.7 e-9 and 0.0079 for nuclear circularity and area respectively, Figures S4A, S4B,
S4E, S4F). No significant difference in area or circularity was observed in extracted gip1gip2
suggests that the impact of hyperosmotic stress on nuclear shape mainly depends on the nucleus itself.
This prompted us to test the intrinsic physical properties of the nucleus. To do so, we measured the stiffness of isolated nuclei from untreated and treated WT root tips. First, we adapted a micro-rheometry approach, initially developed to measure whole cell stiffness [40,41]: the nucleus is compressed between two microplates, one flexible and the other one more rigid; the stiffness of the sample is deduced from the deflection of the flexible microplate, the stiffness of which is calibrated (Figures 4A-4C, see method details). Root meristematic nuclei were isolated from 9-day-old untreated or treated seedlings using a FACS-based protocol and they were then resuspended in MS medium with or without mannitol (as in whole plant treatments, see method details). Note that nuclear envelope integrity was confirmed by the presence of SUN1-GFP and microtubules (Figures S4I and S4J). Nuclei that were resuspended in control medium exhibited an elastic modulus of 0.39 0.07 kPa (n = 17, Figure 4D, video S1). In contrast, nuclei that were resuspended in
hyperosmotic conditions were about 10 times stiffer (4.15 1.78 kPa, n = 11, p-value =
0.0029, Figure 4D, video S2). This shows that reduced nuclear circularity and area upon hyperosmotic stress correlates with increased nuclear stiffness. If true, this should apply to
gip1gip2 nuclei too. Consistently, we found that gip1gip2 mutant nuclei were also stiffer than
WT nuclei (2.88 1.38 kPa, n = 17, p-value = 0.0001, Figure 4D) and with a stiffness value comparable to that of mannitol-treated WT nuclei (4.15 1.78 kPa, n = 11, p-value = 0.643, Figure 4D). Therefore, it seems that not only gip1gip2 mutants mimic the effect of hyperosmotic stress observed on WT nuclear shape, but it also mimics its impact on nuclear stiffness.
To validate these results in planta, we used atomic force microscopy (AFM). A sharp tip is attached on a flexible cantilever, which stiffness is calibrated. The deformation of the cantilever as it contacts the sample is monitored via a laser beam reflecting from the top surface of the cantilever into a photodetector. This provides force–displacement curves from which the mechanical properties of the sample can be derived (Figures 4E, S4L and S4M). Nuclei from WT and gip1gip2 root meristems from 9-day-old seedlings were analysed after in
situ cell wall digestion and meristem squashing (Figures 4F and 4H). The cantilever was
applied on the nuclei in planta on poly-L-Lysine coated petri dishes (Figures 4F and 4H). After acquiring matrix forces curves (Figures 4G and 4H, inset; Figures S4L and S4M),
topography and rigidity maps were obtained using the peakforce QNM (quantitative Nanomechanical mapping) mode (Figures 4G and 4I). Despite the differences in sample preparation between AFM and micro-rheometry, we found no significant preparation-dependent difference in the elastic modulus of the WT nuclei (Figure S4K), thus validating our approaches to compare the samples. Our AFM measurements confirmed the micro-rheometry analyses: nuclei from untreated WT root tips exhibited an apparent elastic modulus
(Ea) of 37.4 ± 3.6 kPa whereas gip1gip2 mutant nuclei were much stiffer, at 89.0 8.3kPa
(Figure 4J, n = 14, p-value = 0.0018). Thus, gip1gip2 nuclei are significantly stiffer than those of the WT, whether nuclear stiffness is measured by micro-rheometry or AFM.
Altogether we show that hyperosmotic stress leads to increased nuclear stiffness, which correlates with decreased nucleus size and area. This trend is mimicked in gip1gip2 mutants. Because nuclear shape and stiffness can affect gene expression, we next checked whether hyperosmotic stress and gip1gip2 mutation also have consistent effects on the transcriptome. Hyperosmotic stress and gip1gip2 mutation induce overlapping transcriptional stress responses
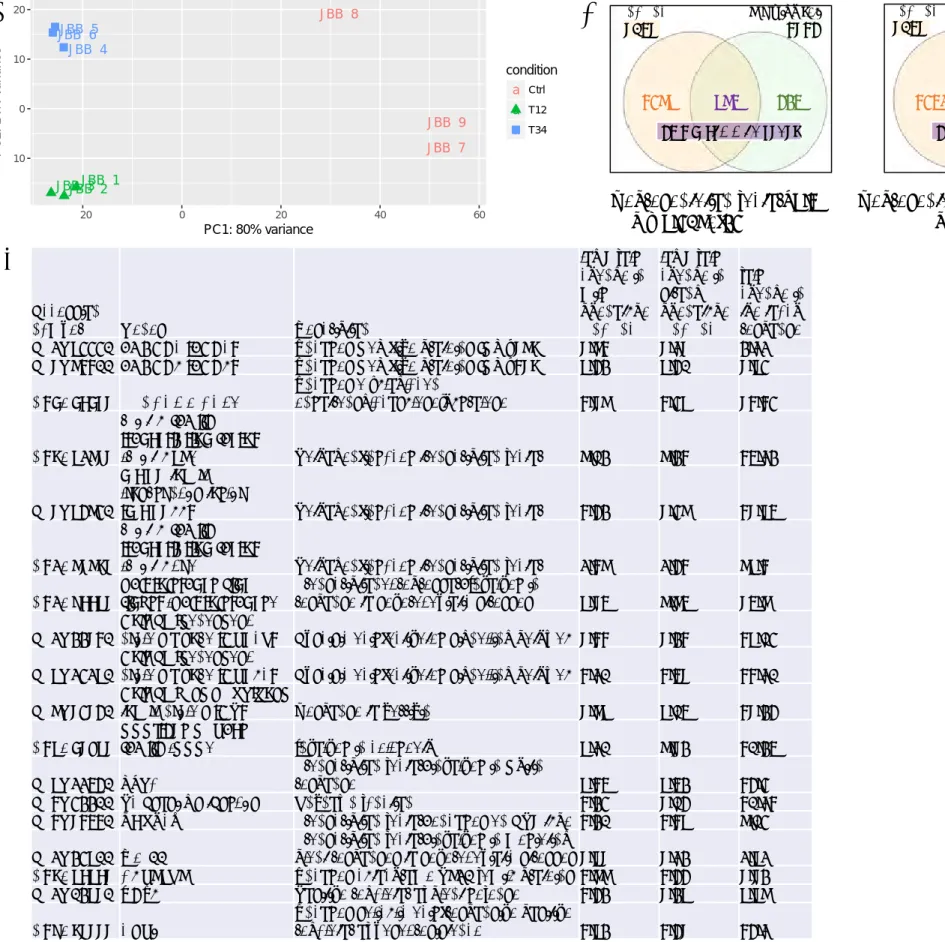
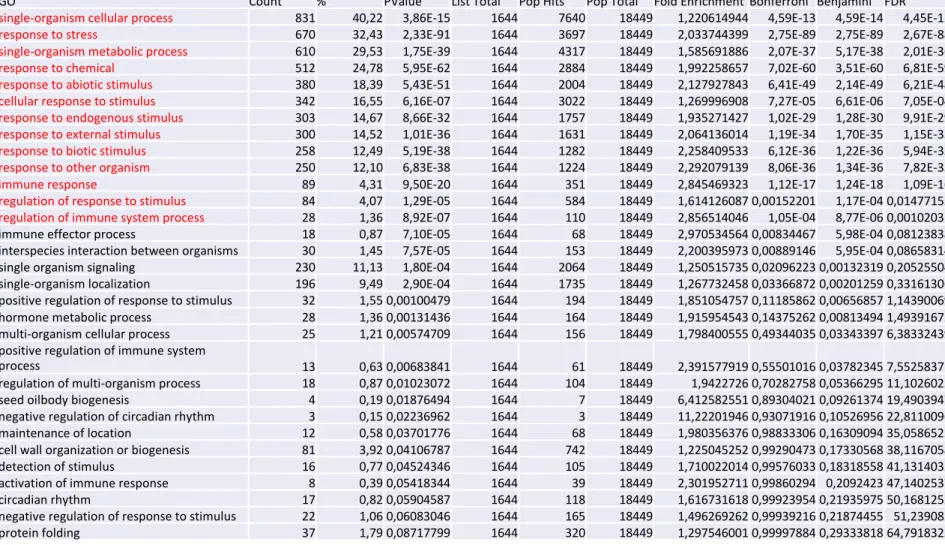
First, we analysed gene expression in gip1gip2 mutants using total RNA sequencing and RT-qPCR. We used gip1gip2 mutant populations from 9-day-old seedlings, with either mild or strong phenotypes (Figure S2A). Using a NGS approach (Illumina), we analysed 125 bp reads. PCA analysis revealed three different groups matching plant phenotypes (DESeq2 package). This approach generated a list of the shared most up-regulated genes in mild and severe gip1gip2, when compared to WT (Figure S5A). A list of differentially expressed genes was then selected with z-score calculations using Benjamini Hochberg corrections of 0.05 for false-discovery rate. The gip1gip2 mutant displayed major deviations from the WT in stress response genes, as annotated through their Gene Ontology (Table S1). In particular, the
gip1gip2 transcriptome shared 57% of the transcripts identified in the transcriptome of
touched plants [26], with a statistical significance of the overlap (Representation factor R =
7.8 with a probability p < 4.661e-231using hypergeometric test, Figure 5A).
Conversely, a significant overlap with the transcriptome of gip1gip2 was obtained when considering WT seedlings treated with high concentration of mannitol (21.4% of overlapping transcripts) or high concentration of sodium chloride (28.6 % of overlapping transcripts)
(Figures S5B and S5C, R=3.9 and 2.9 respectively and an exact hypergeometric probability p < 2.904e-118, [42].
Among the most up-regulated touch response genes (76 genes), 60 were also up-regulated in
gip1gip2. To check whether this response is specific to GIP, we analysed the expression of
these genes in the transcriptomic data of another nuclear envelope mutant, cpr5. This nucleoporin mutant exhibits major defects in nuclear shape and plant development [43]. Yet, although 23.6 % of the transcriptome of cpr5 overlapped with that of gip1gip2 (Figure S5D, R= 3.2 with a p < 9.70e-57, using hypergeometric test), only 7 genes were found to overlap with the most up-regulated touch response genes. This suggests that the GIP-dependent nuclear deformation and gene expression profile exhibits some degree of specificity, with a more prominent link to mechanical stress.
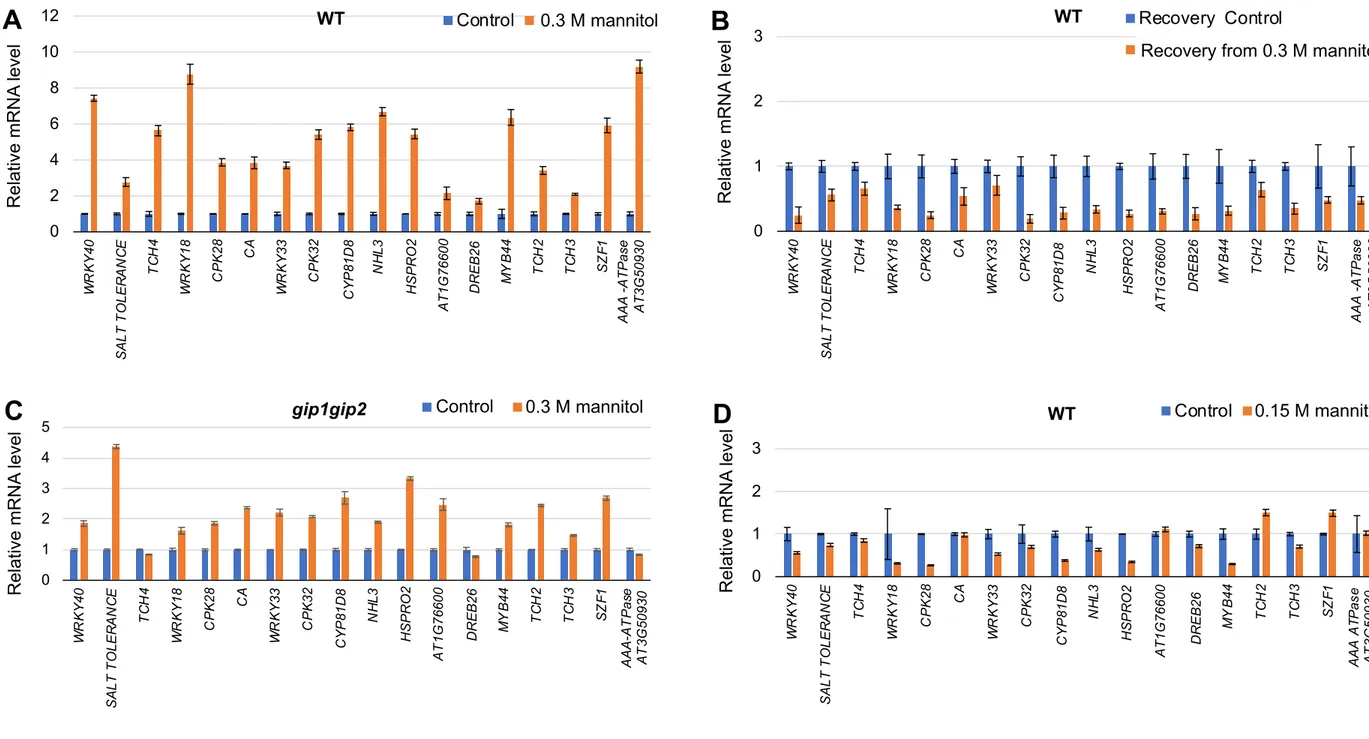
Then, we focused our analysis on a subset of 18 touch response genes, based on their established induction in response to mechanical perturbations [26,44] such as the TOUCH gene family (Figure S5E). First, we validated the expression of the selected 18 genes using RT-qPCR (Figure 5B). RT-qPCR was performed on 9-day-old gip1gip2 and WT seedlings using specific primers for the 18 selected genes (Table S2). As expected, we found a significantly increased transcript levels in gip1gip2 for these 18 genes. The induction was also stronger in the severe gip1gip2 mutant than in the mild one (Figure S5E). More specifically, mechanosensitive genes such as TCH2, TCH3, TCH4, WRKY33, WRKY40, CPK28, CPK32,
Calcium-binding EF-hand gene, AT1G76600, DREB26, NHL3, HSPRO2 displayed 3- to
16-fold higher transcript levels in gip1gip2, when compared to WT (Figure 5B). The transcript level of genes encoding the Salt tolerance zinc finger, the transcription factors WRKY18, WRKY40, Myb44 and SZF1 as well as the cytochrome CYP81D8 and the AAA-type ATPase family member was even more increased, from 20- up to 120-fold in gip1gip2 compared to WT (Figure 5B). Interestingly, none of these 18 genes were found up-regulated in cpr5 (Figure S5E).
To check whether similar transcript level changes were observed upon hyperosmotic stress, we performed similar analyses on the 0.3 M mannitol-treated seedlings compared to control plants. Under hyperosmotic stress, 9-day-old seedlings exhibited a response comparable to that of gip1gip2, albeit to a lower extent with mRNA levels changing from 2.4- to 53-fold (Figure 6A). Note that similar results were also obtained when analyzing the mRNA levels in
roots only, allowing us to formally correlate nuclear deformation and transcriptional response under hyperosmotic stress in root meristematic nuclei (Figure S6A).
As we observed that 0.15M mannitol is not sufficient to induce a detectable change in nuclear shape, we also analysed gene expression in these milder conditions. As expected, under such low stress conditions (0.15 M mannitol), no significant induction could be observed for the selected genes (i.e., below a 2-fold induction, Figure S6D). This further correlates changes in nuclear shape with gene expression, including the threshold in the cellular response to hyperosmotic stress.
Last, we found that most of the mechanosensitive genes were induced in the gip1gip2 mutant upon a 0.3 M mannitol treatment, albeit to a lesser extent when compared to WT, from 0.7- to 4.3-fold change in mRNA level (Figure S6C), consistent with the observation that gip1gip2 already exhibits a close to maximal nuclear shape deformation before mannitol treatment. Transcriptional nuclear responses to hyperosmotic stress are reversible
If the impact of hyperosmotic stress on transcriptome is associated with nuclear mechanics, it should be reversible. To test this hypothesis, we exposed 9-day-old seedlings to hyperosmotic stress for 16 hours and then transferred them back to normal medium for 7 hours. As a control, 9-day-old seedlings were exposed to normal medium for 16 hours and then transferred to fresh normal medium for an additional 7 hours. We then analysed the expression of the 18 selected genes listed above using RNA extracted from whole seedlings. Upon recovery, none of genes exhibited a significant induction (i.e., below a 2-fold change induction), when compared to the non-treated control (Figure 6B). Similar results were observed when using RNA extracted from roots (Figure S6B). The reversibility in expression is consistent with the idea that the induction of these genes relates to hyperosmotic stress. In order to correlate changes of gene expression upon recovery to changes in nuclear morphology, we also analysed nuclear shape upon release of hyperosmotic stress. After a 0.3 M mannitol treatment, root meristematic nuclei exhibited a deformed shape as previously shown, when compared to non-treated plants (Figures 7A and 7B). While nuclear shape remained unchanged after the additional 7 hours in the control medium (Figure 7C), the deformed nuclei observed in treated plants retrieved their original shape upon their transfer to control medium for 7 hours (Figure 7D). No statistical differences in nuclear circularity and
area could be detected between treated and untreated plants upon recovery (n control = 70, n treated = 61, p-values 0.74 and 0.56, respectively; Figures 7E and 7F).
Nuclear stiffening upon hyperosmotic stress is reversible
To link these changes to mechanical properties of the nucleus we performed measurements of nuclear stiffness on WT meristematic nuclei after mannitol treatment and upon recovery. Using both micro-rheometry and AFM, we found that mannitol-treated nuclei indeed become softer when the osmolarity of the medium is decreased. In the end, mannitol-treated-then-rescued nuclei exhibited an apparent elastic modulus that was comparable to that of the untreated iso-osmotic control (in AFM p-values control vs. recovery = 0.46; in micro-rheometry p-values control vs. recovery = 0.778; Figures 7G and 7H).
Interestingly, DAPI staining of the nuclei under micro-rheometry measurements revealed changes in the organization of the bright DAPI stained chromocenters associated with pericentromeric heterochromatin located at the nuclear periphery [45]. While in control and recovery nuclei (Figures S7A and S7D), the chromocenters were scattered as bright DAPI signals at the nuclear periphery, they appeared more clustered in the mannitol treated nucleus (Figure S7C). Conversely, when we treated the seedlings with hypo-osmotic stress (16h-water incubation), the chromocenters were more diffuse in isolated nuclei, while the size of the
nuclei was increasing (n control n = 45, n treated = 32 , p-value = 9.06e-8, Figures S7B and S7H).
Such nuclei seemed very soft and fragile. However we could not quantitatively assess this trend: only very few nuclei could be handled for micro-rheometry measurements (n = 5) providing no statistically significant bias (p-value = 0.265, Figure 7 H). We believe that we could only measure the stiffer nuclei, since the softer ones were probably, in essence, too weak mechanically to be micro-manipulated. Consistent with this hypothesis, the nuclei that
we could mechanically test were indeed significantly smaller (mean area 27.6 8 µm2) than
those that we could not handle (n=8, mean area 63.4 10 µm2, with a p-value of 0.047).
The discrepancy in DAPI staining was also observed at the tissue level, when analyzing nuclei in the root tips of WT, mannitol or water-treated seedlings (Figure S7E-S7G). However, we could not detect a significant increase of the nuclear area in root meristems of
seedlings treated with water compared to control plants (n control = 164, n treated = 174 , p-value
= 0.4, Figure S7I). In addition there was no clear changes in circularity (p-value = 0.12 Figure S7J), suggesting that the multicellular environment may prevent such hypo-osmotic environment to exist in vivo. Yet, except for HSPRO2, in such hypo-osmotic conditions, we
could observe a strong decrease in the transcript level of touch-induced genes when compared to WT control, between1.47- and 333-fold change (Figure S7M). However the response was very limited in gip1gip2 with a fold change between 1.14 and 3.84 (Figure S7N) and no further nuclear deformation was observed as well (Figures S7 K-S7L).
Altogether, the reversibility of the nucleus response to hyperosmotic stress further supports a scenario in which nuclear shape and stiffness homeostasis is under control, linked to transcriptional program, and for which, the GIP proteins play a major, negative, regulatory role. Conversely, the nuclear response to hypo-osmotic stress leads to nuclear expansion on isolated nuclei and negative regulation of the touch gene expression in planta (Figure 7I). Discussion
We show a reduction of both nuclear area (by 20%) and circularity (by 9%), an increase in nuclear stiffness (by a factor of 3 to 10) as well as a significant induction of touch response genes occur in a narrow window of hyperosmotic conditions (above 0.3 M and below 0.4 M mannitol). Importantly, these responses are reversible in iso-osmotic conditions, suggesting a mechanical response of the nucleus which may involve GIP/MZT1 proteins since gip1gip2 mimic all the observed responses in a constitutive way. Because the gip1gip2 nuclei are constitutively stiff, we propose that their increased resistance to hyperosmotic stress is in part provided by mechanical shielding through nuclear stiffening (Figure 7I).
Nuclear shape and stiffness may easily be related : nucleoplasm crowding following hyperosmotic stress may reduce nucleus size and increase its density, and thus its stiffness. Yet, the observation that a similar phenotype exists in the gip1gip2 mutant suggests that this response is not passive, but actively regulated by nuclear envelope components, likely through the global spatial reorganization of chromatin. These data in a tissue context echo the role of nuclear mechanics in single cells in animals. Indeed, nuclear mechanical structure is essential to drive nuclear shape and transcriptional gene regulation [46]. For instance, nucleus stiffness positively scales with matrix stiffness, and this response involves lamins A and is accompanied by transcriptional changes [47]. Although maintenance of nuclear shape depends, in part at least on the nucleoskeleton and chromatin [18,48], these components do not have overlapping roles : lamin A would provide a robust enough structure to resist large nuclear deformation, while chromatin would govern nuclear stiffness in smaller deformations [49]. Of note, in line with our results, nuclear deformations in response to a hyperosmotic stress were also observed in isolated chondrocytes and were accompanied by chromatin
hyperosmotic stress was shown to disrupt chromatin organization, with associated transcriptional changes as well [50]. The exact relationship between hyperosmotic stress and gene expression remains to be fully characterized in plants. Our analysis introduces the contribution of nuclear shape, stiffness and nuclear envelope factors in this network.
This work also raises new questions: how could the nuclear envelope control the nuclear response to osmotic conditions? As nuclear pores are too permissive to allow a pressure build-up inside the nucleus, this may likely involve the chromatin itself. This proposition is consistent with the reported impaired centromeric chromatin organization in the gip1gip2 [37]. Thus, GIP would indirectly control the gel-like properties of chromatin in response to osmotic conditions. Chromatin remodeling can also make nuclei more compact in animal cells [51], and chromatin can become more compact upon hyperosmotic treatment in plants [52] . Therefore, our proposition may also be applicable beyond the plant kingdom. As we also found that a mutant better resists hyperosmotic stress than the WT, our work not only integrates nuclear mechanics in the plant response to drought, it may also open the way for a better understanding of how plants cope with water stress.
Acknowledgments
This work was supported by the Centre National de la Recherche Scientifique (CNRS, defi Mecanobio, NEstress 2016-2018), by Fondation Schlumberger pour l’Education et la Recherche (FSER 2016-2018), by the European Research Council Grants ERC-2013-CoG-615739 “MechanoDevo”, by the IdEX international PhD program (unista, Strasbourg) and by HFSP Grant 2018, RGP, 009. This study was partially supported by the labex «Who AM I ?», labex ANR-11-LABX- 0071 and the Université de Paris, Idex ANR-18-IDEX-0001 funded by the French Government through its «investments for the future» program. We acknowledge discussions with members of the COST Action CA1612 INDEPTH network. We thank J. Fuchs (IPK, Gatersleben) for providing us flow cytometry sorting of nuclei as well as S. Koechler and A.Alioua at IBMP Gene Expression Analysis platform. We are grateful to K. Graumann for providing fluorescent-tagged SUN1 lines, as well as to Elise Hoffmann, L. Barret, and P. Johann to Berens for their technical help. We thank Jean-Pierre Henry for fruitful discussions about nuclear pores and mechanical regulation.
Author contributions
Conceptualization, A.A, M.E.C and O.H; Methodology, A.A, J.M., M.E.C, O.H, P.M.; Investigation, A.A., G.H., M.E.C., P.M., R.G.; Writing-original draft, M.E.C, O.H. and R.G.,
Writing-review & editing, A.A , M.E.C, O.H., P.M., R.G. and S.G. ; Funding acquisition, A.A., M.E.C., and O.H.; Visualization A.A., P.M., R.G. and S.G.; Resources, M.E.C.; Supervision, M.E.C. and O.H.
Declaration of interests
The authors declare no competing interests.
Figure Legends
Figure 1. Nuclear shape is altered in the presence of hyperosmotic stress in WT
Arabidopsis root tips.
(A-B) Analysis of the nuclear shape in root tips by confocal microscopy of 9-day-old seedlings expressing SUN1-GFP in absence (A) or presence (B) of a 16h-long treatment with 0.3 M mannitol (Z max, optical sections of 0.7 µm). Representative images are presented. Scale bars are 5 µm.
(C-F) Quantification of various nuclear parameters were evaluated in 2D and 3D dimensions. Measurements were performed in the region delineated by the white frame in (A-B). In 2D, nuclear circularity (C) and nuclear area (E) were evaluated on control (n = 99) and treated (n = 98) plants. The p-values after Student's t-test are 3.23e-16 and 2.12e-11, indicating significant differences between the data, p < 0.001 (***). In 3D, nuclear sphericity (D) and volume (F) were evaluated on control and treated plants (n = 20). The p-values after Student's t-test are 0.0006 and 0.00012, respectively, indicating significant differences between the data
p < 0.001 (***).
(G-H) Cell volume (G) and nuclear/cell volume ratio (F) were also evaluated on the same samples used for 3D measurements. The p-values after Student's t-test are 0.193 and 0.0001, indicating non-significant differences in changes in cell volume between control and treated samples but a significant change in nuclear/cell volume (p < 0.001 , ***) related to main change of nuclear volume in response to hyperosmotic stress. See also Figure S1.
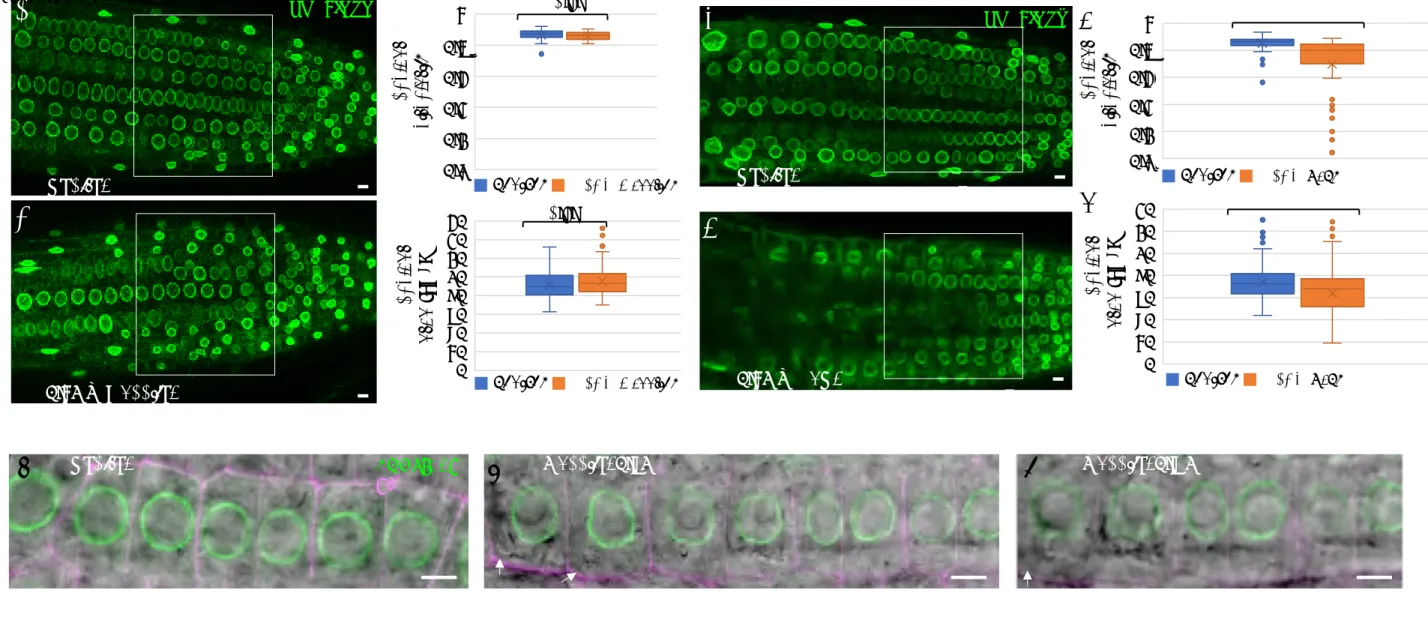
Figure 2: Nuclear shape defects are stable in the gip1gip2 Arabidopsis root tip upon hyperosmotic stress.
(B-C) Analysis of the nuclear shape in root tips by confocal microscopy (Z max, optical sections of 0.7 µm) in 9-day-old gip1gip2 seedlings expressing SUN1-GFP in absence (B, n = 74) or presence (C, n = 45) of a 16h-long treatment with 0.3 M mannitol. Scale bars are 5 µm. (D-E) Quantification of nuclear parameters, circularity (D) and nucleus area (E) were evaluated on control and treated plants. The p-values after Student's t-test are 0.11 and 0.87, respectively indicating no significant differences between the data (n.s.). Measurements were performed in the region delineated by the white frame in (B-C). See also Figure S2.
Figure 3. Resistance of gip1gip2 root tip cells to severe hyperosmotic conditions and analyses of nuclear shape and plant growth changes.
(A-B) Confocal analysis of root meristems of 9-day-old Arabidopsis expressing SUN1-GFP in presence of 0.4 M (A) and 0.6 M (B) mannitol stress (16h treatment) in WT seedlings (n = 8; n = 5; respectively) and mild gip1gip2 (n = 10). Dead cells were revealed upon propidium iodide staining (magenta). Scale bars are 5 µm.
(C-D) Quantification of nuclear parameters, the circularity (C) and the area (D) of the nuclei
were evaluated in WT in both mannitol treatments compared to control (n control = 38, n 0.4 M =
39 and n 0.6 M = 41). Between control/0.4 M and control/0.6 M p-values (Student’s t-test) are
2.903e-9, 1.515e-6 and 1.604e-10, 3.581e-10 respectively for each parameters indicating a
significant change between control and severe hyperosmotic conditions (p < 0.001, ***). No significant change (n.s.) was observed between nuclear parameters at 0.4 M and 0.6 M mannitol with p-values of 0.094 for nuclear circularity and 0.075 for nuclear area.
(E-F) Quantification of nuclear circularity (E) and area (F) of the nuclei in mild gip1gip2 in
both mannitol treatments compared to control (n control = 57 , n 0.4 M = 22, n 0.6 M = 43). Using
Student’s t-test no significant changes (n.s.) were observed between control/0.4 M or control/0.6 M with p-values of 0.329, 0.614 and 0.989, 0.534 for nuclear circularity and area, respectively, nor between 0.4 M and 0.6 M conditions with p-values of 0.195 and 0.617, respectively.
(G-I) Mild gip1gip2 phenotype compared to WT using 9-day-old seedlings transferred for 2 days on 0.4 M and 0.6 M mannitol as well as on control media. Main root growth was
evaluated through the measurement of root length on growth control conditions (n WT = 12, n
gip1gip2 = 10), 0.4 M mannitol (n WT = 13, n gip1gip2 = 10) and 0.6 M mannitol (n WT = 12; n gip1gip2 = 13). Using Mann Whitney test, different letters above the error bars indicate significant differences at p < 0.01. Three individual experiments were repeated. (H-I) Senescence in leaves of WT and gip1gip2 maintained on 0.4 M and 0.6 M mannitol for 15
days. Representative images are presented, on each figure, the left panel presents magnification of WT and gip1gip2 leaf rosettes, respectively. Scale bars are 0.2 cm.
(J-L) Mild and strong gip1gip2 phenotypes compared to WT using 9 day-old seedlings transferred to 0.3 M mannitol for 5 days. Every day, main root length was measured on control media :WT (n = 6), mild gip1gip2 (n = 7) and strong gip1gip2 (n = 6) and on 0.3 M mannitol :WT (n = 7), mild gip1gip2 (n = 6) and strong gip1gip2 (n = 7). Comparing mean values between control and treated samples using Mann Whitney test, no significant differences were found for mild and strong gip1gip2 phenotypes with p-values of 0.095 and 0.63, respectively while a p-value of 0.031 was found for WT ( p <0.05, *). Three individual experiments were repeated. See also Figure S3.
Figure 4: Hyperosmotic stress and gip1gip2 mutations stiffen the nuclei.
(A-D) Micro-rheometry on isolated nuclei. (A) An isolated nucleus (see, dashed red circle) is trapped between microplates, one rigid, the other flexible with calibrated stiffness using micro-rheometry measurement. The uniaxial nucleus deformation is under controlled applied forces. Fluorescence imaging of an isolated WT SUN1-GFP nucleus (green) stained with DAPI (left). Bright field imaging of the nucleus before (center) and after (right) compression between the two microplates: deformation occurred reflecting its low stiffness. (B) Fluorescence imaging of a gip1gip2 SUN1-GFP nucleus trapped (left) and compressed (right) in the micro-rheometer: almost no deformation occurred reflecting its high stiffness. Scale bars are 5 µm. (C) Principle of the micro-rheometry to measure nuclear stiffness. The force applied to the nucleus is F = kd, where d is the deflection of the flexible microplate of spring constant k. The elastic modulus was obtained by dividing the force F by the apparent contact area and relative nuclear shortening between the plates, i.e. nuclear strain. Comparison of the elastic moduli (kPa) between gip1gip2 (n = 17) and WT SUN1-GFP nuclei treated (n = 11) or not (n = 17) with 0.3 M mannitol, p-values from Mann-Whitney tests are WT/ WT treated: 0.0029 (significant p < 0.01); WT/gip1gip2: 0.000107 (significant p < 0.001); and WT treated/gip1gip2 : 0.643 (n.s.).
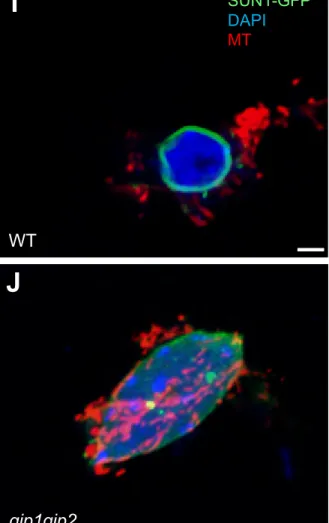
(E-J) AFM analysis of nuclei from root meristems. (E) Principle of the AFM to measure nuclear stiffness. (F-H) The AFM tip was positioned on a nucleus (GFP signal) isolated from root squashing after cell wall digestion of WT (F) and gip1gip2 (H) and the acquisition of a matrix of force curves (100 curves) was acquired for WT (G) and gip1gip2 nuclei (H, right inset).
moduli between WT (n = 14 nuclei in 3 independent roots) and gip1gip2 nuclei (n = 13 nuclei in 3 independent roots) p-values from Mann-Whitney test are 0.00288 (significant p < 0.01). See also Figure S4 and Video S1 and S2.
Figure 5: Transcriptomic analysis of gip1gip2 compared to WT.
(A) Vein diagram shows the overlap between up-regulated genes in gip1gip2 and the touch response in WT (Lee et al., 2005). R factor and p-value are indicated using the hypergeometric test.
(B) Relative transcript levels of 18 touch-induced genes (Figure S5E) in gip1gip2 compared to WT. RT qPCR were performed on RNA isolated from 9-day-old seedlings using specific primers, with 3 technical replicates and 3 biological replicates. SDs are indicated. See also Figure S5, Tables S1 and S2.
Figure 6. Relative mRNA level in response to hyperosmotic stress.
(A-B) Analysis of the relative mRNA levels of selected touch-induced genes in 9-day-old seedlings in presence of 0.3 M mannitol during 16h and after 7h of recovery (B) on normal growth medium compared to control (no treatment). RT qPCR were performed using RNA extracted from 9-day-old seedlings and specific primers, with 3 technical replicates and 3 biological replicates. SDs are indicated. See also Figure S6 and Table S2.
Figure 7. Changes of nuclear shape and elastic modulus are reversible upon hyperosmotic stress.
(A-B) Representative images of nuclei in root meristems. Nine-day-old WT SUN1-GFP seedlings from control and treated seedlings with 0.3 M mannitol for 16h are presented. (C-D) Representative images of nuclei in root meristems of control (C) and mannitol-treated seedlings (D) upon recovery on normal growth medium for 7 hours. Scale bars are 5 µm. (E-F) Quantification of nuclear parameters, circularity (E) and nuclear area (F) upon recovery on control and treated plants. The p-values after Student's t test are 0.73 and 0.56, respectively, indicating no significant changes between untreated and recovering samples (n.s.). Measurements were performed in the region delineated by the white frame in (C, D). (G-H) Evaluation of elastic modulus using AFM (G) on nuclei from squashed and lysed root meristem of seedlings treated with mannitol (n = 10) and upon recovery (n = 10) of a mannitol treatment compared to control (n = 7). Using Mann Whitney test p-values were : 0.027 between control and mannitol (*); 0.0004 between mannitol and recovery (**); 0.46 (n.s.) between control and recovery. Evaluation of elastic modulus using micro-rheometry on
isolated nuclei from seedlings treated with mannitol (n = 11) and upon recovery (n = 8) compared to control (n = 7) or seedlings treated with water (n = 5). Using Mann Whitney test,
p-values were : 0.005 between control and mannitol(**); 0.0045 between mannitol and
recovery (**); 0.778 (n.s.) between control and recovery; 0.265 (n.s.) between control and water. (I) Graphical abstract: Changes in nuclear shape and mechanics related to osmotic stress and touch gene expression. Implication of GIPs in plant growth sensitivity to hyperosmotic stress. See also Figure S7.
STAR METHODS
CONTACT FOR REAGENT AND RESOURCE SHARING
All plant lines are available for sharing. Further information for resources and reagents should
be forwarded and attended by the Lead Contact, Marie-Edith Chabouté (
EXPERIMENTAL MODEL AND SUBJECT DETAILS Plants
Wild type pSUN1::SUN1-GFP and gip1gip2 SUN1-GFP lines were described previously [34,38]. The gip1gip2 mutant [36] was investigated for transcriptomic analyses, using 2 types of phenotypes i.e. T12 (mild phenotype) and T34 (strong phenotype), as described in Figure S2. WT background of gip1gip2, i.e. Ws x Col-0, was used as a control. Seedlings were grown in vitro on 1/2 Murashige and Skoog (MS) medium (SERVA Electrophoresis) in presence of 1% sucrose and 1.2% agar at 20 °C under long day conditions (16-h light 70μmol/m2 per second of fluorescent lighting/8-h dark).
METHOD DETAILS
Osmotic stress conditions for nuclear properties analyses
For osmotic treatments, sterilized seeds were germinated on ½ MS medium and 9-day-old seedlings, were transferred in ½ MS liquid medium containing 0.3 M mannitol for 16h (hyperosmotic stress) or water (hypoosmotic stress). As a control, seedlings were transferred to ½ MS liquid medium.
Plant growth analysis under hyperosmotic stress conditions
Seedlings were grown for 9 days on ½ MS medium and then transferred to medium containing 0.3 M, 0.4 M and 0.6 M mannitol. Pictures of plates were taken before and after treatment either every day after treatment ( 0.3 M mannitol) or after 2 days of treatment (0.4 and 0.6 M mannitol). Root growth was evaluated using the segmented line measure tool plugin in ImajeJ using a line traced between 2 points.
Propidium iodide and DAPI staining on whole mount roots
Root meristem of 9-old seedlings were observed under confocal microscopy using 2µg/mL propidium iodide (Sigma Aldrich) which reveal cell wall in viable cells and enter into the cell when cell is dead. Chromatin staining was performed on SUN1-GFP seedlings by incubating the roots in FACS buffer containing DAPI (2µg/mL) for 10 min and roots were observed afterwards.
Nuclei preparation for micro-rheometry analysis
Nuclei were prepared by chopping root tips from 9-day-old seedlings in a Petri dish with a razor blade in 400 µl of ice-cold commercial nuclei isolation buffer containing DAPI (Cystein UV precise P, Sysmex Partec, Germany) and samples were filtered through a 30 µm mesh filters to remove debris. Nuclei were then concentrated in a pellet after a 5 min centrifugation 3000 rpm at 4°C. Pellet was either resuspended in culture medium with or without mannitol and kept on ice before micro-rheometry measurements.
Micro-rheometry measurement of nuclear stiffness
The experimental chamber was filled with medium containing nuclei. Isolated nucleus was captured between two parallel microplates, one rigid, the other flexible with a calibrated stiffness k. The force applied on the nucleus upon compression was given by F= k d, were d is the flexible plate deflection. All measurements were carried out with a flexible plate of spring constant k= 3.1 mN/m. The contact areas between the plates and the nucleus were estimated
by assuming a circular contact. The apparent contact diameters DF and DR (respectively for
the flexible and rigid plate) where then measured on bright field images. Then the stress σ
applied on the nucleus was defined as F/A, where A is the contact area, with A= D2.
However, since DF and DR was usually not exactly the same, leading to two different stress
values on the flexible and rigid plate, we retained their mean value σ = 2F/ [1/DF2+1/DR2].
The uniaxial nucleus strain perpendicular to plates was defined as ε = (L-L0)/L0, where L0 and
after compression. The nucleus was submitted to increasing compression steps, and the values of ε and σ were reported for each step. Stress-strain data σ(ε) were then fitted by a linear relationship the slope of which was retained as the value of the apparent elastic modulus E of the nucleus. The static apparent elastic modulus of the nucleus is then given by E= σ/ε. AFM – material and analyses
Roots from 9-day old seedlings were put on poly L-lysin plates and cell wall was digested in 100 µl of digestion mix (2.5 % pectinase, 2.5 % cellulase, 2.5 pectolyase in MTBS buffer as previously described [37]. Then root tip was squashed and covered by MTBS buffer to isolate the nuclei (50 mM Pipes, 5 mM EGTA, and 5 mM MgSO4, pH 6.9 in presence of 0.1% Triton X-100). Atomic force microscopy was performed using Bioscope catalyst (Bruker) which was coupled with an optical epifluorescence macroscope (MacroFluo-Leica) equipped with a long distance Mitutoyo 10x air objective lens. The PeakForce ® QNM (Quantitative Nanomechanical Mapping) mode was used for this study. The selected AFM cantilever had a theoretical spring constant of 0.4N/m and the pyramidal tip had a theoretical curvature radius <40nm. Before each experiment, the deflection sensitivity of the cantilever was calibrated on Sapphire and its spring constant was also calibrated by thermal tuning. A matrix of force
curves was acquired using the following parameters: Images: 100 µm2, 128px2, PeakForce
setpoint = 1-5nN, Force curves: Ramp size = 2-5 µm, applied force = 8-10nN. The quantifications of the elastic modulus based on raw force curves were achieved with the processing software Nanoscope Analysis (Bruker). Briefly, the quantification of the apparent elastic modulus (Ea) was extracted via the application of a theoretical model (Sneddon) for an indentation I < 100 nm. The measured elastic modulus reflected the stiffness of the nucleus. Each curve was analysed individually.
RNA extraction and sequencing
Total RNA was extracted from 9-day-old seedlings using Nucleospin RNA Plant kit (Macherey-Nagel, Düren, Germany) according to manufacturer’s instructions. For each preparation around 30 mg of frozen plant material was ground in extraction buffer in a Precelly 24 crusher (Bertin Technologie, Montigny-les-Bretonneux, France) for 2 x 30 s at 3600 rpm in presence of 0,75/1,0 mm glass beads. Purified RNAs were resuspended in 40 µl water. Quantity and quality of the extracted RNAs were determined using QuBit RNA HS assay kit (Thermo Fisher Scientific, Waltham, USA) and a Bioanalyser 2100 (Agilent Technologies, Santa Clara, USA), respectively. RNA Seq was done by Fasteris SA
(Plan-les-Ouates, Switzerland) on samples of 2 µg of RNA in 20 µl. The sequencing was performed on Illumina in 125bp on single end mode.
Transcriptomic data analysis
Raw reads were quality checked with FastQC (v0.10.1) and cleaned with cutadapt (v1.8.1). Mapping was performed against the Arabidopsis thaliana reference genome (from Araport11) using Hisat2 (v2.1.0) and the read counting was done using FeatureCounts (v1.6.2). Differential expression analysis and corresponding graphs were done using the DESeq2 package (v1.22.2). Finally the GO analysis was done with the latest version of the DAVID online tool.
RNA extraction and Real-Time RT-qPCR
Either whole 9-day-old seedlings or root tips from 9-day-old seedling were collected and snap-frozen in liquid nitrogen. For each experiment at least 3 independent biological replicates were used. Total RNA was extracted followig kit ‘NucleoSpin® RNA Plant, Macherey-Nagel’ protocol (Macherey-Nagel, Düren, Germany). For qRT-PCR, 2.5 μg of RNA was used to synthesize cDNA using random hexamer primers (IDT) and the protocol “SuperScript® IV (SSIV) First-strand and cDNA Synthesis Reaction” (Invitrogen). qRT-PCR was performed on Light Cycler thermocycler 480 II (Roche) with SYBR Green Master Mix (Bio-Rad). Primers used are described in in SI Table S1. The cDNA quantification was made with the ΔΔCt method, which considers the amplification efficiency ([1+E]- ΔΔCt) and normalized to ACTIN2 [53].
Confocal Microscopy
Confocal images were recorded with a Zeiss LSM 700 microscope equipped with 20×/0.8 NA lens. The excitation and emission wavelengths for the fluorescent protein GFP are 488 nm and 510 nm, respectively. For propidium iodide observations, the excitation and emission wavelengths were 555 nm and 617 nm, respectively. Images were captured using Z stacks with 0.7 µm Z slice intervals. For DAPI observations, the excitation and emission wavelengths were 405 nm and 500 nm. Observations were performed in multi-tracking mode using 405-, 488-, or 555-nm laser excitation.
QUANTIFICATION AND STATISTICAL ANALYSIS Nuclear parameters measurements
The confocal images were analysed using ImageJ. The nuclear circularity was measured using a Plugin NucSeg in ImajeJ developed by J. Mutterer (IBMP). The plugin gives a detailed analysis of several parameter of the nucleus including circularity with the formula, i.e.
Circularity = 4π × area/ perimeter2. A circularity of 1 corresponds to a perfect circle. Nuclear
volume and sphericity were evaluated using 3D manager and segmentation editor in Fiji (ImageJ). The volume of the 3D object is evaluated in calibrated unit, i. e. the number of voxels multiplied by the calibrated volume of one voxel. Compactness (sphericity) is the normalized ratio between the surface and the volume, it should be close to value 1 for a perfect sphere. Measurements were performed in the epidermal and cortex layers of the root,
i.e. in the tissues directly exposed to mannitol.
Statistical tests
The distribution of the data was evaluated using Shapiro-Wilk test to determine if they follow a normal law. Accordingly, we used either two tailed Student-t-test or Mann-Whitney test. The Student t-test was performed to study the significance of the difference between two populations for nuclear circularity and area data. The variances of the population in all the sets of data were tested using F-test. For low data number, Mann-Whitney test was used. Sample size and statistical tests are indicated in the figure captions.
DATA AND CODE AVAILABILITY
This work does not involve the production of large datasets and uses published plugins or image analysis tools.
Video S1: Nuclear deformation of a WT nucleus using micro-rheometry In our experimental conditions, nucleus was kept in control medium. A bright field microscopy imaging is presented. The rigid (bottom) plate is moved up thus compressing the nucleus against the flexible (top) plate which is deflected up like a regular spring.
Video S2: Nuclear deformation of a treated WT nucleus using micro-rheometry. In our experimental conditions, nucleus was kept in 0.3 M mannitol medium. A bright field microscopy imaging is presented.
University Press).
2. Discher, D.E., Janmey, P., and Wang, Y.L. (2005). Tissue cells feel and respond to the
stiffness of their substrate. Science. 310, 1139–1143.
3. Irianto, J., Swift, J., Martins, R.P., McPhail, G.D., Knight, M.M., Discher, D.E., and
Lee, D.A. (2013). Osmotic challenge drives rapid and reversible chromatin condensation in chondrocytes. Biophys J 104, 759–769.
4. Lovett, D.B., Shekhar, N., Nickerson, J.A., Roux, K.J., and Lele, T.P. (2013).
Modulation of Nuclear Shape by Substrate Rigidity. Cell Mol Bioeng 6, 230–238.
5. Uhler, C., and Shivashankar, G. V (2017). Regulation of genome organization and gene
expression by nuclear mechanotransduction. Nat. Rev. Mol. Cell Biol. 18, 717–727.
6. Miroshnikova, Y.A., Nava, M.M., Wickström, S.A., and Wickstrom, S.A. (2017).
Emerging roles of mechanical forces in chromatin regulation. J. Cell Sci. 130, 2243– 2250.
7. Cho, S., Irianto, J., and Discher, D.E. (2017). Mechanosensing by the nucleus: From
pathways to scaling relationships. J Cell Biol 216, 305–315.
8. Maharana, S., Iyer, V.K., Jain, N., Nagarajan, M., Wang, Y., and Shivashankar, G. V
(2016). Chromosome intermingling—the physical basis of chromosome organization in differentiated cells. Nucleic Acids Res. 44, 5148–5160.
9. Dupont, S., Morsut, L., Aragona, M., Enzo, E., Giulitti, S., Cordenonsi, M., Zanconato,
F., Le Digabel, J., Forcato, M., Bicciato, S., et al. (2011). Role of YAP/TAZ in mechanotransduction. Nature 474, 179–183.
10. Alam, S.G., Zhang, Q., Prasad, N., Li, Y., Chamala, S., Kuchibhotla, R., Kc, B.,
Aggarwal, V., Shrestha, S., Jones, A.L., et al. (2016). The mammalian LINC complex regulates genome transcriptional responses to substrate rigidity. Sci. Rep. 6, 38063.
11. Mammoto, A., Mammoto, T., and Ingber, D.E. (2012). Mechanosensitive mechanisms
in transcriptional regulation. J Cell Sci 125, 3061–3073.
12. Poh, Y.C., Shevtsov, S.P., Chowdhury, F., Wu, D.C., Na, S., Dundr, M., and Wang, N.
(2012). Dynamic force-induced direct dissociation of protein complexes in a nuclear body in living cells. Nat Commun 3, 866.
13. Tajik, A., Zhang, Y., Wei, F., Sun, J., Jia, Q., Zhou, W., Singh, R., Khanna, N.,
Belmont, A.S., and Wang, N. (2016). Transcription upregulation via force-induced direct stretching of chromatin. Nat Mater 15, 1287–1296.
14. Hampoelz, B., Azou-Gros, Y., Fabre, R., Markova, O., Puech, P.H., and Lecuit, T.
(2011). Microtubule-induced nuclear envelope fluctuations control chromatin dynamics in Drosophila embryos. Development 138, 3377–3386.
15. Elosegui-Artola, A., Andreu, I., Beedle, A.E.M., Lezamiz, A., Uroz, M., Kosmalska, A.J., Oria, R., Kechagia, J.Z., Rico-Lastres, P., Le Roux, A.L., et al. (2017). Force Triggers YAP Nuclear Entry by Regulating Transport across Nuclear Pores. Cell 171, 1397-1410 e14.
16. Kirby, T.J., and Lammerding, J. (2018). Emerging views of the nucleus as a cellular
mechanosensor. Nat Cell Biol 20, 373–381.
17. Stephens, A.D., Liu, P.Z., Kandula, V., Chen, H., Almassalha, L.M., Herman, C.,
Backman, V., O’Halloran, T., Adam, S.A., Goldman, R.D., et al. (2019). Physicochemical mechanotransduction alters nuclear shape and mechanics via heterochromatin formation. Mol. Biol. Cell. 17:2320-2330.
18. Alisafaei, F., Jokhun, D.S., Shivashankar, G. V, and Shenoy, V.B. (2019). Regulation
of nuclear architecture, mechanics, and nucleocytoplasmic shuttling of epigenetic factors by cell geometric constraints. Proc Natl Acad Sci U S A 16, 13200–13209.
19. Durand-Smet, P., Gauquelin, E., Chastrette, N., Boudaoud, A., and Asnacios, A.
(2017). Estimation of turgor pressure through comparison between single plant cell and pressurized shell mechanics. Phys Biol 14, 55002.
20. Asnacios, A., and Hamant, O. (2012). The mechanics behind cell polarity. Trends Cell
Biol. 22, 584-591.
21. Finan, J.D., and Guilak, F. (2010). The effects of osmotic stress on the structure and
function of the cell nucleus. J Cell Biochem 109, 460–467.
22. Xiong, L., Schumaker, K.S., and Zhu, J.K. (2002). Cell signaling during cold, drought,
and salt stress. Plant Cell 14 Suppl, S165-83.
23. Kim, J.M., Sasaki, T., Ueda, M., Sako, K., and Seki, M. (2015). Chromatin changes in
response to drought, salinity, heat, and cold stresses in plants. Front Plant Sci 6, 114.
24. Kreps, J.A., Wu, Y., Chang, H.S., Zhu, T., Wang, X., and Harper, J.F. (2002).
Transcriptome changes for Arabidopsis in response to salt, osmotic, and cold stress. Plant Physiol 130, 2129–2141.
25. Zeller, G., Henz, S.R., Widmer, C.K., Sachsenberg, T., Ratsch, G., Weigel, D., and
Laubinger, S. (2009). Stress-induced changes in the Arabidopsis thaliana transcriptome analyzed using whole-genome tiling arrays. Plant J 58, 1068–1082.
26. Lee, D., Polisensky, D.H., and Braam, J. (2005). Genome-wide identification of touch-
and darkness-regulated Arabidopsis genes: a focus on calmodulin-like and XTH genes. New Phytol 165, 429–444.
28. Coutand, C., Chevolot, M., Lacointe, A., Rowe, N., and Scotti, I. (2010). Mechanosensing of stem bending and its interspecific variability in five neotropical rainforest species. Ann Bot 105, 341–347.
29. Landrein, B., Kiss, A., Sassi, M., Chauvet, A., Das, P., Cortizo, M., Laufs, P., Takeda,
S., Aida, M., Traas, J., et al. (2015). Mechanical stress contributes to the expression of the STM homeobox gene in Arabidopsis shoot meristems. Elife 4, e07811.
30. Goto, C., Tamura, K., Fukao, Y., Shimada, T., and Hara-Nishimura, I. (2014). The
Novel Nuclear Envelope Protein KAKU4 Modulates Nuclear Morphology in Arabidopsis. Plant Cell 26, 2143–2155.
31. Pawar, V., Poulet, A., Detourne, G., Tatout, C., Vanrobays, E., Evans, D.E., and
Graumann, K. (2016). A novel family of plant nuclear envelope-associated proteins. J Exp Bot 67, 5699–5710.
32. Wang, H., Dittmer, T.A., and Richards, E.J. (2013). Arabidopsis CROWDED NUCLEI
(CRWN) proteins are required for nuclear size control and heterochromatin organization. BMC Plant Biol. 13, 200.
33. Dittmer, T.A., Stacey, N.J., Sugimoto-Shirasu, K., and Richards, E.J. (2007). LITTLE
NUCLEI Genes Affecting Nuclear Morphology in Arabidopsis thaliana. Plant Cell 19, 2793–2803.
34. Batzenschlager, M., Masoud, K., Janski, N., Houlne, G., Herzog, E., Evrard, J.L.,
Baumberger, N., Erhardt, M., Nomine, Y., Kieffer, B., et al. (2013). The GIP gamma-tubulin complex-associated proteins are involved in nuclear architecture in Arabidopsis thaliana. Front Plant Sci 4, 480.
35. Janski, N., Herzog, E., and Schmit, A.C. (2008). Identification of a novel small
Arabidopsis protein interacting with gamma-tubulin complex protein 3. Cell Biol Int
32, 546–548.
36. Janski, N., Masoud, K., Batzenschlager, M., Herzog, E., Evrard, J.L., Houlne, G.,
Bourge, M., Chaboute, M.E., and Schmit, A.C. (2012). The GCP3-interacting proteins GIP1 and GIP2 are required for gamma-tubulin complex protein localization, spindle integrity, and chromosomal stability. Plant Cell 24, 1171–1187.
37. Batzenschlager, M., Lermontova, I., Schubert, V., Fuchs, J., Berr, A., Koini, M.A.,
Houlne, G., Herzog, E., Rutten, T., Alioua, A., et al. (2015). Arabidopsis MZT1 homologs GIP1 and GIP2 are essential for centromere architecture. Proc Natl Acad Sci U S A 112, 8656–8660.
38. Graumann, K., Runions, J., and Evans, D.E. (2010). Characterization of SUN-domain
39. Versaevel, M., Grevesse, T., and Gabriele, S. (2012). Spatial coordination between cell and nuclear shape within micropatterned endothelial cells. Nat. Commun. 3, 671.
40. Desprat, N., Richert, A., Simeon, J., and Asnacios, A. (2005). Creep function of a
single living cell. Biophys J 88, 2224–2233.
41. Durand-Smet, P., Chastrette, N., Guiroy, A., Richert, A., Berne-Dedieu, A., Szecsi, J.,
Boudaoud, A., Frachisse, J.M., Bendahmane, M., Hamant, O., et al. (2014). A comparative mechanical analysis of plant and animal cells reveals convergence across kingdoms. Biophys J 107, 2237–2244.
42. Sewelam, N., Oshima, Y., Mitsuda, N., and Ohme-Takagi, M. (2014). A step towards
understanding plant responses to multiple environmental stresses: A genome-wide study. Plant, Cell Environ. 37, 2024-2035.
43. Gu, Y., Zebell, S.G., Liang, Z., Wang, S., Kang, B.H., and Dong, X. (2016). Nuclear
Pore Permeabilization Is a Convergent Signaling Event in Effector-Triggered Immunity. Cell 166, 1526-1538 e11.
44. Ghosh, R., Mishra, R.C., Choi, B., Kwon, Y.S., Bae, D.W., Park, S.-C.C., Jeong,
M.-J.J., and Bae, H. (2016). Exposure to Sound Vibrations Lead to Transcriptomic, Proteomic and Hormonal Changes in Arabidopsis. Sci. Rep. 6, 33370.
45. Fransz, P., De Jong, J.H., Lysak, M., Castiglione, M.R., and Schubert, I. (2002).
Interphase chromosomes in Arabidopsis are organized as well defined chromocenters from which euchromatin loops emanate. Proc Natl Acad Sci U S A 99, 14584–14589.
46. Isermann, P., and Lammerding, J. (2013). Nuclear mechanics and mechanotransduction
in health and disease. Curr. Biol. 23, 21.
47. Swift, J., Ivanovska, I.L., Buxboim, A., Harada, T., Dingal, P.C., Pinter, J., Pajerowski,
J.D., Spinler, K.R., Shin, J.W., Tewari, M., et al. (2013). Nuclear lamin-A scales with tissue stiffness and enhances matrix-directed differentiation. Science 341, 1240104.
48. Stephens, A.D., Banigan, E.J., and Marko, J.F. (2019). Chromatin’s physical properties
shape the nucleus and its functions. Curr Opin Cell Biol 58, 76–84.
49. Stephens, A.D., Banigan, E.J., Adam, S.A., Goldman, R.D., and Marko, J.F. (2017).
Chromatin and lamin A determine two different mechanical response regimes of the cell nucleus. Mol. Biol. Cell 28, 1984–1996.
50. Amat, R., Bottcher, R., Le Dily, F., Vidal, E., Quilez, J., Cuartero, Y., Beato, M., de
Nadal, E., and Posas, F. (2019). Rapid reversible changes in compartments and local chromatin organization revealed by hyperosmotic shock. Genome Res 29, 18–28.