HAL Id: hal-00784550
https://hal.inria.fr/hal-00784550
Submitted on 18 Nov 2013
HAL is a multi-disciplinary open access
archive for the deposit and dissemination of sci-entific research documents, whether they are pub-lished or not. The documents may come from teaching and research institutions in France or abroad, or from public or private research centers.
L’archive ouverte pluridisciplinaire HAL, est destinée au dépôt et à la diffusion de documents scientifiques de niveau recherche, publiés ou non, émanant des établissements d’enseignement et de recherche français ou étrangers, des laboratoires publics ou privés.
Role of the HAMP Domain Region of Sensory
Rhodopsin Transducers in Signal Transduction
Ivan Yu. Gushchin, Valentin I. Gordeliy, Sergei Grudinin
To cite this version:
Ivan Yu. Gushchin, Valentin I. Gordeliy, Sergei Grudinin. Role of the HAMP Domain Region of Sensory Rhodopsin Transducers in Signal Transduction. Biochemistry, American Chemical Society, 2010, 50 (4), pp.574-580. �10.1021/bi101032a�. �hal-00784550�
Role of the HAMP domain region of sensory rhodopsin
transducers in signal transduction†
†This work was supported by the program "Chaires d'excellence" edition 2008 of ANR France, CEA(IBS) – HGF(FZJ) STC 5.1 specific agreement, the MC grant for training and career development of researchers (Marie Curie, FP7-PEOPLE-2007-1-1-ITN, project SBMPs) and by an EC FP7 grant for the EDICT consortium (HEALTH-201924). This work was done in the framework of Russian State Contracts № 02.740.11.0299, № 02.740.11.5010 and №P974 in the framework of activity 1.2.2 of the Federal Target Program «Scientific and academic research cadres of innovative Russia» for 2009-2013 years.
Ivan Yu. Gushchin,‡ Valentin I. Gordeliy,‡#§ Sergei Grudinin,*^@
‡ Research-educational Centre “Bionanophysics”, Moscow Institute of Physics and Technology, 141700 Dolgoprudniy, Russia
# Laboratoire des Proteines Membranaires, Institut de Biologie Structurale J.-P. Ebel, UMR5075 CEA-CNRS-UJF, 38027 Grenoble, France
§ Institute of Structural Biology and Biophysics (ISB-2), Forschungszentrum Juelich, 52425 Juelich, Germany
^ NANO-D, INRIA Grenoble-Rhone-Alpes Research Center, 38334 Saint Ismier Cedex, Montbonnot, France
* To whom correspondence should be addressed. Phone: +33 4 76 61 53 24. Fax: +33 4 76 15 36 23. E-mail: sergei.grudinin@inria.fr
Running Title:
Role of the HAMP domain region
This document is the unedited Author’s version of a Submitted Work that was subsequently accepted for publication in Biochemistry, copyright © American Chemical Society after peer review. To access the final edited and published work see http://pubs.acs.org/doi/abs/10.1021/bi101032a
Abstract
Archaea are able to sense light via the complexes of sensory rhodopsins I and II and their corresponding chemoreceptor-like transducers HtrI and HtrII. Though generation of the signal has been studied in detail, mechanism of its propagation to the cytoplasm remains obscured. The cytoplasmic part of the transducer consists of adaptation and kinase activity modulating regions, connected to transmembrane helices via two HAMP (Histidine kinases, Adenylyl cyclases, Methyl binding proteins, Phosphatases) domains. The inter-HAMP region of Natronomonas pharaonis HtrII (NpHtrII) was found to be alpha-helical [Hayashi et al. (2007) Biochemistry 46, 14380–14390]. We studied the inter-HAMP regions of NpHtrII and other phototactic signal transducers by means of molecular dynamics. Their structure is found to be a bistable asymmetric coiled coil, in which the protomers are longitudinally shifted for about 1.3 Å. Free energy penalty for the symmetric structure is estimated to be 1.2-1.5 kcal/mol depending on the molarity of the solvent. Both flanking HAMP domains are mechanistically coupled to the inter-HAMP region, and are also asymmetric. The longitudinal shift in the inter-HAMP region is coupled with the in-plane displacement of the cytoplasmic part by 8.6 Å relative to the transmembrane part. The established properties suggest that 1) the signal may be transduced through the inter-HAMP domain switching; 2) the inter-HAMP region may enable cytoplasmic parts of the transducers to come close enough to form oligomers.
1 Abbreviations: HAMP domain, domain found in histidine kinases, adenylyl cyclases,
methyl-accepting chemotaxis proteins, and phosphatases; AS1 and AS2, the first and the second alpha-helices of the HAMP domain respectively; KC, kinase control module; Np, Natronomonas pharaonis; Hs,
Halobacterium Salinarum; SR, sensory rhodopsin; Htr, sensory rhodopsin transducer.
Archaea use light-sensing sensory rhodopsins (SR1) I and II as positive and negative photoreceptors to
move towards red light, which enables bacteriorhodopsin and halorhodopsin activity, and to avoid harmful near-UV light (1, 2). The signal from SR is relayed to the transducer protein (Htr), whose cytoplasmic tip forms a complex with CheA kinase and CheW adapter protein. CheA regulates phosphorylation of CheY, which controls the regime of rotation of the flagellar motor. Adaptation to a signal is regulated by proteins CheB and CheR, which are involved in adaptive methylation and demethylation of the transducers (3).
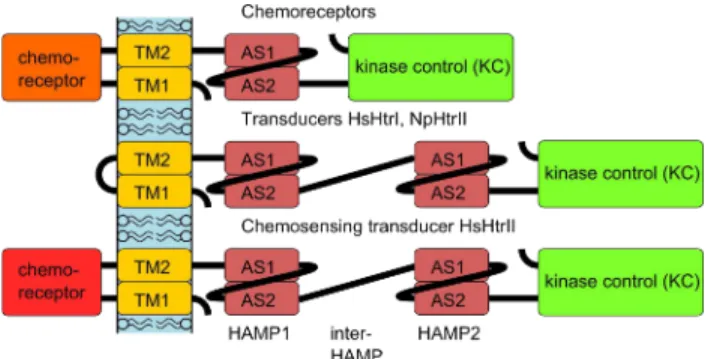
Sensory rhodopsins contain a covalently attached cofactor retinal and their structure resembles that of bacteriorhodopsin (1, 2). In the membrane, receptors form 2:2 complexes with transducer proteins Htr (I and II). Both HtrI and HtrII have domain organization similar to that of bacterial chemoreceptors (see Figure 1). Transducers have a short unstructured cytoplasmic C-terminus, followed by the transmembrane helix TM1, a chemotaxis receptor domain (only in HsHtrII), then another transmembrane helix TM2, two consecutive HAMP domains (4), separated by the inter-HAMP region, and the kinase control (KC) module with adaptational methylation sites. In opposite to Htr proteins, the chemotaxis proteins contain only one HAMP domain and no inter-HAMP region.
Crystallographic structure of NpSRII bound to transmembrane helices of NpHtrII (residues 23-82) is known for the ground, K- and M-states (5, 6). Structure of the HAMP domains is well represented by the NMR structure of the HAMP domain of Archeoglobus fulgidus hypothetical protein Af1503 (7, 8). NpHtrII fragment 100-159 was shown to be trypsin-resistant, with inter-HAMP region (residues 135-150) adopting an -helical structure (7, 9). Structure of the kinase control module of homologousα
Several models of signal transduction to the cytoplasmic domain were proposed. They include a piston-like motion, a motion in the membrane plane, or rotation of the transmembrane helices TM2 (3). There are crystallographic and cysteine-scanning mutagenesis evidences that in bacterial chemoreceptors the signal is conducted to the TM domain in a piston-like fashion (11, 12). For NpHtrII, rotation by 15° and in plane displacement by 0.9 Å of the membrane interface part of helix TM2 were observed by crystallography (5). A gearbox-like model for the HAMP domain signal transduction was proposed based on its NMR structure (8), but it is not backed up with any experimental evidence. Later on, a dynamic bundle model for HAMP domain function based on mutational experiments was proposed (13, 14). And finally, crystallographic structure of three consecutive HAMP domains of Pseudomonas aeruginosa soluble receptor Aer2 led to a model of interconversion between the two HAMP domain conformational states (15). For the inter-HAMP region of NpHtrII, the role of mechanical joint was proposed (9), though no details were described.
Since the structure of the transducer transmembrane part is known (6), the structure of the HAMP domains should be similar to that of Af1503 (8), and the generation of the signal in the transmembrane region upon photoexcitation is established (5), we focused our study on the HAMP domains’ region. First, we analyzed the sequences of the proteins and found that their inter-HAMP regions are predicted to have an -helical structure and adopt coiled-coil (CC) conformation. These coiled coils are uniqueα since their hydrophobic residues are alanines. Moreover, charged residues surrounding the hydrophobic core are organized in such a way that an asymmetric configuration of protomers is possible. We also performed molecular dynamics study of the NpHtrII inter-HAMP region. It shows a great instability of the symmetric conformation and spontaneous symmetry breaking with subsequent formation of an asymmetric configuration. As the primary structure of protomers is identical, two equally favorable asymmetric conformations are possible, which means that the inter-HAMP region may act as a switch that fixes the amplitude of the relative shift of the protomers, but not its sign. Finally, we studied the system of the two HAMP domains and the inter-HAMP region of NpHtrII by means of molecular dynamics. We found that the conventional structure model (8, 15) is applicable to these HAMP domains.
However, it is important to note that they are asymmetrical as a consequence of coupling to the asymmetrical inter-HAMP region.
Obtained data suggest that the inter-HAMP region may play a role of a switch or of a passive rigid mechanical joint between two HAMP domains.
Figure 1. Domain architecture of bacterial chemoreceptors (top), of the phototactic signal transducers HsHtrI and NpHtrII (middle), and of the transducer and chemoreceptor HsHtrII (bottom). TM1 and TM2 are the transmembrane helices, AS1 and AS2 are the helices of the HAMP domain. Chemoreceptor modules are in different colors as there is no sequence homology between them.
Materials and methods
Initial data and models
All sequences and domain assignments were taken from reviewed UniProt database (16) records P33741 (HsHtrI), Q9HP81 (HsHtrII) and P42259 (NpHtrII). Initial model for NpHtrII -helicalα fragment 135-150 was taken from the PDB entry 2RM8 (9). HAMP domain model for homology modeling was taken from the PDB entry 2ASW (8). Initial models of -helices for which no structureα was present were built using PyMOL (DeLano Scientific, Palo Alto, CA, USA.). For homology modeling of the NpHtrII HAMP domains MODELLER (17) was used. Some energy minimizations and structure manipulations in the dihedral subspace were performed using SAMSON symmetry module (18).
Molecular dynamics
All molecular dynamics simulations were conducted using NAMD2 program (19) with CHARMM27 parameters (20). Preparations of initial models and data analysis using our own tcl-scripts were performed in VMD (21). As a first step, hydrogen positions of a model in a vacuum were minimized for 50 standard NAMD minimization steps. This was followed by addition of a water box with a padding of 8 Å. Sodium and chloride ions were added in total concentrations of 0.5, 1, 2 or 4 M, accordingly, for different simulations, in such amounts that the system had zero total charge. Simulation in the water box was conducted with periodic boundary conditions. The water box was minimized for 50 steps and then was subjected to 1 ps of molecular dynamics, with protein atoms frozen. After that the whole system was minimized for 1000 steps and then heated to 310 K in steps of 10 K and 0.1 ps per step. Integration timestep was 2 fs, SHAKE algorithm was used to keep bonds between hydrogens and heavy atoms rigid. The temperature of 310 K was maintained with Langevin thermostat with the damping coefficient of 5 ps-1. The pressure of 1 bar was maintained with Langevin piston with parameters as follows: period
Additional information on the model preparation and stability may be found in Supporting Information (Table S1).
Longitudinal shift calculations
For each frame of the MD trajectory calculations were conducted as follows. First, direction of each helix was determined as the main axis of its inertia tensor, along which the moment of inertia is minimal. Second, the coiled coil axis was calculated as an average of directions of the two individual helices. And finally, the vector difference in positions of centers of mass of respective helices was projected on the coiled coil axis to obtain the relative shift of helices. For these calculations, only positions of the backbone atoms were used.
Free energy calculations
To determine the free energy of a system as a function of longitudinal shift we used the umbrella sampling technique (22) followed by either weighted histogram analysis method (WHAM) (23) or multiple Bennett acceptance ratio method (MBAR) (24). We used WHAM implementation by Alan Grossfield (http://membrane.urmc.rochester.edu/Software/WHAM/WHAM.html, version 2.04) and MBAR implementation by John Chodera and Michael Shirts (https://simtk.org/home/pymbar).
Sampling positions along the longitudinal shift were -2.1, -1.4, -0.7, 0, 0.7, 1.4, 2.1 Å with force constants of 10 kcal/(mol•Å) for each simulation. Shift values larger than 2.4 Å were not sampled as we believe that they are not realized in properly folded proteins. Free energy values for such shifts would also be affected by erroneous contributions from artificial exposition of hydrophobic surfaces at the ends of the inter-HAMP model. The system was modeled for at least 20 ns around each position. As the protomers are absolutely identical, the resulting free energy should also be symmetric as a function of the longitudinal shift. Thus, convergence was postulated if the energy difference between symmetrical positions (shifts of the same absolute value, but different signs) was less than 0.2 kcal/mol.
HAMP domain axis calculation
To calculate the HAMP domain axis, the directions of helices AS1 and AS2 of both protomers were averaged.
Protonation state of the ionizable residues
Based on the data describing the environmental pH (25) as well as the optimal pH for enzymes from halophilic archaea (26), we expect the inner-cell pH to be in the range of 7.0-9.0. To make the correct choice of protonation states of ionizable residues, their pKa values were predicted in corresponding
environments. Predictions were performed with MCCE2 multiconformation continuum electrostatics package (27).
In the NpHtrII HAMP domain region model (number 10 in Table S1 from Supporting Information), 98 residues in both protomers were treated as ionizable. Multiple conformers for these residues were built with the total number of conformers 5247. A conformer is defined as a heavy atoms rotamer of a certain side chain, in which protons are added, their positions optimized, and a certain ionization state is chosen. Many conformers were included into the prediction because conformer sampling improves the match between experiment and calculation for individual residues and dramatically diminishes the dependence on the starting structure (26). For our system, no residues were found to have the pKa value
in the range 7-11 (see Table S2 from Supporting Information). Therefore, all residues in the initial models of this simulation were left in their default protonation states.
We also studied the possibility of protonation-deprotonation events during the simulation of the NpHtrII inter-HAMP region. pKa values of the key rechargeable residues (D137, R142, D144) were predicted along the PMF trajectories. These residues, along with the non-rechargeable Q149, were subjected to extensive multiconformer trials, corresponding to different rotamers and ionization states. Conformers for other residues did not include side chain rotamers but only different ionization states. The total number of conformers was about 200-300 for different snapshots of the trajectory. Calculations were performed for the simulation at molarity 0,5 M, because at higher molarities pKa
shifts caused by solvation contributions would be even weaker, as follows from the Debye – Huckel theory of solvation. The total length of this simulation was 140 ns, snapshots were taken every 200 ps. Resulting pKa values, computed as a probability density function along the PMF trajectory, are given in
the supporting material (Figure S1). Briefly, for both D137 and D144 peaks of their distributions were shifted from the pKa value in solution 3.71 not more than by 0.1, with standard deviations of about 0.65
for D144, and 0.42 for D137. In case of R142 the peak of its pKa distribution is shifted from the pKa
value in solution 12.1 to 13.1 with the standard deviation of 0.4. No points were observed in the range of 7-11 pH. Therefore, the probability for the key residues to switch its default protonation state is negligibly small at physiological conditions (pH 7.0 – 9.0).
Results
Structure predictions for inter-HAMP regions
We used the PSIPRED protein structure prediction server (28) to analyze sequences of studied proteins. For all of them, an -helical structure is predicted with a high confidence for sequenceα fragments that consecutively include the helix AS2 of the first HAMP domain, the inter-HAMP region and the helix AS1 of the second HAMP domain. The same fragments are predicted to be in a coiled coil by the coiled coil prediction server (29) (Figure S2 of Supporting Information).
Model for inter-HAMP regions
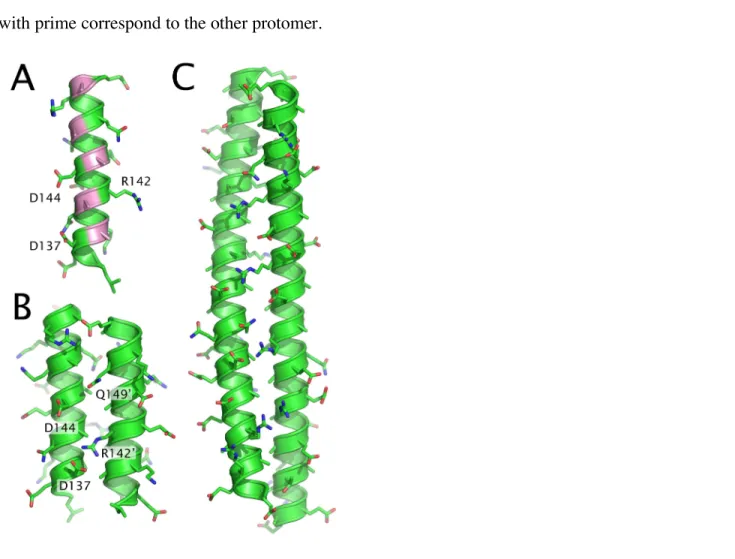
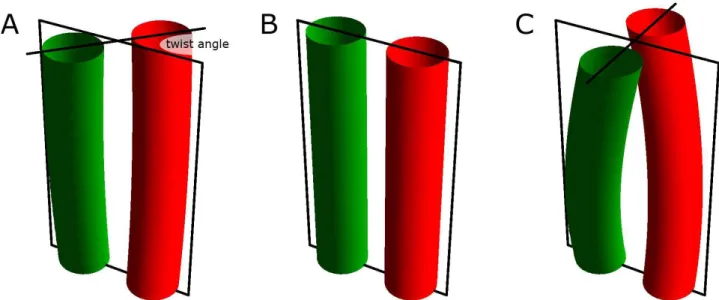
All inter-HAMP regions studied in this article have a pronounced continuous hydrophobic groove when modeled as an -helix (see that of NpHtrII for example on Figure 2A). Interestingly, this groove isα composed mostly of alanines. Two identical fragments, modeled as ideal -helices in PyMOL andα located to have the interface at the hydrophobic groove, form a coiled coil structure in time less than 100 ps for the short inter-HAMP region 135-153 of NpHtrII (Figure 2B), and less than 1 ns for the longer inter-HAMP regions 356-400 of HsHtrII (Figure 2C) and 106-150 of HsHtrI. After the coiled coil formation, the structure remains stable during the whole length of the simulation (see the Supporting Information Table S1 and Figures S6-S8 for additional information). In the longer inter-HAMP regions, deviations from the ideal -helical geometry are clearly seen, as is typical for coiled coils. The helicesα are bent around each other, with a total twist of 90° (Figure 2C). The twist is defined as the angle between projections of the lines, connecting the alpha-helices’ starts and ends, on the plane perpendicular to the coiled coil axis (see Figure S3 from Supporting Information for examples).
For all the modeled inter-HAMP regions, the homodimer adopts the asymmetric conformation, with a longitudinal shift of one protomer relative to the other of about 1 Å. The reason for this is most clear in the case of NpHtrII. Charged residues framing the hydrophobic core are distributed in such a way that the shifted conformation is preferred (Figure 2B). Namely, the positively charged R142’ may be electrostatically attracted either by the negatively charged D137 or by the negatively charged D144.
Simulations show that the conformation when R142’ attracted by both D137 and D144 is unstable. Attraction of R142’ in one protomer to D137 in the other leads to a longitudinal displacement, such that R142 comes closer to D144’, and vice versa. The resulting shift is additionally stabilized by short-living bonds between Q149’ and D144. Designations without prime correspond to one protomer, and those with prime correspond to the other protomer.
Figure 2. Proposed models for the HAMP region. (A) Hydrophobic groove of the NpHtrII inter-HAMP 135-153 fragment. Alanines are highlighted in pink. (B) Structure of a homodimer of the two NpHtrII inter-HAMP 135-153 regions. Note the asymmetric position of protomers and the differences in ionic bonds formed on each side of the structure. (C) Structure of a homodimer of the two HsHtrII inter-HAMP 356-400 regions. Positions of the protomers are also asymmetric. The structure presented in (A) is determined by NMR (9, PDB ID 2RM8), (B) and (C) are manually-built models, subjected to molecular dynamics.
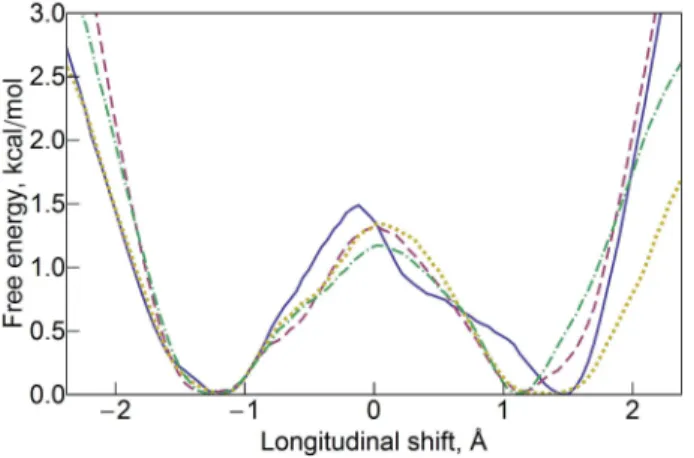
For a quantitative description of the inter-HAMP domain we calculated free-energy profiles for the longitudinal shift using umbrella sampling and weighted histogram analysis method (Figure 3, sampling distributions are presented in Figure S4 from Supporting Information). Energy minima are observed at about ±1.3 Å. The barrier height is slightly different for different molarities, namely 1.5 kcal/mol for 0.5 M, 1.4 kcal/mol for 1 M and 2 M and 1.2 kcal/mol for 4 M. These differences fall within the expected error of the method.
Figure 3. Free energy profiles for the relative longitudinal shift of the protomers in the inter-HAMP region (NpHtrII residues 135-153) at different molarities: 0.5 M (blue, solid), 1 M (magenta, dashed), 2 M (yellow, dotted) and 4 M (green, dot-dashed). Note that the minima are at about ±1.3 Å and the barrier height is 1.2-1.5 kcal/mol. For the sampling distributions and further information please see Figure S4 from Supporting Information.
We believe that the observed features are not artifacts of the calculation, as we used the standard forcefield (CHARMM27). There are no regions with a high induced electronic polarization in the inter-HAMP region, so effects of different forcefields on the obtained PMF profile were not addressed, as is sometimes done for free energy calculations of ion conduction through channels or for calculations of small ligand binding affinities. Weak variability of the free energy profile within the wide ion concetrations range also reflects robustness of the observed features.
To check for possible systematic errors introduced by WHAM, and to estimate statistical errors, we recalculated the free-energy profiles using multiple Bennett acceptance ratio method (MBAR) (24). This method gave similar results (see Figure S4 from Supporting Information for the corresponding graphs).
Therefore we conclude that the observed asymmetry is not a calculation artifact.
HAMP domains
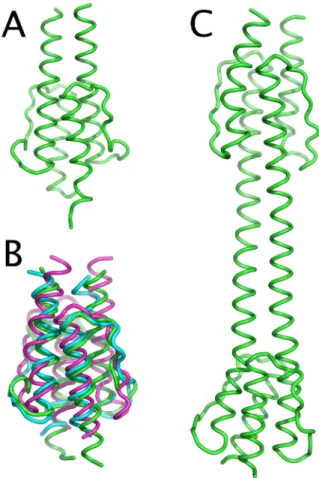
In order to check the correspondence of the NMR HAMP domain structure (8) to those of Htrs we modeled both HAMP domains of NpHtrII (residues 85 to 134 and 155 to 210 accordingly), along with the original HAMP domain of the putative protein Af1503 of Archaeoglobus fulgidus. Initial models generated by MODELLER were equilibrated for 4 ns and appeared to be very stable. NMR model (PDB 2ASW) of Af1503 HAMP domain, containing residues 276 to 331, was later expanded by residues 332-338 (aminoacid codes SLEEALK), modeled as an -helical continuation of AS2. These last sevenα residues of Af1503 were not included in the construct for NMR structure determination, but could somehow influence the structure of the HAMP domain. The resulting expanded structure was also stable for 8 ns. Average RMSD value for the backbone atoms during the simulations was 1.5 Å for the HAMP1 of NpHtrII, 1.7 Å for the HAMP2 of NpHtrII, 1.4 Å for Af1503 276-331 fragment and 1.6 Å for Af1503 276-331 fragment. A more extensive stability analysis is given in Supporting Information. Ribbon diagrams of the resulting structures are presented on figures 4A and 4B.
Figure 4. (A) Ribbon diagram of the Af1503 HAMP domain, expanded by the 7 terminal amino-acids, after 8 ns of molecular dynamics. (B) Overlay of the initial NMR structure of the Af1503 HAMP domain (in green) with homology-modeled structures of the first (blue) and second (purple) NpHtrII HAMP domains. (C) Proposed model for the NpHtrII HAMP domain region (residues 85-210), including both HAMP domains and the inter-HAMP region. Note the asymmetry between the protomers and the tilt of the HAMP domains’ axes relative to the axis of the inter-HAMP region.
Modeling of the HAMP domains with the inter-HAMP region
To check whether the structure of the HAMP domain is affected by the inter-HAMP region or vice versa, we performed molecular dynamics studies for two constructs. HAMP1 with the inter-HAMP region of NpHtrII (residues 85 to 153) were simulated for 10 ns, and HAMP1, the inter-HAMP and HAMP2 of NpHtrII (residues 85 to 210) were simulated for 60 ns. Though large structural movements are seen, they do not change the architecture of these constructs. Root mean square deviations for the whole NpHtrII HAMP domain region are presented in Figure 5. To calculate RMSDs, the last trajectory
snapshot was used as a reference structure. Only the backbone atoms were included in the calculation. An extensive stability analysis for this construct is given in Supporting Information (Table S1 and Figures S13-S17 from Supporting Information). Despite initial symmetrical conformation of the system, a relative longitudinal shift of corresponding alpha-helices develops after a few nanoseconds, and persists for the whole length of the simulation. As opposed to the zero twist angle of the inter-HAMP region alone, it equals to approximately 45° in the presence of the HAMP domains. The twist was defined above and explained in more detail on Figure S3 from Supporting Information. HAMP domains themselves retain their general conformations (Figures S16-S17 from Supporting Information). However, the shift imposed by the inter-HAMP region results in a reorientation of corresponding helices and renders HAMPs highly asymmetric (Figure 4C and Figures S16-S17 from Supporting Information). The relative position of the two HAMP domains changes considerably, though directions of the main axes of both HAMP domains coincide well with each other. The angle between HAMP1 and HAMP2 axes is 9±5°, as opposed to 13±4° for the angle between the HAMP1 and the inter-HAMP and 16±6° for the angle between the HAMP2 and the inter-HAMP.
Figure 5. Root mean square deviations for different parts of the NpHtrII HAMP domain region, simulated as a whole. Only the backbone atoms are included in the calculation. For each part the last trajectory snapshot was used as a reference structure. See the Supporting Information for more detail.
As we suppose that the transmembrane helices TM2 and TM2’ may continue in the HAMP1 helices AS1 and AS1’ without a kink (see a hypothetical model on Figure S5 from Supporting Information), we considered it interesting to analyze the motion of HAMP2 relative to the membrane plane and to the transmembrane segment of NpHtrII. For this purpose we calculated the probability density of the projection of the HAMP2 center of mass (COM) on the membrane plane relative to the HAMP1 COM (Figure 6, including a symmetrical image that corresponds to the longitudinal shift of the opposite value). Probability density distribution function was determined as the time which the projection of the second HAMP domain’ center of mass onto the membrane plane spent in a given 1 Å × 1 Å square, divided by the total simulation time. The distance between the projections of centers of mass of the two HAMP domains is 8.6±3.5 Å. This value is approximately equal to what follows from simple geometric considerations: the length of the inter-HAMP region is approximately 50 Å, the mean distance between centers of the helices is 9 Å, the mean longitudinal shift value is 1.3 Å and thus the in-plane displacement is about 7 Å (Figure 7C).
Figure 6. (A) Computed probability of finding the projection of the NpHtrII second HAMP domain center of mass on the membrane plane at the corresponding X, Y coordinates, in 1/Å2 units. View from
the cytoplasm. X axis is directed along the centers of mass of the HAMP1 AS1 helices, Y axis is perpendicular to it, and both axes lie in the membrane plane. The initial structure was symmetric, and the tilt and the longitudinal shift in the inter-HAMP region have developed later. Two regions with the highest probability correspond to the two possible signs of longitudinal shifts and are colored red and magenta, correspondingly, to guide the eye. (B) The same probability density distribution laid over the structure of NpSRII-NpHtrII 2:2 complex in a proper scale. PDB ID 1H2S (6).
Figure 7. Two possible roles of the HAMP domain region of phototactic signal transducers. Model of the sensory rhodopsin – transducer 2:2 complex is in yellow, with the protomers shown in different shades. Equivalent positions are marked on the inter-HAMP regions of the two protomers as black triangles to facilitate the perception of the longitudinal shift. (A) Change of the longitudinal shift sign results in a distinct conformation, in which the kinase control module (KC) is displaced on average by 8.6 Å × 2 ≈ 17 Å along the membrane plane (second conformation is in white). Thus, the signal may be transduced through the inter-HAMP switching. (B) Asymmetry of the HAMP domain region may facilitate the contacts with the adjacent transducers or receptors. Otherwise, these contacts would be impaired by bulky sensory rhodopsins, residing in the membrane. (C) Simple geometrical model of the conversion of the inter-HAMP longitudinal shift in the displacement of the transducer’s cytoplasmic part. Data presented are the mean values. 8.6 Å is the mean displacement of the second HAMP domain relative to the first one in the membrane plane. 50 Å is the approximate length of the inter-HAMP region. 9 Å is the approximate distance between the axes of the inter-HAMP helices. 1.3 Å is the mean longitudinal shift in the inter-HAMP region.
Discussion
Herein we have reported the model of the inter-HAMP region of sensory rhodopsin transducers. It is quite similar to the signaling helix (S Helix) (30) in that it continues AS2 of HAMP domain. The observed differences are as follows. First, at its C-terminus, the inter-HAMP region also ends with a HAMP domain helix (AS1). Second, a and d coiled coil positions are occupied by alanines in the inter-HAMP region, as opposed to bulky amino-acids of the S Helix. We expect that this may facilitate longitudinal motions of protomers along each other.
Molecular dynamics simulation shows that a symmetric conformation of the inter-HAMP domain is unfavorable. A longitudinal shift between the inter-HAMP protomers is observed. Since they are identical, a longitudinal shift of the same value but of the opposite sign is also possible. It means that the inter-HAMP is bistable. The energetic barrier between the two states is high enough to prevent frequent switching by thermal fluctuations, but it is much lower than 60 kcal/mol – the average energy of the photons, absorbed by sensory rhodopsins. An asymmetric conformation of the inter-HAMP region persists when the HAMP domains are also included in the simulation. We suggest that this is biologically relevant. It is important to note that the asymmetry of the inter-HAMP region is coupled with the asymmetry of the HAMP domains.
The established properties of the inter-HAMP region may have direct implications for understanding of the signal propagation through the cytoplasmic part of the transducers. As the inter-HAMP -helicesα constitute a coiled coil and are always turned to each other by their hydrophobic groove, signaling through the changes in the inter-helical angle as supposed in (8) is questionable. We suggest that the probable mechanism of the signal transduction may involve either switching of the inter-HAMP region or some rigid body motion of the cytoplasmic part without any changes in the inter-HAMP state (Figure 7). Switching might result in a large structural rearrangement (Figure 7A), and thus could be prohibited by tight hexagonal packing of KC fragments. Signal encoding by a displacement of the whole
cytoplasmic part of the transducer, i.e. by a position of the HAMP2 relative to the HAMP1, in its turn would be affected by very large fluctuations (Figures 6A and 6B).
As we have noted, asymmetry of the inter-HAMP is enforced by electrostatic interactions of oppositely charged side-chains of corresponding residues. Flexibility of those side chains allows some longitudinal displacements (up to zero shift) without breaking the formed electrostatic bonds. Thus, the evolution of the system with time may be different depending on which bonds are formed, that is, the history of the system. This means that the inter-HAMP region is in effect a multistate switch. It is worth to mention that a study of the HAMP domain alone would not provide sufficient information about the signal transduction.
Conclusion
We built a model of the inter-HAMP region and of the flanking HAMP domains, and studied its structure and properties via molecular dynamics. It was found that the Htr inter-HAMP region forms a coiled coil. The structure is asymmetric, as there is a longitudinal shift of protomers of about 1.3 Å. HAMP domains are mechanistically coupled to the inter-HAMP region, and are also asymmetric. Taking all described features into consideration, we propose the following functions for the inter-HAMP regions. First, they impose initially asymmetric conformation on the Htr dimer, which may help to bring kinase control fragments close enough to come in contact (in membranes the Htr dimer is surrounded by two sensory rhodopsins, and thus Htr dimer centers are separated by at least 30 Å (6) – see figure 6B). Second, they may act as a switch, which needs no signal input to maintain its state but changes its output upon receiving a proper signal.
Acknowledgment
I.G. is thankful to Institut de Biologie Structurale J.-P. Ebel, Grenoble, and to Institute of Structural Biology and Biophysics (ISB-2), Forschungszentrum Jülich, for providing excellent conditions for his work during his visits.
Supporting information available
Full description of the molecular models presented in this study, graph of the pKa distribution of the
important NpHtrII inter-HAMP ionizable residues, sequence alignment of the HAMP domain regions, secondary structure and coiled coil prediction data for HsHtrI, HsHtrII and NpHtrII, figure explaining the definition of the twist angle, separate NpHtrII inter-HAMP domain PMF plots with error bars and umbrella-sampling distribution histograms, the hypothetical model of the junction between the NpHtrII HAMP domain and its trans-membrane segment, RMSD graphs for all the HAMP domains and the inter-HAMP region modeled in this study, packing analysis of the NpHtrII HAMP domains as a part of the HAMP domain region, table of the pKa values of ionizable residues in the NpHtrII HAMP domain
References
1. Klare, J., Chizhov, I., and Engelhard, M. (2008) Microbial Rhodopsins: Scaffolds for Ion Pumps, Channels, and Sensors, in Bioenergetics, pp 73-122, IRL Press at Oxford University Press, Oxford.
2. Sasaki, J., and Spudich, J. L. (2008) Signal Transfer in Haloarchaeal Sensory Rhodopsin-Transducer Complexes, Photochem. Photobiol. 84, 863-868.
3. Hazelbauer, G. L., Falke, J. J., and Parkinson, J. S. (2008) Bacterial chemoreceptors: high-performance signaling in networked arrays, Trends Biochem. Sci. 33, 9-19.
4. Aravind, L., and Ponting, C. P. (1999) The cytoplasmic helical linker domain of receptor histidine kinase and methyl-accepting proteins is common to many prokaryotic signalling proteins, FEMS Microbiol. Lett. 176, 111-116.
5. Moukhametzianov, R., Klare, J. P., Efremov, R., Baeken, C., Goppner, A., Labahn, J., Engelhard, M., Büldt, G., and Gordeliy, V. I. (2006) Development of the signal in sensory rhodopsin and its transfer to the cognate transducer, Nature 440, 115-119.
6. Gordeliy, V. I., Labahn, J., Moukhametzianov, R., Efremov, R., Granzin, J., Schlesinger, R., Büldt, G., Savopol, T., Scheidig, A. J., Klare, J. P., and Engelhard, M. (2002) Molecular basis of transmembrane signalling by sensory rhodopsin II-transducer complex, Nature 419, 484-487.
7. Etzkorn, M., Seidel, K., Li, L., Martell, S., Geyer, M., Engelhard, M., and Baldus, M. (2010) Complex Formation and Light Activation in Membrane-Embedded Sensory Rhodopsin II as Seen by Solid-State NMR Spectroscopy, Structure 18, 293-300.
8. Hulko, M., Berndt, F., Gruber, M., Linder, J. U., Truffault, V., Schultz, A., Martin, J., Schultz, J. E., Lupas, A. N., and Coles, M. (2006) The HAMP Domain Structure Implies Helix Rotation in Transmembrane Signaling, Cell 126, 929-940.
9. Hayashi, K., Sudo, Y., Jee, J., Mishima, M., Hara, H., Kamo, N., and Kojima, C. (2007) Structural Analysis of the Phototactic Transducer Protein HtrII Linker Region from Natronomonas
pharaonis, Biochemistry 46, 14380-14390.
10. Kim, K. K., Yokota, H., and Kim, S. (1999) Four-helical-bundle structure of the cytoplasmic domain of a serine chemotaxis receptor, Nature 400, 787-792.
11. Chervitz, S. A., and Falke, J. J. (1996) Molecular mechanism of transmembrane signaling by the aspartate receptor: a model, Proc. Natl. Acad. Sci. U.S.A. 93, 2545-2550.
12. Falke, J. J., and Erbse, A. H. (2009) The Piston Rises Again, Structure 17, 1149-1151.
13. Ames, P., Zhou, Q., and Parkinson, J. S. (2008) Mutational Analysis of the Connector Segment in the HAMP Domain of Tsr, the Escherichia coli Serine Chemoreceptor, J. Bacteriol. 190, 6676-6685.
14. Zhou, Q., Ames, P., and Parkinson, J. S. (2009) Mutational Analyses of HAMP Helices Suggest a Dynamic Bundle Model of Input-Output Signaling in Chemoreceptors, Mol. Microbiol. 73, 801-814.
15. Airola, M. V., Watts, K. J., Bilwes, A. M., and Crane, B. R. (2010) Structure of Concatenated HAMP Domains Provides a Mechanism for Signal Transduction, Structure 18, 436-448.
16. The UniProt Consortium. (2010) The Universal Protein Resource (UniProt) in 2010, Nucleic Acids Res. 38, D142-148.
17. Sali, A., and Blundell, T. L. (1993) Comparative protein modelling by satisfaction of spatial restraints, J. Mol. Biol. 234, 779-815.
18. Grudinin, S., and Redon, S. (2010) Practical modeling of molecular systems with symmetries, J. Comput. Chem. 31, 1799-1814.
19. Phillips, J. C., Braun, R., Wang, W., Gumbart, J., Tajkhorshid, E., Villa, E., Chipot, C., Skeel, R. D., Kale, L., and Schulten, K. (2005) Scalable molecular dynamics with NAMD, J. Comput. Chem. 26, 1781-1802.
20. MacKerell, Bashford, D., Bellott, Dunbrack, Evanseck, J. D., Field, M. J., Fischer, S., Gao, J., Guo, H., Ha, S., Joseph-McCarthy, D., Kuchnir, L., Kuczera, K., Lau, F. T. K., Mattos, C., Michnick, S., Ngo, T., Nguyen, D. T., Prodhom, B., Reiher, W. E., Roux, B., Schlenkrich, M., Smith, J. C., Stote, R., Straub, J., Watanabe, M., Wiorkiewicz-Kuczera, J., Yin, D., and Karplus, M. (1998) All-Atom Empirical Potential for Molecular Modeling and Dynamics Studies of Proteins, J. Phys. Chem. B 102, 3586-3616.
21. Humphrey, W., Dalke, A., and Schulten, K. (1996) VMD Visual molecular dynamics, J. Mol. Graphics 14, 33-38.
22. Frenkel, D., and Smit, B. (2002) Understanding molecular simulation: from algorithms to applications, Academic Press, New York.
23. Kumar, S., Rosenberg, J. M., Bouzida, D., Swendsen, R. H., and Kollman, P. A. (2004) Multidimensional free-energy calculations using the weighted histogram analysis method, J. Comput. Chem. 16, 1339–1350.
24. Shirts, M. R. and Chodera, J. D. (2008), Statistically optimal analysis of samples from multiple equilibrium states, J. Chem. Phys. 129, 124105.
25. Falb, M., Pfeiffer, F., Palm, P., Rodewald, K., Hickmann, V., Tittor, J., and Oesterhelt, D. (2005) Living with two extremes: Conclusions from the genome sequence of Natronomonas pharaonis, Genome Res. 15, 1336–1343.
26. Cao, Y., Liao, L., Xu, X. W., Oren, A., and Wu, M. (2008) Aldehyde dehydrogenase of the haloalkaliphilic archaeon Natronomonas pharaonis and its function in ethanol metabolism, Extremophiles 12, 849–854.
27. Song, Y., Mao, J., and Gunner, M. R. (2009) MCCE2: Improving protein pKa calculations with
extensive side chain rotamer sampling, J. Comput. Chem. 30, 2231–2247.
28. McGuffin, L. J., Bryson, K., and Jones, D. T. (2000) The PSIPRED protein structure prediction server, Bioinformatics 16, 404-405.
29. Lupas, A., Van Dyke, M., and Stock, J. (1991) Predicting coiled coils from protein sequences, Science 252, 1162-1164.
30. Anantharaman, V., Balaji, S., and Aravind, L. (2006) The signaling helix: a common functional theme in diverse signaling proteins, Biol. Direct 1, 25.
Role of the HAMP domain region of sensory
rhodopsin transducers in signal transduction
Supporting Information
Content:
Table S1. Description of molecular models.
Figure S1. Graph of the pKa values’ distributions of the important NpHtrII inter-HAMP
rechargeable residues.
Figure S2. Sequence alignment of the HAMP domain regions of archaeal phototactic signal transducers.
Figure S3. Definition of the twist angle in the inter-HAMP region.
Figure S4. NpHtrII inter-HAMP domain PMF plots with umbrella-sampling distribution histograms.
Figure S5. Hypothetical junction between the HAMP domain and trans-membrane segment. Figure S6. Structure stability of the NpHtrII inter-HAMP region.
Figure S7. Structure stability of the HsHtrII inter-HAMP region. Figure S8. Structure stability of the HsHtrI inter-HAMP region. Figure S9. Structure stability of the Af1503 HAMP domain.
Figure S10. Structure stability of the Af1503 extended HAMP domain.
Figure S11. Structure stability of the NpHtrII HAMP1 domain modeled alone. Figure S12. Structure stability of the NpHtrII HAMP2 domain modeled alone.
Figure S13. Structure stability of the NpHtrII HAMP1 domain as a part of the HAMP domain region.
Figure S14. Structure stability of the NpHtrII inter-HAMP region as a part of the HAMP domain region.
Figure S15. Structure stability of the NpHtrII HAMP2 domain as a part of the HAMP domain region.
Figures S16-S17. Analysis of the packing in the NpHtrII HAMP domains.
Table S1. Description of molecular models. Model name (numbers of residues included in the simulation are in parenthesis) Preparation of initial model Simulation Time
Structure stability Residue packing
conservation
1. NpHtrII inter-HAMP region (135-153)
Two ideal helices of the corresponding aminoacid sequence were built in PyMOL and then manually positioned to face each other with hydrophobic groove and approximately zero longitudinal shift. All residues are in default protonation states at neutral pH.
10 ns See Supporting Figure S6
for the RMSD data. The system samples a variety of conformational states and longitudinal shifts of up to 2 Å in both directions. This is extensively discussed in the main text of the article.
See Supporting Figure S6 for the RMSD data. Alpha-helical structure is unchanged during the whole simulation. Hydrophobic grooves of the coiling helices remain turned to each other. Thus the packing is maintained.
2. NpHtrII inter-HAMP region (135-153) PMF calculation
Resulting model of the simulation 1 was taken.
For each of the 4 tried molarities (0.5, 1.0, 2.0 and 4.0 M) 7 trajectories of 20 ns
The same as for the model 1.
The same as for the model 1.
3. HsHtrII inter-HAMP region (356-400)
Two ideal helices of the corresponding aminoacid sequence were built in PyMOL and then manually positioned to face each other with hydrophobic groove and approximately zero longitudinal shift. All residues are in default protonation states at neutral pH.
25 ns See Supporting Figure S7
for the RMSD data for the longest trajectory. Ideal helices, prepared at the beginning, connect with their hydrophobic grooves and bend slightly in approximately 1 ns, with the development of longitudinal shift.
The same as for the model 1. See Supporting Figure S7 for the RMSD data.
4. HsHtrI inter-HAMP region (106-150)
The same as for the model 3.
28 ns The same as for the model
3, although the structure is somewhat more flexible. See Supporting Figure S8 for the RMSD data.
The same as for the model 1.See Supporting Figure S8 for the RMSD data.
5. Af1503 HAMP domain (276-331)
NMR structure (PDB 2ASW) was taken as a starting model, with all residues in default protonation states at neutral pH.
4 ns See Supporting Figure S9
for the RMSD data.
See Supporting Figure S9 for the RMSD data. Core residues RMSD values (calculated for the heavy atoms) do not generally exceed 2 Å and thus, their positions are not
substantially changing during the course of the simulation, and the packing is maintained.
6. Af1503 expanded HAMP domain (276-338)
Resulting model of the simulation 5 was extended with the residues 332-338, manually built in the ideal helical conformation to continue AS2 helices.
8 ns See Supporting Figure
S10 for the RMSD data.
See Supporting Figure S10 for the RMSD data. Core residues RMSD values (calculated for the heavy atoms) do not generally exceed 2 Å and thus, their positions are not substantially changing during the course of the simulation, and the packing is maintained. 7. NpHtrII first
HAMP domain (85-134)
Homology model was built using MODELLER, based on the NMR structure of Af1503 HAMP domain (PDB 2ASW). All residues are in default protonation states at neutral pH.
4 ns See Supporting Figure
S11 for the RMSD data.
See Supporting Figure S11 for the RMSD data. Core residues RMSD values (calculated for the heavy atoms) do not generally exceed 2 Å and thus, their positions are not substantially changing during the course of the simulation, and the packing is maintained. 8. NpHtrII second
HAMP domain (155-210)
The same as for the model 7.
4 ns See Supporting Figure
S12 for the RMSD data.
See Supporting Figure S12 for the RMSD data. Core residues RMSD values (calculated for the heavy atoms) do not generally exceed 2 Å and thus, their positions are not substantially changing during the course of the simulation, and the packing is maintained. 9. NpHtrII first
HAMP domain and inter-HAMP fragment (85-153)
Resulting models of the simulations 1 and 7 were combined and minimized. All residues are in default protonation states at neutral pH.
10 ns No analysis was made, as
this structure is a part of the model 10 and analyzed there.
No analysis was made, as this structure is a part of the model 10 and analyzed there.
10. NpHtrII HAMP domain region – both HAMP domains and the inter-HAMP fragment (85-210)
Resulting models of the simulations 1, 7, and 8 were combined and minimized. All residues are in default protonation states at neutral pH. Model was symmetrized prior to the simulation.
60 ns The system is quite
flexible, which is extensively discussed in the main text of the article. Nonetheless, both HAMP domains and the inter-HAMP region retain their general fold.
See Supporting Figure S13 for the RMSD data of the first HAMP domain, Supporting Figure S14 for the RMSD data of the inter-HAMP region and Supporting Figure S15 for the RMSD data of the second HAMP domain.
See Supporting Figures S13, S14 and S15 for the RMSD data on the HAMP domain residues and Figures S16 and S17 for the structures and double-distance matrices of the HAMP domains. Core residues RMSD values (calculated for the heavy atoms) do not generally exceed 2 Å and thus, their positions are not substantially changing during the course of the simulation, and the packing is maintained.
Figure S1. Distributions of pKa values of the important ionizable aminoacids D137 (blue, solid),
R142 (magenta, dashed) and D144 (blue, dotted) computed along the PMF molecular dynamics trajectories of the NpHtrII inter-HAMP region at 0.5 M molarity. Distributions were calculated using MCCE2 program (see the main text for additional details). Snapshots for pKa calculations
were taken each 200 ps. The total length of the trajectory was 140 ns. Distributions are averaged over two protomers.
Figure S2. Alignment of NpHtrII, HsHtrI and HsHtrII sequences with prediction results. Predicted HAMP domains are shaded grey. Note that the regions comprising AS2 of the first HAMP domain, inter-HAMP and AS1 of the second HAMP domain are predicted with a high probability to be in the coiled coil
Figure S3. Definition of the twist angle in the inter-HAMP region. (A) Twist is defined as the angle between projections of the lines that connect the alpha-helices’ starts and ends, on the plane
Molarity 0.5 M Molarity 1.0 M
Molarity 2.0 M Molarity 4.0 M
Figure S4. Potentials of mean force (PMFs) of the NpHtrII inter-HAMP domain at different salt concentrations. PMFs were calculated using weighted histogram analysis method (WHAM) and multiple Bennett acceptance ratio (MBAR) method. Results obtained by different methods correspond well. Umrella sampling distributions are shown in grey.
Figure S5. A hypothetical model of the junction between the HAMP domain and the trans-membrane segment of NpHtrII (in magenta), aligned to the known structures. Crystallographic structure of the NpSRII with NpHtrII transmembrane part (residues 23-82, PDB 1H2S) is shown in yellow, NMR structure of the Af1503 HAMP domain (PDB 2ASW) is shown in blue. Labels are shown for the NpHtrII trans-membrane helices TM1 and TM2 and the HAMP domain helices AS1 and AS2. Approximate position of the cell membrane is shaded gray. This model illustrates the theoretical possibility of how the TM2 and AS1 can form a continuous helix without a kink. The model of the junction was prepared by minimization of the crystallographic transmembrane part attached to homology modeled structure of the HAMP1 domain using SAMSON program with CHARMM19 forcefield. The region of the junction was subjected to alpha-helical restraints. No steric clashes are observed in the model. No studies were conducted on the stability of such
Figures S6-S15. Structure stability of the simulated models.
The left graph shows an unaveraged protein backbone atoms’ RMSD as a function of time, with the last trajectory’s snapshot as a reference. It is seen that the starting equilibration is followed by normalization, during which the RMSD value is practically unchanged and corresponds to the thermal fluctuations. The magnitude of the thermal fluctuations is as expected for typical soluble proteins.
The central graph shows, which RMSD is to be expected for the snapshots separated by the time τ, and thus reflects the dynamical properties of the corresponding construct. It is calculated as follows:
and RMSD(i,i+n) denotes RMSD between the frames i and i+n. The timestep used in the
calculation is 50 ps. RMSD values are calculated for the backbone atoms, and the alignment was also performed using the backbone atoms. RMSD values at the maximum time separations (last 10-20% of the trajectory) may be misleading, as they were obtained by averaging of few data points. These values are also typically higher compared to the rest of the graph, because they represent mostly the difference between the initial unrelaxed structure and the final equilibrated one.
The right graph shows the RMSD for each residue, measured to the last trajectory’s snapshot as a reference and averaged over the whole trajectory. The alignment of the corresponding structure snapshots was done using all the protein’s backbone atoms. Data for both protomers are shown, with RMSD values for all heavy atoms in magenta and blue, and backbone atoms in green and yellow. Regions corresponding to the residues in alpha-helical structure are shaded gray. Large RMSD values (>4 Å) for some sidechains usually correspond to exposed arginines.
Please note:
a) the alternate pattern of the all-atoms RMSD (blue and magenta) corresponds to the buried (lesser mobility) and exposed (higher mobility) sidechains. All the backbone atoms have similar RMSD. b) the mobility of residues in the HAMP domain linker is increased compared to the helical regions. c) the ends of the polypeptide chain have an increased mobility due to the truncation artifacts. In the full-length native constructs we expect these residues to be more confined.
Figure S6. Structure stability of the NpHtrII inter-HAMP region (model 1 in Table S1).
Figure S7. Structure stability of the HsHtrII inter-HAMP region (model 3 in Table S1).
Figure S9. Structure stability of the Af1503 HAMP domain (model 5 in Table S1).
Figure S10. Structure stability of the Af1503 extended HAMP domain (model 6 in Table S1).
Figure S11. Structure stability of the NpHtrII HAMP1 domain simulated alone (model 7 in Table S1).
Figure S12. Structure stability of the NpHtrII HAMP2 domain simulated alone (model 8 in Table S1).
Figures S13-S15 refer to the stability of the parts of the HAMP domain region simulated as a whole (model 10 in Table S1). The structure was initially prepared as symmetric to avoid a bias in the simulation. The asymmetry has developed during the course of the modeling.
Figure S13. Structure stability of the NpHtrII HAMP1 domain as a part of the whole HAMP domain region (model 10 in Table S1).
Figure S14. Structure stability of the NpHtrII inter-HAMP region as a part of the whole HAMP domain region (model 10 in Table S1).
Figure S15. Structure stability of the NpHtrII HAMP2 domain as a part of the whole HAMP domain region (model 10 in Table S1).
Figures S16-S17. Analysis of the packing in the NpHtrII HAMP domains simulated as a part of the HAMP domain region. These figures highlight their asymmetry, induced by the adjacent inter-HAMP region. Asymmetry is prominent in the relative positions of the helices AS2 and AS2’ of the HAMP1, and AS1 and AS1’ of the HAMP2, meanwhile helices AS1 and AS1’ of the HAMP1 are roughly symmetric, as are AS1 and AS1’ of the HAMP2. Asymmetry is most easily deducted by analysis of the double distance matrices. Absence of asymmetry at the ends of the HAMP domain region (helices AS1 and AS1’ of the HAMP1 and AS2 and AS2’ of the HAMP2) may be artificial and result from the absence of the NpHtrII membrane and cytoplasmic parts.
Figure S16. Packing changes in the NpHtrII first HAMP domain when simulated as a part of a larger construct (HAMP1 - inter-HAMP - HAMP2). (A), (B) and (C) Superposition of the symmetrical structure (green tube) and the trajectory snapshots, taken each 2 ns (black ribbon). (A) and (C) are the side-views, meanwhile (B) is a view from the inter-HAMP region. (D) Double-distance matrix of the HAMP1. The pictured value is Double-distance(i, j) - Double-distance(i' ,j') for the Double-distances within one protomer, and distance(i ,j') - distance(i', j) for the distances between residues from different protomers. Distance(i, j) stands for the distance between the centers of masses of residues i and j correspondingly. Indices without prime correspond to the first protomer, and those with prime correspond to the second protomer. AS1 and AS2 correspond to the first and the second alpha-helices of the HAMP domain. There is a prominent asymmetry in the structure, especially in the region adjacent to the inter-HAMP region. The changes mostly include the relative sliding of the AS2 and AS2’ helices. No special contacts are formed or broken. The AS1-AS2 linker is disturbed, as R112 and R113 sidechains form different ionic bonds and the hydrophobic L105 is exposed. Changes in the HAMP domain hydrophobic core are minimal. The whole structure shows little variation with time (see Figure S13 for complementary data).
Figure S17. Packing changes in the NpHtrII second HAMP domain when simulated as a part of a larger construct (HAMP1 - inter-HAMP - HAMP2). (A), (B) and (C) Superposition of the symmetrical structure (green tube) and the trajectory snapshots, taken each 2 ns (black ribbon). (A) and (C) are the side-views, meanwhile (B) is a view from the inter-HAMP region. (D) Double-distance matrix of the HAMP1. The pictured value is Double-distance(i, j) - Double-distance(i' ,j') for the Double-distances within one protomer, and distance(i ,j') - distance(i', j) for the distances between residues from different protomers. Distance(i, j) stands for the distance between the centers of masses of residues i and j correspondingly. Indices without prime correspond to the first protomer, and those with prime correspond to the second protomer. AS1 and AS2 correspond to the first and the second alpha-helices of the HAMP domain. There is a prominent asymmetry in the structure, especially in the region adjacent to the inter-HAMP region. The changes mostly include the relative sliding of the AS1 and AS1’ helices. No special contacts are formed or broken. AS2 and AS2' are also slightly asymmetric, which could impose some strain on the kinase control module, which follows HAMP2 AS2 helix (not simulated here), and contribute to the signal transduction. Changes in the hydrophobic core are minimal. The structure shows little variation with time (see Figure S15 for complementary data).
Table S2. pKa values of the rechargeable residues in the model of the NpHtrII HAMP domain region, predicted using MCCE2 program. Residues are named by their sidechain type, default charge, protomer (A or B) and residue number.
Residue Predicted pKa ASP-A0085 4.331 LYS+A0096 11.350 ARG+A0099 13.201 ASP-A0102 5.629 ASP-A0104 3.304 ASP-A0106 4.710 GLU-A0108 4.585 GLU-A0110 3.129 ARG+A0112 >15 ARG+A0113 13.912 GLU-A0114 3.979 ASP-A0115 4.874 GLU-A0116 4.550 ASP-A0119 4.877 TYR-A0121 13.269 ASP-A0125 2.355 GLU-A0126 5.935 ARG+A0128 >15 ARG+A0132 13.890 GLU-A0136 3.813 ASP-A0137 5.278 LYS+A0139 11.288 ARG+A0142 >15 GLU-A0143 2.298 ASP-A0144 5.503 GLU-A0146 4.664 LYS+A0150 12.792 ARG+A0151 12.923 GLU-A0153 5.321 GLU-A0154 3.928 GLU-A0158 3.608 GLU-A0162 6.645 GLU-A0164 4.867
GLU-A0168 2.844 ASP-A0171 4.880 ARG+A0172 14.140 CYS-A0173 >15 ASP-A0175 5.043 ASP-A0177 3.659 ARG+A0181 13.558 ASP-A0183 4.273 GLU-A0185 5.218 ASP-A0187 2.865 GLU-A0189 4.925 GLU-A0195 6.141 GLU-A0200 6.077 ASP-A0203 4.605 GLU-A0206 5.239 ASP-B0085 4.008 LYS+B0096 >15 ARG+B0099 13.808 ASP-B0102 6.138 ASP-B0104 3.226 ASP-B0106 5.427 GLU-B0108 4.404 GLU-B0110 2.607 ARG+B0112 12.844 ARG+B0113 12.845 GLU-B0114 4.653 ASP-B0115 3.065 GLU-B0116 4.624 ASP-B0119 4.516 TYR-B0121 13.050 ASP-B0125 3.277 GLU-B0126 5.687 ARG+B0128 >15 ARG+B0132 12.992 GLU-B0136 4.703 ASP-B0137 3.474 LYS+B0139 12.064
ARG+B0142 13.637 GLU-B0143 4.934 ASP-B0144 5.804 GLU-B0146 4.790 LYS+B0150 11.485 ARG+B0151 13.149 GLU-B0153 4.906 GLU-B0154 4.581 GLU-B0158 5.898 GLU-B0162 0.407 GLU-B0164 4.704 ARG+B0165 >15 GLU-B0168 4.548 ASP-B0171 5.542 ARG+B0172 >15 CYS-B0173 >15 ASP-B0175 3.244 ASP-B0177 3.311 ARG+B0181 12.759 ASP-B0183 6.146 GLU-B0185 4.175 ASP-B0187 3.160 GLU-B0189 4.100 GLU-B0195 6.334 GLU-B0200 6.485 ASP-B0203 6.041 GLU-B0206 4.947