HAL Id: hal-02183253
https://hal.archives-ouvertes.fr/hal-02183253
Submitted on 16 Oct 2019HAL is a multi-disciplinary open access archive for the deposit and dissemination of sci-entific research documents, whether they are pub-lished or not. The documents may come from teaching and research institutions in France or abroad, or from public or private research centers.
L’archive ouverte pluridisciplinaire HAL, est destinée au dépôt et à la diffusion de documents scientifiques de niveau recherche, publiés ou non, émanant des établissements d’enseignement et de recherche français ou étrangers, des laboratoires publics ou privés.
Optimizing FRET on Aluminum Surfaces via Controlled
Attachment of Fluorescent Dyes
Alexandra Petreto, Marcelina Cardoso dos Santos, Olivier Lefebvre, Gabriel
Ribeiro dos Santos, Paolo Ponzellini, Denis Garoli, Francesco de Angelis,
Mehdi Ammar, Niko Hildebrandt
To cite this version:
Alexandra Petreto, Marcelina Cardoso dos Santos, Olivier Lefebvre, Gabriel Ribeiro dos Santos, Paolo Ponzellini, et al.. Optimizing FRET on Aluminum Surfaces via Controlled Attachment of Fluorescent Dyes. ACS Omega, ACS Publications, 2018, 3 (12), pp.18867-18876. �10.1021/acsomega.8b02774�. �hal-02183253�
Optimizing FRET on Aluminum Surfaces via Controlled Attachment
of Fluorescent Dyes
Alexandra Petreto,
†Marcelina Cardoso Dos Santos,
†Olivier Lefebvre,
‡Gabriel Ribeiro Dos Santos,
†Paolo Ponzellini,
§Denis Garoli,
§,∥Francesco De Angelis,
§Mehdi Ammar,
*
,‡and Niko Hildebrandt
*
,††NanoBioPhotonics (nanofret.com), Institute for Integrative Biology of the Cell (I2BC), Université Paris-Saclay, Université Paris-Sud, CNRS, CEA, 91405 Orsay Cedex, France
‡Center for Nanosciences and Nanotechnologies, CNRS, Université Paris-Sud, Université Paris-Saclay, C2N-Orsay, 91405 Orsay Cedex, France
§Istituto Italiano di Tecnologia, Via Morego, 30, I-16163 Genova, Italy ∥AB Analitica, Via Svizzera 16, 35027 Padova, Italy
*
S Supporting InformationABSTRACT: Förster resonance energy transfer (FRET) between fluorescent dyes is a frequently applied technique for analyzing concentrations and conformations of biomolecules. Optimizing FRET by controlled dye-surface functionalization is an important requirement to develop sensors based on surface−biomolecule interactions. Here, we investigate the silanization of silica with aminosilanes ((3-aminopropyl)-triethoxysilane, APTES) and their subsequent functionalization with commercial organic fluorophores (ATTO-550 and ATTO-647N) for controlling the fluorescence intensity and FRET interaction between the dyes. Owing to the growing application of aluminum in plasmonics and the possibility to enhance FRET with aluminum nanostructures, we used plasma-enhanced atomic layer deposition (PEALD) to cover aluminum layers with thin silica coatings (∼4 nm) as a prototypical system to apply
and characterize our controlled APTES−dye functionalization procedure. Detailed spectroscopic and fluorescence imaging analyses were used to optimize the silanization, control the dye functionalization, and rule out aluminum-relatedfluorescence quenching. The optimized protocol was then used to attach both dyes on the same surface, which enabled efficient FRET. As PEALD is in principle applicable to different substrates, we believe that our controlled FRET-functionalization approach may be adaptable to many other surfaces and nanostructures and may become a useful tool to advance the development offluorescence biosensors.
■
INTRODUCTIONSilanization is a well-known and stable surface functionaliza-tion method that has been applied for the attachment of various biomolecules on silicon, silica, glass, or poly-(dimethylsiloxane) for bioanalytical devices, biosensors, diagnostics, and microfluidics.1−4 Many of these biosensing applications based on silanized substrates used optical detection, including plasmonics,5 fluorescence,6,7 and Förster resonance energy transfer (FRET).8Although such biosensing devices usually apply silanization to immobilize biomolecules on their surfaces, and optical probes are attached to these or other biomolecules that participate in the biological recog-nition process, direct attachment of fluorescent dyes to the surfaces and detection of the interaction of label-free biomolecules with these fluorescent surfaces are rather unexplored. Owing to its nanometric distance dependence, FRET is one of the most important techniques to qualify and quantify biomolecular interactions on the nanoscale.9−15 A
biosensing device functionalized with FRET pairs (donor and acceptor dyes coassembled to the surface) may provide interesting information concerning biomolecule−surface inter-actions or biomolecules in close proximity to the FRET-functionalized surfaces.
Plasmon-based sensing via enhanced fluorescence on the surfaces of metal nanoparticles or nanostructured metal surfaces has become an important method for the detection of biological or biochemical molecules and interactions.16−28 Although gold and silver are arguably the most applied plasmonic materials, which can be functionalized by sulfhydryl-reactive chemistry without additional surface modification,29 the advantages of aluminum concerning costs, natural abundance, and manufacturing have resulted in many
Received: October 12, 2018
Accepted: December 7, 2018
Published: December 31, 2018
Article
http://pubs.acs.org/journal/acsodf
Cite This:ACS Omega 2018, 3, 18867−18876
© 2018 American Chemical Society 18867 DOI:10.1021/acsomega.8b02774
ACS Omega 2018, 3, 18867−18876
This is an open access article published under an ACS AuthorChoice License, which permits copying and redistribution of the article or any adaptations for non-commercial purposes.
Downloaded via 109.221.140.129 on October 16, 2019 at 14:14:30 (UTC).
applications of aluminum plasmonics.30−35Recently, Wenger et al. demonstrated significant enhancement of FRET when a DNA conjugated with a dye−dye (550 and ATTO-647N) FRET pair moved into close proximity of aluminum nanoapertures or nanoantennas.36,37The combination of these plasmonic-FRET results, the successful coating of gold nanostructures by thin silica layers using plasma-enhanced atomic layer deposition (PEALD),38 and the general higher flexibility of PEALD39
motivated us to develop a surface functionalization strategy for aluminum. Direct and controlled dye functionalization of aluminum via thin silanized silica coatings should be able to take into account the fine line between decreasing (very shortfluorophore−surface distances) and increasing (few nanometers of fluorophore−surface distances) fluorescence intensities.26,40−43 Thus, it has the potential to become useful for investigating label-free biomolecules in future plasmonic studies using nanostructured metal surfaces.
Here, we show that thin aluminum films can be coated by PEALD with ca. 4 nm-thick silica layers that can be further functionalized by (3-aminopropyl)triethoxysilane (APTES). Extensive optimization and characterization of the silanization protocol allowed us to graft APTES molecules with a well-controlled density on the silica coating. The aminosilanes were then used to attach two different organic dyes, namely, N-hydroxysuccinimide (NHS)-terminated ATTO-550 and ATTO-647N, on the outer surface layer. Dye-concentration-dependent fluorescence intensities were analyzed by fluo-rescence microscopy and revealed an optimum concentration region and confirmed the smooth silanization with evenly distributed APTES. The optimized protocol was then used to functionalize both dyes to the silanized aluminum surfaces with the aim to investigate their interaction as donor−acceptor FRET pairs. Indeed,fluorescence imaging of the surfaces with a camera resolution of 1024 × 1024 pixels (ca. 1 million fluorescence pixels) showed efficient FRET (average EFRET=
0.7± 0.2) and corroborated the close distance (ca. 5.5 nm in average) of the APTES molecules and the sufficient thickness of the silica−APTES coating to avoid fluorescence quenching by the underlying aluminum surface. The dyefluorescence and FRET results were very useful for analyzing the coating properties, which may become an important tool for characterizing silanized silica surfaces for biosensing devices. Taking into account that PEALD deposition of thin silica coatings may be transferable to other metals and nano-structured metal surfaces, our method has the potential to become a valuable tool for plasmonic fluorescence and/or FRET biosensing.
■
RESULTS AND DISCUSSIONSilanization and Characterization of Silica-Coated Aluminum Films. Al layers that were 100 nm thick were deposited by e-beam lithography on commercial Si3N4
membrane chips. Directly after Al deposition, the Al films were coated by PEALD with a 4 nm-thick layer of SiO2, as
verified by ellipsometry. To prepare the SiO2-coated aluminum films (Al−SiO2) for the attachment of fluorescent dyes, the
silica layer was functionalized with (3-aminopropyl)-triethoxysilane (APTES) aminosilanes (Scheme 1),4following an optimized protocol. Samples were rinsed and then cleaned with oxygen plasma, which was an indispensable pretreatment step to avoid nonspecific adsorption and to guarantee a reproducible functionalization. Silanization with APTES was
performed during 10 h (reaction time was carefully optimized) at a controlled humidity (2%), temperature (21± 1 °C), and pH (pH 5−6), and afterward the silanized samples were rinsed and dried.
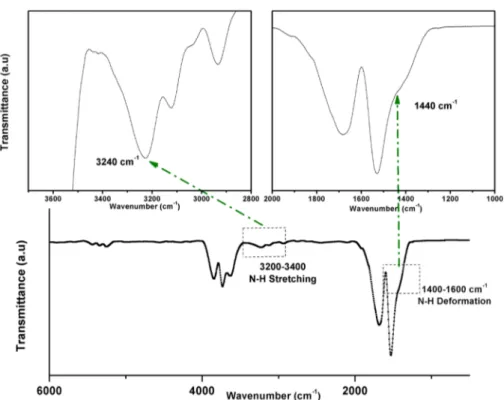
Contact angle measurements were used to characterize the surfaces after the different treatment and functionalization steps. The hydrophobic untreated samples (SiO2-coated Al films), which showed a large contact angle of 86.7 ± 1.2°, became hydrophilic after oxygen plasma cleaning with a low contact angle of 5.3 ± 1.0°. This result confirmed the enhancement of the silanol group density on the silica surface. After silanization, the presence of the amino groups and the carbon backbones of APTES, which are more hydrophobic than silanol groups,44resulted in a more hydrophobic surface with a contact angle of 78.1 ± 8.7°. The presence of amino groups limited the full-hydrophobic characteristics of the surface. To confirm the chemical nature of the grafted silanes and to provide another qualitative control of successful silanization, we characterized the silanized surfaces by Fourier-transform infrared (FTIR) spectroscopy. The spectra of silanized SiO2-coated Al films in Figure 1 highlight the specific absorption bands of aminosilanes. They show two characteristic peaks relative to N−H bonds localized at the terminal groups of silane chains. Precisely, a small shoulder at 3240 cm−1 is ascribed to the N−H asymmetric stretching of the amine H bonds, which is representative of a possible NH2
interaction toward the silica surface.45A broad band at 1440 cm−1 is assigned to the N−H stretching vibration, which is indicative of the free amino groups.45,46 These characteristic peaks do not appear in the spectra of silanized aluminum (Figure S1) but are confirmed in silanized SiO2 without subjacent aluminum (Figure S2), which confirms the successful APTES silanization specifically on SiO2surfaces.
Dye−APTES Functionalization. In a first approach to demonstrate the functionality of the APTES-coated surfaces, we aimed at attaching N-hydroxysuccinimide (NHS)-activated organic dyes to the terminal amino groups of APTES (cf.
Scheme 1). First, 20μL of ATTO-647N−NHS (1 mg/mL) in carbonate buffer (pH 9) was deposited on the surfaces for 1 h, and after washing and drying the contact angle was measured. The moderate hydrophilicity of ATTO-647N led to a slight decrease of the contact angle from 78.1± 8.7 to 63.0 ± 8.0°, which was a first good evidence for a successful dye functionalization. Further characterization of the dye-coated Scheme 1. Attachment of Aminosilanes (APTES) on the SiO2-Coated Al Films
Figure 1.FTIR spectrum (bottom) and enlargement of specific spectral regions (top) of silanized SiO2-coated aluminum surfaces. Peaks at 3240
and 1440 cm−1were characteristic of N−H stretching and deformation, respectively.
Figure 2.Background-corrected false color (0−200 counts from blue to red) fluorescence images (1500 × 1500 pixels cropped image) of Al− SiO2−ATTO-647N (a), Al−SiO2−APTES−ATTO-647N (b), and SiO2−APTES−ATTO-647N (c). Scale bars correspond to 50 μm.
Table 1. Fluorescence Intensities after Attachment of ATTO-647N and Subsequent Cleaning
O2plasma treatment sample typea mean intensity± distributionb average of mean intensitiesc
silanized samples yes Al−SiO2−APTES 54± 17 52± 4
SiO2−APTES 49± 14
Al−APTES 30± 15
control samples (nonsilanized) yes Al−SiO2 9± 7 9± 7
SiO2 9± 7 Al 4± 5 no Al−SiO2 57± 16 63± 56 SiO2 122± 27 Al 11± 8 a
All samples were incubated with 20μL of ATTO-647N−NHS (1 mg/mL for silanized samples and 2 mg/mL for controls). Background was measured on the same sample type without O2plasma treatment, silanization, and ATTO-647N.bBackground-correctedfluorescence intensities
(mean intensity and intensity distribution of intensity histograms acquired from three different ROIs with 3 × 10⁶± 1 × 104pixels per ROI) after
mask correction. Measurements were also performed on Al−SiO2 samples for 0.5 mg/mL ATTO-647N−NHS, which corresponded to the
maximum of intensity inFigure 3, and gave similar values of 8± 7 with and 77 ± 18 without O2plasma treatment.cAl samples without SiO2were
not taken into account for averaging because of different conditions for APTES functionalization.
ACS Omega Article
DOI:10.1021/acsomega.8b02774
ACS Omega 2018, 3, 18867−18876
surfaces was performed by fluorescence imaging. Figure 2
shows background-corrected fluorescence images of SiO2
-coated Alfilms, without (a) and with (b) APTES, and a SiO2
layer (without the subjacent Al film) with APTES (c) after ATTO-647N coupling and subsequent rinsing. The differences influorescence intensities can be readily distinguished by the naked eye and confirm the successful dye attachment on silanized SiO2 and SiO2−Al layers (Figure 2b,c). Indeed, the similarfluorescence intensities of SiO2layers with and without
subjacent Alfilms suggest that the thickness of the SiO2layer
was sufficient to prevent any fluorescence quenching by aluminum.
To gain more insight into the importance of the various treatment and functionalization steps of the complete silanization and dye-coupling protocol, we performed a quantitative assessment of the fluorescence intensities of various types of samples. Several samples at different steps of the protocol were incubated with 20 μL of ATTO-647N− NHS (1 or 2 mg/mL) for 1 h, andfluorescence images were taken after rinsing and drying. Because the final step always used the same dye solution and the dyes always attached toflat surfaces, we could reasonably assume that the fluorescence quantum yields of the dyes did not change, and a direct comparison of the fluorescence intensities on the different samples could be used. Fluorescence intensity values for each image were determined from the average photon counts from all camera pixels (2560× 2160) after correction of aggregates or surface defects that led to extremely high fluorescence intensities (see the Supporting Information (SI) for the correction procedure). The average fluorescence intensities from three regions of interest (ROIs) (Table 1) contained important information regarding the surface treatment and dye functionalization. Successful dye coupling was evidenced by the strong intensity increase of ATTO-647N-functionalized Al−SiO2−APTES samples (54 ± 17 counts) compared to the
nonsilanized control (9 ± 7 counts). Similar fluorescence intensities from SiO2−APTES−ATTO-647N samples without
Al (49± 14 compared to 54 ± 17 counts with Al) indicated that the SiO2-coated aluminum layer did not lead to
fluorescence quenching of the ATTO-647N. We note that the aim of our study was not to accomplish plasmonic enhancement offluorescence (which would also be unreason-able from a flat Al film) but to provide and characterize a reproducible dye-coating procedure. Samples without SiO2
coating (Al−APTES−ATTO-647N) were also tested and showed a reducedfluorescence intensity (30 ± 15, ca. 60% of the samples with SiO2coating), which may have resulted from
fluorescence quenching due to the closer distance (4 nm SiO2
coating was missing) of the dyes to the Alfilm. However, we could not rule out that APTES functionalization of Al was less efficient than the one of SiO2, which would also lead to lower
fluorescence intensities. Despite the uncertainty of the origin of reduced fluorescence, the results determined from various samples clearly showed a successful ATTO-647N functional-ization on Al−SiO2−APTES samples without fluorescence quenching and nonspecific adsorption.
Another interesting point concerns the importance of O2 plasma treatment of the samples, which removes all contaminants from the surfaces to be functionalized.47 As shown in Table 1, the fluorescence intensity values of untreated samples were very randomly distributed (between 11± 8 and 122 ± 27 in this set of control experiments), which was most probably caused by nonspecific and uncontrolled
adsorption of ATTO-647N−NHS to the different surfaces. Although such nonspecific adsorption can lead to higher fluorescence values than for O2-plasma-cleaned samples (e.g.,
122± 27 compared to 54 ± 17), the large sample-to-sample variation is a clear disadvantage for the production of biosensing devices that necessitate a high reproducibility. O2
-plasma-treated control samples all showed low fluorescence intensity values between 4± 5 and 9 ± 7, which confirmed the very low degree of dye attachment to these cleaned surfaces. On average, plasma-cleaned samples resulted in mean fluorescence intensities of 52 ± 4 counts per pixel for silanized and 9± 7 counts per pixel for nonsilanized samples, whereas the untreated samples resulted in a mean intensity of 63± 56 counts per pixel. Clearly, the O2 plasma treatment adds an
important degree of control and reproducibility to the functionalization strategy, which is of paramount importance for anyfluorescence application on functionalized surfaces.
Concentration-Dependent Dye−Surface Coupling. Becausefluorescence intensity is the signal that will be used in the final biosensing device, it would be the most advantageous if the same signal could be used to evaluate the influence of the dye concentration on the functionalization procedure instead of using other techniques that may not be available in all laboratories and would necessitate an additional characterization step. We investigated several different Al− SiO2−APTES samples (three to four per dye concentration)
using the same functionalization protocol as mentioned above but with ATTO-647N−NHS concentrations ranging from 0.01 to 2.0 mg/mL. The fluorescence measurements revealed a clear concentration dependence that could be divided into three concentration ranges (Figure 3). In the lower
concentration regime (0.01−0.3 mg/mL), the fluorescence intensity can be almost linearly tuned (from ca. 5 to 60 average counts per pixel) by adjusting the initial dye concentration. At concentrations from ca. 0.3 to 0.7 mg/mL, the fluorescence intensity is at a constant level (around 60 average counts per pixel), which provides a comfortable range for reproducible functionalization results. At higher concentrations, the
Figure 3. Background-corrected fluorescence intensities of ATTO-647N dyes applied at different concentrations to Al−SiO2−APTES
samples. Average pixel intensities calculated from three to four samples (9−12 ROI, ∼3 × 10⁶ ± 1 × 104 pixels per ROI) per
fluorescence intensity slightly decreases, which may be caused by charge transfer, energy transfer, or local innerfilter effects between the closely packed dyes (high local concentration on the surface).12,48 Although such fluorescence quenching was certainly not desirable, it provided good evidence that the APTES molecules are efficiently covering the substrate with limited free surface, enough to allow for FRET between two different dyes.
Surface-FRET between ATTO-550 and ATTO-647N. Encouraged by the concentration-dependent fluorescence results, we challenged our Al−SiO2−APTES samples with
the simultaneous attachment of two different dyes that could act as a FRET donor−acceptor pair. To show the possible application of our technology for future plasmonic biosensing devices, we used the same FRET pair (ATTO-550 donor and ATTO-647N acceptor) that was applied for FRET efficiency enhancement on plasmonic Al nanostructures.36,37Absorption andfluorescence spectra of both dyes are presented inFigure 4, together with the bandwidths of the excitation and emission filters used for fluorescence imaging.
For FRET analysis, several FRET parameters need to be determined.49,50The Förster distance (R0) of the ATTO-550/
ATTO-647N donor−acceptor pair, which is the distance at which FRET is 50% efficient, was calculated to R0= 6.4 nm
usingeq 1 κ ϕ π λ = R n N J 9 ln(10) 128 ( ) 06 2 D 5 4 A (1)
where κ2 is the dipole−dipole orientation factor that was assumed to beκ2 = 2/3 (dynamic averaging due to the free
rotation of the dyes that are coupled via flexible linkers to amines on top of the APTES molecules), ΦD is the fluorescence quantum yield of the ATTO-550 donor (ΦD =
80%), n is the refractive index of the sample-surrounding medium (n = 1.35 for buffered aqueous medium), NA= 6.02×
1023 mol−1 is Avogadro’s constant, and J(λ) in (M−1 cm−1
nm4) is the spectral overlap integral as calculated byeq 2
∫
λ = λ ε λ λ λ J( ) FD( ) ( )A 4d
(2)
where FD(λ) is the area−normalized fluorescence intensity of
the donor in nm−1, εA(λ) is the extinction coefficient of the acceptor in M−1cm−1, andλ is the wavelength in nanometers.
Figure 5 shows representative fluorescence images of dye-functionalized Al−SiO2−APTES surfaces with only
ATTO-550 (donor control), only ATTO-647N (acceptor control), and a 1:1 mixture of both dyes (FRET). Owing to the similar structures and sizes and the same functional group (NHS) of the two ATTO dyes, we assumed very similar coating conditions and thus selected a 1:1 mixture for the dyes. Three different dye concentrations (0.25, 0.5, and 1.0 mg/mL) that were within or close to the maximum fluorescence concentration region (cf. Figure 3) were used for surface functionalization. Owing to the large amount of samples used within our study, aggregates or surface defects (vide supra) could not be avoided. However, these high-intensity regions (and also the vertical smearing effects caused by the short exposure times to avoid photobleaching) could befiltered for fluorescence intensity quantification (vide infra). Despite these artifacts, the fluorescence images for all three dye concen-trations clearly showed energy transfer from ATTO-550 to ATTO-647N. Both significant donor quenching (left rows, top, and bottom images) and acceptor sensitization (right rows, top, and bottom images) were readily observable. Donor and acceptor control experiments also revealed that there was negligible spectral cross-talk of donor emission in the acceptor detection channel (top line, left, and right images) and only very few acceptor fluorescence upon direct excitation by the donor excitation wavelength (center line, right images), confirming that the acceptor fluorescence in the FRET experiments (bottom right images) was caused by energy transfer.
To provide a more quantitative evaluation than can be provided from the single-ROI images inFigure 5, we analyzed thefluorescence intensities of all camera pixels from nine ROIs taken from three different samples for each concentration. Fluorescence data treatment was performed as described in the
Experimental Section, by applying a mask allowing to suppress signals originating from aggregates and surface defects (see the
SI for details of the filtering procedure). The different fluorescence intensity values (Table 2) were used to determine the FRET efficiency EFRET(eq 3), the FRET ratio (eq 4), and the distance between donor and acceptor R (eq 5).49,50
= − E I I 1 FRET DA D (3)
where IDA (exc: D; em: D; FRET) and ID (exc: D; em: D;
donor control) are thefluorescence intensities of the donor in the presence and absence of the acceptor, respectively.
− = I
I
FRET ratio AD
DA (4)
where IAD (exc: D; em: A; FRET) is the intensity of the acceptor upon donor excitation.
i k jjjjj y{zzzzz = − R R I I I 0 DA D DA 1/6 (5)
The three FRET parameters for each concentration are presented in Table 3. Both FRET efficiency and FRET ratio
Figure 4.Absorption (dashed lines, left ordinate) and emission (solid lines, right ordinate) spectra of ATTO-550 (blue) and ATTO-647N (red). Transmission spectra of the detection bandpass filters are shown in gray (right ordinate). Dichroic mirrors (not shown) for excitation/emission separation had their transmission/reflection turnover at 562 nm for donor and FRET detection and at 649 nm for acceptor detection.
ACS Omega Article
DOI:10.1021/acsomega.8b02774
ACS Omega 2018, 3, 18867−18876
slightly increased (and therefore the distance between the dyes slightly decreased) when the FRET-pair dye concentration was increased from 0.25 to 0.5 mg/mL. Although intuitively one might have expected a larger change of the FRET parameters when doubling the dye concentration, the rather small alterations confirm the concentration-dependent functionaliza-tion results fromFigure 3. Because 0.25 mg/mL is already very close to the fluorescence intensity saturation range, the changes in FRET (which mainly depend on the dye−dye distance) are rather small when the concentration was increased to the saturation range. Another doubling of the FRET-pair concentration to 1.0 mg/mL led to a more drastic change of the FRET efficiency and dye-to-dye distance and a large increase of the FRET ratio. As already discussed for the concentration-dependent functionalization, this concentration may have led to a relatively dense packing of the dyes and concomitant charge or energy transfer or inner filter effects, which probably resulted in stronger donor quenching while still efficiently sensitizing the acceptor dyes and thus led to a stronger modification of the FRET parameters. Although such high FRET ratios may be advantageous for some applications, the additional quenching parameters may lead to unstable fluorescence conditions, and therefore a general recommenda-tion would be not to use too highfluorophore concentrations for surface functionalization.
■
CONCLUSIONSA generic method to attachfluorophores or biomolecules in a controlled and reproducible way to different surfaces would be a very useful tool for the development of reliable and accurate biological or chemical sensing devices. In this study, we have used Al-coated silicon wafers as a prototypical system to demonstrate that the deposition of thin silica layers (∼4 nm) and a subsequent silanization with APTES can be used to attach fluorescent dyes in a controlled, homogeneous, and reproducible manner. Successful attachment of silanes was confirmed by contact angle and FTIR measurements, and dye functionalization was followed by fluorescence imaging. The investigation of many different samples ranging from the pure wafer to the final Al−SiO2−APTES−dye system (and all systems in between), the optimization of the functionalization
Figure 5.Background-corrected false color (0−300 counts from blue to red) fluorescence images of dye-functionalized Al−SiO2−APTES samples.
Donor control contains only ATTO-550, acceptor control contains only ATTO-647N, and FRET contains both dyes at concentrations of 0.25 mg/ mL (a), 0.5 mg/mL (b), and 1.0 mg/mL (c). Left rows present donor excitation (exc: D) and emission (em: D), center rows present acceptor excitation (exc: A) and emission (em: A), and right rows present donor excitation (exc: D) and acceptor emission (em: A). The size of each image is 332.8μm × 332.8 μm. Selected intensity histograms of the images can be found inFigure S3.
Table 2. Fluorescence Intensities for the Donor Alone (ATTO-550), the Acceptor Alone (ATTO-647N), and the FRET Pair (Ratio 1:1) in Each Detection Channela
sample
dye concentration (mg/mL)
exc: D exc: A exc: D
em: D em: A em: A
donor control 0.25 116± 46 0± 20 0± 23 acceptor control 0.25 0± 39 143± 40 33± 28 FRET 0.25 42± 42 69± 31 54± 33 donor control 0.5 105± 45 0± 18 0± 22 acceptor control 0.5 0± 37 198± 44 63± 31 FRET 0.5 36± 42 91± 33 57± 32 donor control 1.0 145± 49 0± 20 0± 25 acceptor control 1.0 0± 35 167± 55 81± 34 FRET 1.0 27± 40 195± 45 150± 43
a(Exc: D and em: D): donor channel = excitation 543/22, dichroic 562, emission 586/20. (Exc: A and em: A): acceptor channel = excitation 623/24, dichroic 649, emission 676/29. (Exc: D and em: A): FRET channel = excitation 543/22, dichroic 562, emission 676/ 29. FRET pair ratio is 1:1. Around 1× 10⁶ ± 1 × 104 pixels were considered for each ROI. Note: All values were background-corrected but the intensity distribution over all pixels (error) was conserved, which may lead to negative error ranges.
Table 3. FRET Parameters for Different FRET-Pair (ATTO-550 and ATTO-647N) Concentrations
concentration (mg/mL)
FRET
efficiencya FRET ratiob
D−A distance (nm)c 0.25 0.64± 0.03 1.29± 0.11 5.82± 0.12 0.50 0.66± 0.02 1.58± 0.07 5.74± 0.06 1.0 0.81± 0.02 5.56± 0.39 5.01± 0.09
aCalculated witheq 3.bCalculated witheq 4.cCalculated witheq 5. Note: Errors were calculated for n = 9 by using the standard deviations of the average correctedfluorescence intensities from nine different ROIs. The pixel distributions (errors inTable 2) are not important for the FRET parameters and were therefore not taken into account.
environment and pretreatment of the surfaces by O2plasma, and a dye (ATTO-647N)-concentration-dependent surface attachment analysis allowed us to develop a protocol for controlled dye−surface coupling. This optimized protocol was then applied to attach a dye FRET pair (ATTO-550 donor and ATTO-647N acceptor) to the silanized Al−SiO2 surfaces,
which led to efficient FRET (with both donor quenching and acceptor sensitization) with efficiencies between ∼60 and 80% depending on the dye concentrations. These FRET results were of 2-fold importance. First, they confirmed the homogeneous silanization that can attach dyes at distances of ca. 5−6 nm to each other, and therefore FRET measurements on a standard fluorescence microscope can be used to characterize the quality and quantity of surface functionaliza-tion. Second, successful FRET between two dyes attached to an aluminum surface via a PEALD-deposited silica coating (to preventfluorescence quenching from the underlying metal and to protect the Alfilm against oxidation) presents an interesting strategy to use FRET-functionalized metal nanostructures for plasmonically enhanced FRET to investigate label-free biomolecules.
■
EXPERIMENTAL SECTIONSilica-Coated Aluminum Samples. Samples used for the functionalization were prepared following a process of several steps. Commercial Si3N4membrane chips (thickness: 100 nm; area: 500 × 500 μm2) were used as substrates. These were rinsed in ethanol before utilization. Next, 100 nm-thick Al layers were deposited by means of e-beam physical vapor deposition in high vacuum (1× 10⁻⁶mbar) at the standard deposition rate of 0.3 Å/s. After Al deposition, the samples were immediately transferred to the PEALD facility. The employed instrument was a commercial PEALD reactor “FlexAL” (Oxford Instruments), which has a remote, inductively coupled plasma capability. The bis(tert-butylamino)silane precursor was heated at 35°C to supply a vapor pressure of approximately 3 torr and was delivered to the reaction chamber by the vapor-draw method. The substrate temperature was 80 °C. The oxidant was an oxygen plasma generated at 300 W at aflow rate of 60 sccm. The precursor dose was 1.0 s and the plasma dose was 5.0 s. The process has been developed by Oxford Instruments (https://www.oxinst. com/) and has been previously described in the literature.39In total, 28 cycles of SiO2deposition (0.145 nm/cycle, 80 °C) were applied. The final thickness of 4 nm SiO2 was
characterized by means of ellipsometric reflectometry using a WVASE instrument (www.jawoolam.com) and fitting the experimental data on different samples with increasing SiO2 thickness. After SiO2deposition, samples were analyzed by an
optical microscope to verify the cleanliness of the substrates and the homogeneity of the deposited coating (Figure S4). The roughness of the coating was checked through scanning electron microscopy imaging (Figure S5).
Silanization of Silica-Coated Aluminum Samples. Silica-coated aluminum samples were washed in acetone and isopropanol and dried with nitrogen in a clean room environment. Afterward, the samples were cleaned and activated with oxygen plasma treatment (0.4 mbar, 1 min, 160 WPico, Diener). A solution of 4% of 3-amino-propyltriethoxysilane (APTES, Sigma) in acetone (Sigma) was prepared and then sonicated for 1 min and heated at 60°C for 15 s. The samples were immersed in the solution and maintained in a glovebox under nitrogen for 10 h under
stirring. The humidity was kept at a constant value of 2%, and the temperature was 21± 1 °C. The pH was controlled at the beginning and end of the experiment and was checked to be slightly acidic (pH 5−6). The samples were then rinsed (twice in acetone for 5 min and in deionized water for 5 min) and dried with compressed air.
Contact Angle Measurements. Contact angle measure-ments were performed at room temperature in a clean room on a Contact Angle System (OCA 20, Dataphysics), and contact angle values were acquired using SCA20 software. For each sample, a 1μL droplet was deposited at a slow rate of 0.5 μL/s on at least six areas per sample. Final contact angle values were the average of six measurements per sample performed on two different samples.
Fourier Transform Infrared (FTIR) Spectroscopy. FTIR measurements were performed on a setup composed of a spectrometer (Varian 670-IR, Agilent), coupled to a micro-scope (Varian 610-IR, Agilent) equipped with two objectives (15× IR, 40× visible). Measurements were acquired in single point reflection mode with a mercury cadmium telluride detector cooled at 77 K with liquid nitrogen and a scan speed of 25 kHz (1.58 cm/s). In addition, a mid-infrared KBr splitter was used for the IR source. Measurement conditions were as follows: wavenumber resolution wasfixed at 8 cm−1, number of scans for signal acquirement at 64, and for background (performed on untreated surface) at 96 scans. The wave-number range was established to be 500−4000 cm−1for each scan. All zones of interest were defined under the microscope (visible) before starting the FTIR measurements using the IR objective. The IR spectrum analysis was performed by Varian Pro software to highlight the characteristic peaks of silanes and adjust thefitting curves for semiquantitative evaluation of the corresponding amino group vibrations.
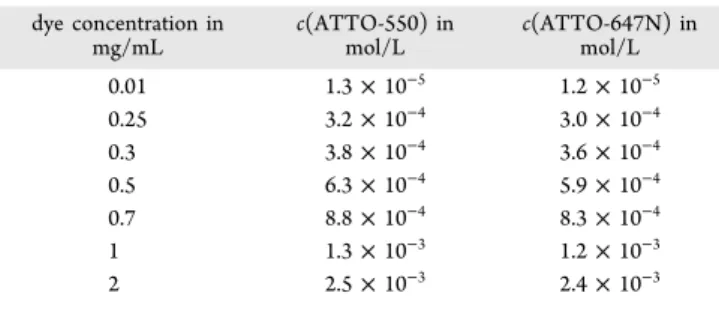
Dye Grafting. Silanized surfaces were functionalized with commercial N-hydroxysuccinimide (NHS)-terminated organic dyes “ATTO-550” and “ATTO-647N” (ATTO-TEC), which react with the amine groups on the APTES silanes to form covalent dye−APTES conjugates.4,51These dyes are standard organic dyes that have been used in several plasmonic-enhanced FRET studies.36,37,52ATTO-550 (structure has not been published) is a rhodamine dye with a molecular weight of 791 g/mol (including the NHS function), a maximum extinction coefficient of 120 000 M−1 cm−1, a fluorescence quantum yield of 0.80, and a fluorescence lifetime of 3.6 ns. ATTO-647N (cf. Figure S6 for structure) is a carbo-rhodamine dye with a molecular weight of 843 g/mol (including the NHS function), a maximum extinction coefficient of 150 000 M−1 cm−1, a fluorescence quantum yield of 0.65, and afluorescence lifetime of 3.5 ns. Taking into account these very similar properties of ATTO-550 and ATTO-647N (as provided by ATTO-TEC) and the same NHS function, very similar coating conditions can be reasonably assumed for both dyes. Because the ATTO−NHS dyes are provided in milligram quantities and our surface functionalization procedure is based on the initial concen-trations used for the functionalization (for each investigated dye concentration, a 20μL droplet was deposited on the 1 cm2
surfaces for 1 h in carbonate buffer at pH 9), all concentrations are reported in mg/mL. The corresponding molar concen-trations can be found inTable 4.
After dye deposition and incubation, samples were washed three times for 5 min in deionized water, dried with compressed air, and stored in Fluoroware boxes (VWR).
ACS Omega Article
DOI:10.1021/acsomega.8b02774
ACS Omega 2018, 3, 18867−18876
Fluorescence Quantification Experiments. Images of the structures were acquired with a wide-field luminescence inverted microscope (Olympus IX71) using a 40× water immersion objective, a wide-field fluorescence microscope excitation light source (X-Cite 120Q), and a sCMOS camera (PCO edge) for detection. The lamp was set to provide a power of 14.4 W. Images were taken with 300 ms acquisition time with the following optical filters (Semrock) for ATTO-647N imaging: 620/14 nm BrightLine single-band bandpass filter for excitation, 649 nm edge BrightLine single-edge standard epi-fluorescence dichroic beamsplitter as dichroic, and 660/13 nm BrightLine single-band bandpass filter for emission.
Absorption/Fluorescence. Absorption spectra were acquired using a Lambda 35 UV/Vis spectrophotometer (Perkin Elmer). Fluorescence emission spectra were recorded on a Xenius spectrofluorometer (SAFAS).
FRET Imaging. Images of the structures were acquired with a wide-field luminescence inverted microscope (Olympus IX83) using a 40× oil immersion objective, a wide-field fluorescence microscope excitation light source (X-Cite exacte), and an EMCCD camera (Andor iXon 888 Ultra) for detection. The lamp was set to provide a power of 20 W. Images were taken with a 5 ms acquisition time and an electron-multiplying gain set at 200. The following optical filters (Semrock) were used for the donor dye ATTO-550: 543/22 nm BrightLine single-band bandpass filter for excitation, 562 nm edge BrightLine single-edge standard epi-fluorescence dichroic beamsplitter as dichroic, and 586/20 nm BrightLine single-band bandpass filter for emission; for the acceptor dye ATTO-647N: 623/24 nm BrightLine single-band bandpassfilter for excitation, 649 nm edge BrightLine single-edge standard epi-fluorescence dichroic beamsplitter as dichroic, and 676/29 nm BrightLine single-band bandpass filter for emission; and for the FRET pair: 543/22 nm BrightLine single-band bandpass filter for excitation, 562 nm edge BrightLine single-edge standard epi-fluorescence dichroic beamsplitter as dichroic, and 676/29 nm BrightLine single-band single-bandpassfilter for emission.
Fluorescence Data Treatment. Each acquired image was analyzed with a home-made program using Icy.53Background correction was applied on each image before mask application by subtraction of a mean value corresponding to the signal of an untreated (neither oxygen-plasma-treated nor silanized nor dye-grafted) Al−SiO2 sample (or Al or SiO2 for control
experiments). A mask characterized by an intensity threshold and a pixel distance security (around pixels above the intensity threshold) was then applied to suppress aggregates in the averagefluorescence intensity calculation. Data obtained were thenfitted with a kernel function on a 50 bins basis in order to determine the mean value (μ) and the associated standard
deviation (σ) and plotted together with the histogram corresponding to the fluorescence image. In addition, corrected images (after mask application) were displayed in Icy (Figure S7), and the total number of pixels used for intensity calculation after mask application was determined.
■
ASSOCIATED CONTENT*
S Supporting InformationThe Supporting Information is available free of charge on the
ACS Publications website at DOI:
10.1021/acsome-ga.8b02774.
FTIR control experiments (Figures S1 and S2); selected intensity histograms for images presented in Figure 5
(Figure S3); images of Al−SiO2 surfaces in optical
(Figure S4) and scanning electron (Figure S5) microscopy; chemical structure of ATTO-647N (Figure S6); image correction for aggregates and other surface defects (Figure S7) (PDF)
■
AUTHOR INFORMATIONCorresponding Authors
*E-mail:[email protected](M.A.). *E-mail:[email protected] (N.H.). ORCID Denis Garoli: 0000-0002-5418-7494 Francesco De Angelis:0000-0001-6053-2488 Niko Hildebrandt: 0000-0001-8767-9623 Notes
The authors declare no competingfinancial interest.
■
ACKNOWLEDGMENTSWe thank the C2N PIMENT facility (financed by the RENATECH network and the General Council of Essonne) for technical support and the European Commission (Horizon2020, FET-Open project “PROSEQO”) and the Institut Universitaire de France (IUF) forfinancial support.
■
REFERENCES(1) Eichler, M.; Klages, C.-P.; Lachmann, K. Surface Functionaliza-tion of Microfluidic Devices. In Microsystems for Pharmatechnology. Manipulation of Fluids, Particles, Droplets, and Cells; Dietzel, A., Ed.; Springer International: Switzerland, 2016; pp 59−98.
(2) Howarter, J. A.; Youngblood, J. P. Optimization of silica silanization by 3-aminopropyltriethoxysilane. Langmuir 2006, 22, 11142−11147.
(3) Vandenberg, E. T.; Bertilsson, L.; Liedberg, B.; Uvdal, K.; Erlandsson, R.; Elwing, H.; Lundstrom, I. Structure of 3-aminopropyl triethoxy silane on silicon-oxide. J. Colloid Interface Sci. 1991, 147, 103−118.
(4) Vashist, S. K.; Lam, E.; Hrapovic, S.; Male, K. B.; Luong, J. H. T. Immobilization of Antibodies and Enzymes on 3-Aminopropyltrie-thoxysilane-Functionalized Bioanalytical Platforms for Biosensors and Diagnostics. Chem. Rev. 2014, 114, 11083−11130.
(5) Arghir, I.; Spasic, D.; Verlinden, B. E.; Delport, F.; Lammertyn, J. Improved surface plasmon resonance biosensing using silanized optical fibers. Sens. Actuators, B 2015, 216, 518−526.
(6) Ammar, M.; Smadja, C.; Ly, G. T. P.; Tandjigora, D.; Vigneron, J.; Etcheberry, A.; Taverna, M.; Dufour-Gergam, E. Chemical Engineering of Self-Assembled Alzheimer’s Peptide on a Silanized Silicon Surface. Langmuir 2014, 30, 5863−5872.
(7) Briand, E.; Humblot, V.; Landoulsi, J.; Petronis, S.; Pradier, C. M.; Kasemo, B.; Svedhem, S. Chemical Modifications of Au/SiO2 Template Substrates for Patterned Biofunctional Surfaces. Langmuir 2011, 27, 678−685.
Table 4. Concentrations of the Two ATTO Dyes
dye concentration in mg/mL c(ATTO-550) in mol/L c(ATTO-647N) in mol/L 0.01 1.3× 10⁻⁵ 1.2× 10⁻⁵ 0.25 3.2× 10⁻⁴ 3.0× 10⁻⁴ 0.3 3.8× 10⁻⁴ 3.6× 10⁻⁴ 0.5 6.3× 10⁻⁴ 5.9× 10⁻⁴ 0.7 8.8× 10⁻⁴ 8.3× 10⁻⁴ 1 1.3× 10⁻³ 1.2× 10⁻³ 2 2.5× 10⁻³ 2.4× 10⁻³
(8) Ko, S. H.; Grant, S. A. A novel FRET-based optical fiber biosensor for rapid detection of Salmonella typhimurium. Biosens. Bioelectron. 2006, 21, 1283−1290.
(9) Shi, J. Y.; Tian, F.; Lyu, J.; Yang, M. Nanoparticle based fluorescence resonance energy transfer (FRET) for biosensing applications. J. Mater. Chem. B 2015, 3, 6989−7005.
(10) Molecular Imaging: FRET Microscopy and Spectroscopy; Periasamy, A.; Day, R., Eds.; Oxford University Press: New York, 2005.
(11) FRETFörster Resonance Energy Transfer. From Theory to Applications; Medintz, I. L.; Hildebrandt, N., Eds.; Wiley-VCH: Weinheim, Germany, 2014.
(12) Lakowicz, J. R. Principles of Fluorescence Spectroscopy, 3rd ed.; Springer: New York, N.Y., 2006.
(13) Valeur, B. Molecular Fluorescence: Principles and Applications; Wiley-VCH: Weinheim, New York, 2002.
(14) Hildebrandt, N.; Spillmann, C. M.; Algar, W. R.; Pons, T.; Stewart, M. H.; Oh, E.; Susumu, K.; Diaz, S. A.; Delehanty, J. B.; Medintz, I. L. Energy Transfer with Semiconductor Quantum Dot Bioconjugates: A Versatile Platform for Biosensing, Energy Harvest-ing, and Other Developing Applications. Chem. Rev. 2017, 117, 536− 711.
(15) Clegg, R. M. Förster Resonance Energy Transfer - FRET What Is It, Why Do It, and How It’s Done. In Laboratory Techniques in Biochemistry and Molecular Biology; Gadella, T. W. J., Ed.; Academic Press: Burlington, 2009; pp 1−57.
(16) Anker, J. N.; Hall, W. P.; Lyandres, O.; Shah, N. C.; Zhao, J.; Van Duyne, R. P. Biosensing with plasmonic nanosensors. Nat. Mater. 2008, 7, 442−453.
(17) Brolo, A. G. Plasmonics for future biosensors. Nat. Photonics 2012, 6, 709−713.
(18) Chorsi, H. T.; Zhu, Y.; Zhang, J. X. J. Patterned Plasmonic Surfaces-Theory, Fabrication, and Applications in Biosensing. J. Microelectromech. Syst. 2017, 26, 718−739.
(19) Hill, R. T. Plasmonic biosensors. Wiley Interdiscip. Rev.: Nanomed. Nanobiotechnol. 2015, 7, 152−168.
(20) Li, W. B.; Zhang, L.; Zhou, J. H.; Wu, H. K. Well-designed metal nanostructured arrays for label-free plasmonic biosensing. J. Mater. Chem. C 2015, 3, 6479−6492.
(21) Peng, H. I.; Miller, B. L. Recent advancements in optical DNA biosensors: Exploiting the plasmonic effects of metal nanoparticles. Analyst 2011, 136, 436−447.
(22) Sannomiya, T.; Voros, J. Single plasmonic nanoparticles for biosensing. Trends Biotechnol. 2011, 29, 343−351.
(23) Spackova, B.; Wrobel, P.; Bockova, M.; Homola, J. Optical Biosensors Based on Plasmonic Nanostructures: A Review. Proc. IEEE 2016, 104, 2380−2408.
(24) Law, W. C.; Yong, K. T.; Baev, A.; Prasad, P. N. Sensitivity Improved Surface Plasmon Resonance Biosensor for Cancer Biomarker Detection Based on Plasmonic Enhancement. ACS Nano 2011, 5, 4858−4864.
(25) Stranik, O.; McEvoy, H. M.; McDonagh, C.; MacCraith, B. D. Plasmonic enhancement of fluorescence for sensor applications. Sens. Actuators, B 2005, 107, 148−153.
(26) Tam, F.; Goodrich, G. P.; Johnson, B. R.; Halas, N. J. Plasmonic enhancement of molecular fluorescence. Nano Lett. 2007, 7, 496−501.
(27) Lakowicz, J. R. Radiative decay engineering 5: metal-enhanced fluorescence and plasmon emission. Anal. Biochem. 2005, 337, 171− 194.
(28) Aslan, K.; Gryczynski, I.; Malicka, J.; Matveeva, E.; Lakowicz, J. R.; Geddes, C. D. Metal-enhanced fluorescence: an emerging tool in biotechnology. Curr. Opin. Biotechnol. 2005, 16, 55−62.
(29) Neouze, M. A.; Schubert, U. Surface modification and functionalization of metal and metal oxide nanoparticles by organic ligands. Monatsh. Chem. 2008, 139, 183−195.
(30) Barrios, C. A.; Canalejas-Tejero, V.; Herranz, S.; Urraca, J.; Moreno-Bondi, M. C.; Avella-Oliver, M.; Maquieira, A.; Puchades, R.
Aluminum Nanoholes for Optical Biosensing. Biosensors 2015, 5, 417−431.
(31) Knight, M. W.; King, N. S.; Liu, L. F.; Everitt, H. O.; Nordlander, P.; Halas, N. J. Aluminum for Plasmonics. ACS Nano 2014, 8, 834−840.
(32) Gérard, D.; Gray, S. K. Aluminium plasmonics. J. Phys. D: Appl. Phys. 2015, 48, No. 184001.
(33) Martin, J.; Plain, J. Fabrication of aluminium nanostructures for plasmonics. J. Phys. D: Appl. Phys. 2015, 48, No. 184002.
(34) Lee, K. L.; Hsu, H. Y.; You, M. L.; Chang, C. C.; Pan, M. Y.; Shi, X.; Ueno, K.; Misawa, H.; Wei, P. K. Highly Sensitive Aluminum-Based Biosensors using Tailorable Fano Resonances in Capped Nanostructures. Sci. Rep. 2017, 7, No. 2381.
(35) Li, W. B.; Ren, K. N.; Zhou, J. H. Aluminum-based localized surface plasmon resonance for biosensing. TrAC, Trends Anal. Chem. 2016, 80, 486−494.
(36) Ghenuche, P.; Mivelle, M.; de Torres, J.; Moparthi, S. B.; Rigneault, H.; Van Hulst, N. F.; Garcia-Parajo, M. F.; Wenger, J. Matching Nanoantenna Field Confinement to FRET Distances Enhances Förster Energy Transfer Rates. Nano Lett. 2015, 15, 6193−6201.
(37) de Torres, J.; Mivelle, M.; Moparthi, S. B.; Rigneault, H.; Van Hulst, N. F.; Garcia-Parajo, M. F.; Margeat, E.; Wenger, J. Plasmonic Nanoantennas Enable Forbidden Förster Dipole-Dipole Energy Transfer and Enhance the FRET Efficiency. Nano Lett. 2016, 16, 6222−6230.
(38) Garoli, D.; Calandrini, E.; Bozzola, A.; Ortolani, M.; Cattarin, S.; Barison, S.; Toma, A.; De Angelis, F. Boosting infrared energy transfer in 3D nanoporous gold antennas. Nanoscale 2017, 9, 915− 922.
(39) Usui, T.; Donnelly, C. A.; Logar, M.; Sinclair, R.; Schoonman, J.; Prinz, F. B. Approaching the limits of dielectric breakdown for SiO2 films deposited by plasma-enhanced atomic layer deposition. Acta Mater. 2013, 61, 7660−7670.
(40) Lakowicz, J. R. Radiative decay engineering: Biophysical and biomedical applications. Anal. Biochem. 2001, 298, 1−24.
(41) Barnes, W. L. Fluorescence near interfaces: the role of photonic mode density. J. Mod. Opt. 1998, 45, 661−699.
(42) Choi, B.; Iwanaga, M.; Miyazaki, H. T.; Sugimoto, Y.; Ohtake, A.; Sakoda, K. Overcoming metal-induced fluorescence quenching on plasmo-photonic metasurfaces coated by a self-assembled monolayer. Chem. Commun. 2015, 51, 11470−11473.
(43) Akbay, N.; Lakowicz, J. R.; Ray, K. Distance-Dependent Metal-Enhanced Intrinsic Fluorescence of Proteins Using Polyelectrolyte Layer-by-Layer Assembly and Aluminum Nanoparticles. J. Phys. Chem. C 2012, 116, 10766−10773.
(44) Diao, J. P.; Ren, D. C.; Engstrom, J. R.; Lee, K. H. A surface modification strategy on silicon nitride for developing biosensors. Anal. Biochem. 2005, 343, 322−328.
(45) White, L. D.; Tripp, C. P. Reaction of (3-aminopropyl)-dimethylethoxysilane with amine catalysts on silica surfaces. J. Colloid Interface Sci. 2000, 232, 400−407.
(46) Blum, F. D.; Meesiri, W.; Kang, H. J.; Gambogi, J. E. Hydrolysis, adsorption, and dynamics of silane coupling agents on silica surfaces. J. Adhes. Sci. Technol. 1991, 5, 479−496.
(47) Dietzel, A. Microsystems for Pharmatechnology. Manipulation of Fluids, Particles, Droplets, and Cells; Springer International Publishing, 2016.
(48) Turro, N. J.; Ramamurthy, V.; Scaiano, J. C. Modern Molecular Photochemistry of Organic Molecules; University Science Books: Sausalito, CA, 2010.
(49) Lakowicz, J. R. Principles of Fluorescence Spectroscopy, 3rd ed.; Springer: New York, 2006.
(50) FRETFörster Resonance Energy Transfer. From Theory to Applications; Medintz, I. L.; Hildebrandt, N., Eds.; Wiley-VCH: Weinheim, Germany, 2014; pp 105−164.
(51) Hermanson, G. T. Bioconjugate Techniques, 3rd ed.; Academic Press, Inc.: San Diego, 2013.
ACS Omega Article
DOI:10.1021/acsomega.8b02774
ACS Omega 2018, 3, 18867−18876
(52) Ghenuche, P.; de Torres, J.; Moparthi, S. B.; Grigoriev, V.; Wenger, J. Nanophotonic Enhancement of the Förster Resonance Energy-Transfer Rate with Single Nanoapertures. Nano Lett. 2014, 14, 4707−4714.
(53) de Chaumont, F.; Dallongeville, S.; Chenouard, N.; Herve, N.; Pop, S.; Provoost, T.; Meas-Yedid, V.; Pankajakshan, P.; Lecomte, T.; Le Montagner, Y.; Lagache, T.; Dufour, A.; Olivo-Marin, J. C. Icy: an open bioimage informatics platform for extended reproducible research. Nat. Methods 2012, 9, 690−696.