HAL Id: hal-02881722
https://hal.archives-ouvertes.fr/hal-02881722
Submitted on 30 Jun 2020
HAL is a multi-disciplinary open access
archive for the deposit and dissemination of
sci-entific research documents, whether they are
pub-lished or not. The documents may come from
teaching and research institutions in France or
abroad, or from public or private research centers.
L’archive ouverte pluridisciplinaire HAL, est
destinée au dépôt et à la diffusion de documents
scientifiques de niveau recherche, publiés ou non,
émanant des établissements d’enseignement et de
recherche français ou étrangers, des laboratoires
publics ou privés.
Distributed under a Creative Commons Attribution - NonCommercial| 4.0 International
diverse El Niño responses
Seungmok Paik, Seung-Ki Min, Carley Iles, Erich Fischer, Andrew Schurer
To cite this version:
Seungmok Paik, Seung-Ki Min, Carley Iles, Erich Fischer, Andrew Schurer. Volcanic-induced global
monsoon drying modulated by diverse El Niño responses. Science Advances , American Association
for the Advancement of Science (AAAS), 2020, 6 (21), pp.eaba1212. �10.1126/sciadv.aba1212�.
�hal-02881722�
which drive a large spread of summer monsoon weakening and corresponding precipitation reduction. Two factors are further identified for the diverse El Niño responses. Different volcanic forcings induce systematic differences in the Maritime Continent drying and subsequent westerly winds over equatorial western Pacific, varying El Niño intensity. The internally generated warm water volume over the equatorial western Pacific in the pre-eruption month also contributes to the diverse El Niño development.
INTRODUCTION
Major tropical volcanic eruptions affect the climate system through the injection of sulfur dioxide to the lower stratosphere, which is oxidized to sulfate aerosols. These aerosols then spread out globally and scatter incoming solar radiation, causing a decrease in energy reaching the surface, which induces global surface and tropospheric cooling lasting a few years (1). In addition to the global cooling effect, it is commonly known that explosive tropical volcanic eruptions induce precipitation decreases over global land, particularly over the summer monsoon regions (2–5). The summer monsoon circulation weakening owing to reduced land-sea thermal contrast is suggested as a primary cause of the global monsoon drying after eruptions (2). Multimodel simulations from the Coupled Model Intercomparison Project Phase 5 (CMIP5) (6) have also confirmed that the summer monsoon precipitation decrease is due largely to monsoon circulation weaken-ing along with moisture reduction from volcanic coolweaken-ing, but there remains a large intersimulation spread in the precipitation response to volcanic eruptions (5).
Recent studies have identified different sources of uncertainty in the climatic responses to volcanic eruptions (7). First, the uncertain response can be caused by differences in the imposed volcanic forcing (8–12). Also, ocean condition in the pre-eruption period, including decadal to centennial climate fluctuations (13) and interannual variability, can affect simulated climate responses to volcanic erup-tions (10, 12, 14). Furthermore, different model characteristics can cause intermodel differences in climate response (11). However, previous studies have mainly examined temperature responses, with limited consideration of hydrological responses. Here, we explore the causes of the different precipitation responses among climate model simulations, focusing on the role of diverse El Niño responses to volcanic forcing. Simulations from 35 CMIP5 models (one per model) are used, which were integrated with anthropogenic plus natural forcing (Materials and Methods and table S1). The five largest tropical volcanic eruptions since the 1880s are analyzed, which are
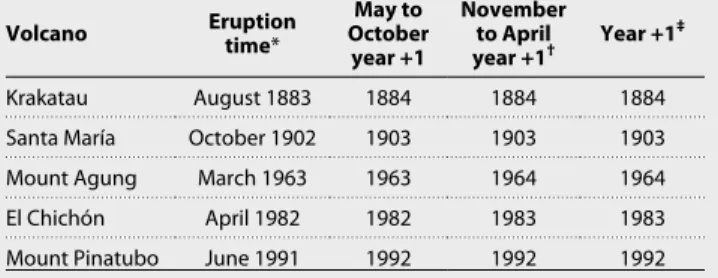
Krakatau (1883), Santa María (1902), Agung (1963), El Chichón (1982), and Pinatubo (1991) (Table 1), and the precipitation responses are calculated as changes relative to pre-eruption 5-year averages, following previous studies (Materials and Methods) (3, 5).
RESULTS
Monsoon precipitation response to volcanic eruptions
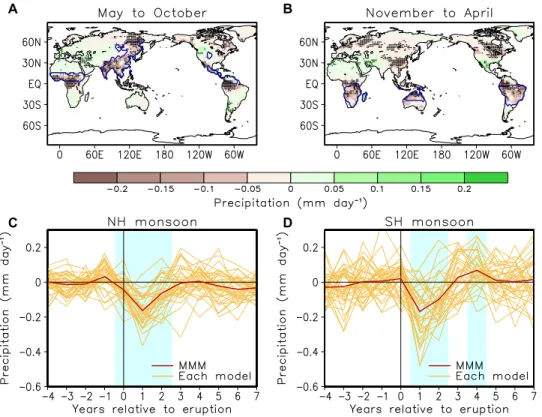
We analyze seasonally averaged monsoon precipitation responses, using half-year seasons: May to October as boreal summer and November to April as austral summer (Materials and Methods). For each season, year +1 is defined as the season that commences after the volcanic eruption (Table 1). The means of years +1 and +2 precipitation anomalies show clear drying responses to volcanic eruptions in boreal and austral summer monsoon regions in the multimodel mean (MMM), with good intermodel agreement in the sign of the responses (Fig. 1, A and B). MMM time series of Northern Hemisphere (NH) and Southern Hemisphere (SH) mean terrestrial monsoon precipitation indicate that global monsoon drying is strongest at year +1 and the statistically significant (P < 0.01, based on a t test) dry-ing persists for about 2 years after eruptions (Fig. 1, C and D). Although most of the models simulate a decrease in monsoon precipitation,
1Division of Environmental Science and Engineering, Pohang University of Science
and Technology, Pohang, Korea. 2Laboratoire des Sciences du Climat et de
l’Environnement, LSCE/IPSL, CEA-CNRS-UVSQ, Université Paris-Saclay, Gif-sur-Yvette, France. 3Institute for Atmosphere and Climate Science, ETH Zurich, Zurich, Switzerland. 4School of Geosciences, University of Edinburgh, Edinburgh, UK.
*Corresponding author. Email: skmin@postech.ac.kr
Table 1. Volcanic eruption dates and year +1 definitions. Volcano Eruption time* October May to
year +1 November to April year +1† Year +1 ‡ Krakatau August 1883 1884 1884 1884
Santa María October 1902 1903 1903 1903
Mount Agung March 1963 1963 1964 1964
El Chichón April 1982 1982 1983 1983
Mount Pinatubo June 1991 1992 1992 1992
*Eruption times are from Sato et al. (23) and Stothers (38, 39). †The year represents the calendar year for January to April rather than November and December. ‡The year represents the year commencing after the volcanic eruption.
on June 30, 2020
http://advances.sciencemag.org/
a large intersimulation spread exists in its amplitude (Fig. 1, C and D). Note small but significant NH drying at year 0 (Fig. 1C), which includes a few months influenced by some volcanic eruptions by definition (Table 1).
El Niño–Southern Oscillation response to volcanic forcing and its impact on monsoon drying
Several studies based on past reconstructions and model simulations reported an El Niño–like response (i.e., equatorial eastern Pacific warm-ing) to volcanic forcing within 2 years after large tropical eruptions (8–10, 14–18), and various mechanisms have been suggested in-cluding the oceanic dynamical thermostat (8), Maritime Continent (MC) drying (10, 17), a southward shift of the intertropical con-vergence zone (16), a recharge oscillation from initial La Niña–like cooling (9), as well as West African monsoon weakening (14). Here, we analyze the multimodel response of the El Niño–Southern Oscillation (ENSO) to volcanic forcing by using the Niño3.4 index, which is sea surface temperature (SST) anomalies over the equatorial eastern Pacific. The tropical mean (20°S to 20°N) SST is removed before analysis (the residual is referred to as RSST) to better identify ENSO varia-tions under volcanically induced overall surface cooling (14, 18).
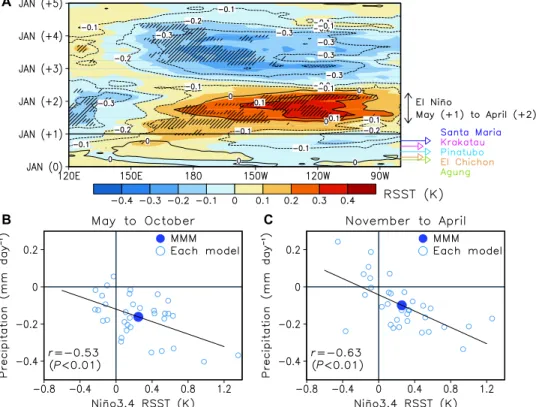
The MMM evolution of equatorial Pacific (5°S to 5°N averaged) RSST over the 5 years after volcanic eruptions are displayed in Fig. 2A. A weak La Niña–like cooling (also with weak model agreement) is seen over the eastern Pacific during autumn and winter immediately after the volcanoes erupted. The greater cooling over the eastern Pacific than central Pacific occurs mainly due to the shallow mixed layer depth in the eastern Pacific as examined by simple mixed layer
temperature budget analysis (fig. S1) (9). Following La Niña, El Niño is initiated during the boreal spring of year +1, and it reaches its peak in the subsequent boreal summer [May (+1) to October (+1)] and winter [November (+1) to April (+2)] with good intermodel agreement. After the boreal spring of year +2, El Niño disappears and a La Niña–like pattern emerges over the central Pacific.
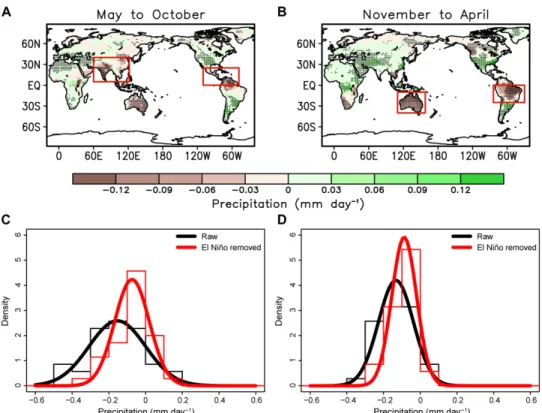
To analyze the influence of El Niño on the decrease in monsoon precipitation, the intersimulation relationship is examined using the Niño3.4 RSST index for boreal summer and winter of year +1 (Fig. 2, B and C). The results indicate a statistically significant (P < 0.01) intersimulation correlation between El Niño intensity and precipitation response for both seasons, which illustrates that one can constrain intersimulation spread of monsoon precipitation responses through understanding and reducing the spread of El Niño responses. Figure 3 (A and B) represents contribution of El Niño to precipitation responses to five volcanic eruptions for both seasons, estimated through linear regression analysis (Materials and Methods). El Niño after volcanic eruptions induces additional drying especially over South Asia, China, and Central America in boreal summer and over South America and Australia in the austral summer (red boxes in Fig. 3, A and B), which is found to be mainly through atmospheric circulation changes (fig. S2) (4, 19, 20). Furthermore, the regional averaged MMM precipitation decrease and the intersimulation spread are significantly reduced when removing the influence of El Niño from each model run based on a simple linear regression (P = 0.01 based on t test and P < 0.01 based on F test) (Fig. 3C). A similar result is obtained when considering global monsoon regions (Fig. 3D) (P = 0.03 based on t test and P = 0.05 based on F test), which supports
A
C
B
D
Fig. 1. Simulated precipitation response to volcanic eruptions. (A and B) Spatial patterns of MMM post-eruption seasonal precipitation responses for 2 years following volcanic eruptions for (A) boreal summer (May to October) and (B) austral summer (November to April). Black dots indicate areas in which more than 70% of models had a consistent sign for the responses. Blue lines delineate summer monsoon regions defined from MMM precipitation. (C and D) Summer monsoon precipitation responses to volcanic eruptions over the (C) NH and (D) SH from the MMM (red) and each model (yellow, averages across five volcanic eruptions). Vertical black line denotes timing of eruptions and light blue shading denotes years in which the MMM response is significant at 1% level, and more than 70% of models had a consistent sign for the responses.
on June 30, 2020
http://advances.sciencemag.org/
robustness of the El Niño influence on precipitation decrease. This global monsoon drying response to volcanically induced El Niño is found to be overall similar in magnitude to that occurring during nonvolcanic years (i.e., responses to internally driven El Niño; fig. S3).
External and internal factors driving diverse El Niño responses
Previous single-model studies suggested that the occurrence of El Niño after volcanic eruptions largely depends on the intensity of the im-plemented volcanic forcing (8, 10) and the pre-eruption ocean con-ditions, which are generated internally (10, 14). Here, we quantify the contribution of each factor to the intersimulation spread in El Niño responses. First, to investigate the impact of the volcanic forcing intensity on the El Niño responses, we compare results from 10 CMIP5 models simulated with Ammann et al. (21, 22) forcing with those from 19 CMIP5 models simulated with Sato et al. (23) forcing (referred to as AM or ST, respectively) (table S1). The AM forcing is known to have greater stratospheric aerosol quantities than ST forcing (21) and hence give rise to greater reflection of incoming shortwave radiation at the top of atmosphere in the models that adopted AM forcing (referred to as AM-forced models) than in ST-forced models (fig. S4, A and B) (24). The two model groups, on average, simulate significantly different El Niño intensities after volcanic eruptions, with stronger El Niño in AM-forced models (P < 0.01, based on a t test) (Fig. 4A), which explains about 29% of intersimulation variance of the Niño3.4 RSST index obtained from all 29 models analyzed based on an analysis of variance (ANOVA; Materials and Methods).
A further comparison of AM- and ST-forced models based on indi-vidual volcanic eruptions confirms the strong relation between the volcanic forcing intensity and the El Niño amplitude (fig. S4, C and D), which addresses concerns about different models between the AM- and ST-forced groups.
It is found that the different El Niño intensities are primarily associated with the difference in equatorial western to central Pacific westerly wind anomalies during El Niño development periods (fig. S5). Previous model studies suggested that MC drying due to rapid land surface cooling would have a crucial role in El Niño initiation through weakening the Walker circulation and inducing westerly wind anomalies (10, 17). During the transition period from the initial La Niña to El Niño [February (+1) to April (+1), early spring], strong MC drying and western-to-central equatorial Pacific westerly winds are observed (Fig. 4B). The MC drying starts even earlier than the early spring but with weaker amplitude due partly to La Niña– induced wetting, and a La Niña–like pattern induces easterly winds over equatorial eastern Pacific (fig. S6). The early spring MC drying (108°E to 140°E, 8°S to 4°N) has a strong intersimulation correla-tion with western-to-central Pacific westerly winds (120°E to 180°E, 5°S to 5°N), implying an important role of MC drying in the westerly wind burst (Fig. 4C). Furthermore, the early spring MC drying and westerly wind are significantly related to the subsequent peak El Niño response, supporting the important role of the MC drying mechanism for El Niño occurrence after volcanic eruptions in these models (fig. S7). Furthermore, AM-forced models have significantly greater MC drying than ST-forced models (P = 0.03, based on a t test) (Fig. 4D),
B C
Fig. 2. Simulated ENSO response to volcanic eruptions, and its relation with precipitation change. (A) Hovmӧller plot for meridional averaged tropical Pacific (5°S to 5°N) RSST (shading) and SST (contours) MMM response to volcanic eruptions. The thick black horizontal line shows the first January after the volcanoes erupted. Black hatching indicates areas in which more than 70% of the models had a consistent sign for the RSST responses. Colored arrows indicate the month that individual eruptions occurred. (B and C) Intermodel relationship of seasonal Niño3.4 RSST and corresponding hemispheric monsoon precipitation responses to volcanic eruptions for the (B) boreal summer and (C) winter in which the peak El Niño occurred from each model (blue open circles). The MMM is plotted as a blue filled circle. The correlation coeffi-cients and corresponding P values calculated using all 35 model values are shown together.
on June 30, 2020
http://advances.sciencemag.org/
which might induce stronger westerly winds and consequently stronger El Niño. Along with the MC drying, a westward downwelling oceanic Rossby wave and a reflected eastward downwelling oceanic Kelvin wave, which are generated from the initial La Niña, seem to help the El Niño initiation (9), but with no significant difference between AM- and ST-forced models (fig. S8). The significant differences between the two model groups are found only after January (+1) (fig. S8F) when the significantly different westerly winds begin to blow (fig. S5C).
To further test robustness of the significant influence of forcing difference, we have conducted a series of sensitivity tests. First, AM and ST forcing data are known to have some differences in meridional aerosol distributions for Agung and El Chichón eruptions (21), which may induce different El Niño responses (16, 17). When redoing our analysis using the other three volcanic eruptions only, results remain unaffected (fig. S9). Different ENSO amplitudes of individual models may contribute to the spread in El Niño responses (fig. S10, A and B). In this regard, excluding models with weaker ENSO amplitudes (fig. S10C) and using normalized Niño3.4 indices and MC precipi-tation based on each model’s climatology (fig. S11, A and B) do not affect main results. Results are also found insensitive to the use of models having minimum three ensemble members to remove possible pre-eruption ocean condition influences and also to the exclusion of three IPSL models that used solar constant change (fig. S11, C to H) (25). Results are similar when applying all criteria together (fig. S12). Regarding the MC drying mechanism, we also find that CMIP5 models have reasonable spatial representation over the MC and that
results are not affected much by different land fraction thresholds (fig. S13). Nevertheless, there is still benefit in refining the resolu-tion to better represent the complex coastlines and potential ocean dynamics around the MC.
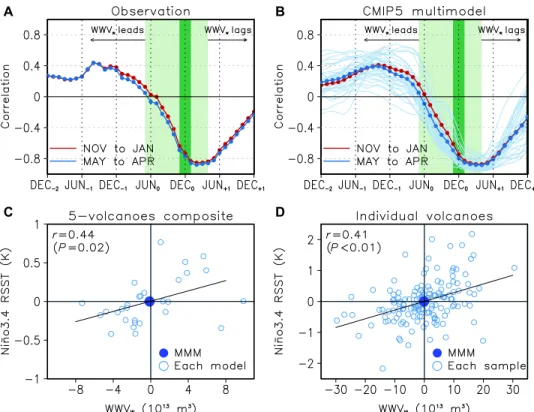
Even when identical volcanic forcing is imposed, large inter-simulation spread remains in the simulated El Niño responses after volcanic eruptions (Fig. 4A). We investigate the influence of internal variability (pre-eruption oceanic conditions) by using equatorial Pacific warm water volume (volume of water above 20°C isotherm), which has been suggested as a good precursor for El Niño development (14, 26, 27). As an earlier El Niño precursor, warm water volume over the equatorial western Pacific (120°E to 155°W, 5°S to 5°N, referred to as WWVW) is used (26, 27). Figure 5A shows lead-lag correlation between
WWVW and Niño3.4 SST from observations. As shown in previous
studies (26, 27), early winter [November (0) to January (+1)] Niño3.4 SST variability has maximum correlation with WWVW in August of
the preceding year (−1). Similar correlations are obtained from May to April average Niño3.4 SST and leading WWVW. The observed strong
relationship between ENSO and WWVW variabilities is well captured
by CMIP5 models, representing importance of preceding year WWVW
states for following year ENSO variability (Fig. 5B). Here, we use WWVW states at the month before the eruption and examine its
impacts on post-eruption El Niño intensities using the 29 AM- and ST-forced models. Note that each group mean Niño3.4 RSST is removed before analysis to remove the influence of volcanic forcing difference. Although we composite five volcanic eruptions, substantial Fig. 3. The influence of El Niño on post-eruption precipitation response and intersimulation spread. (A and B) Contribution of El Niño to precipitation responses to five volcanic eruptions during (A) boreal summer [May (+1) to October (+1)] and (B) austral summer [November (+1) to April (+2)] of peak El Niño occurrence, estimated through linear regression analysis between Niño3.4 RSST and precipitation for each model. Black dots indicate areas in which more than 70% of the models had a consistent sign for the responses. (C and D) Normalized probability density function (PDF) for the precipitation responses to five volcanic eruptions during the boreal summer and winter of peak El Niño occurrence [May (+1) to April (+2)] over (C) monsoon regions within the red boxes in (A) and (B), and (D) whole NH and SH summer monsoon regions, from raw models (black) and those with the El Niño influence removed (red). Each PDF comprises 35 model samples with one data point per model (i.e., the average across the five eruptions).
on June 30, 2020
http://advances.sciencemag.org/
WWVW variabilities remain among AM- or ST-forced models.
Results show a significant intersimulation correlation between WWVW and Niño3.4, indicating that oceanic conditions before the
volcanic eruptions affect El Niño intensities after volcanic eruptions, explaining about 13.8% of the total intersimulation variance (Materials and Methods) (Fig. 5C). Similar results are obtained when consider-ing individual volcanic eruptions (Fig. 5D), supportconsider-ing the robust influence of the pre-eruption ocean state on El Niño responses. Results remain insensitive to the use of normalized El Niño intensity and the use of the whole 35 CMIP5 model ensemble (fig. S14, A to D). Also, results from a single model ensemble (CSIRO-Mk3-6-0), which pro-vides 10 simulations, show the strong influence of pre-eruption WWVW
on El Niño intensities (fig. S14, E and F), suggesting that WWVW is
internally driven.
Our results provide important implications for understanding the observed climatic responses to volcanic eruptions. After the latest three volcanic eruptions, there was a large precipitation re-duction in observations (28), especially at year +1 over austral summer monsoon regions (fig. S15, A and B). El Niño occurred after eruptions [based on RSST from two observations (29, 30); fig. S15C] (14, 18), contributing to the global monsoon drying, but several months earlier (fig. S15D) than CMIP5 simulations (Fig. 2A). An analysis of subsurface ocean temperature (31) indicates that warmer oceanic conditions at time of eruptions over the equatorial Pacific (fig. S15E) may be responsible for the observation-model discrepancy (32).
DISCUSSION
This study identifies a critical cause of the large spread in model- simulated precipitation decrease after tropical volcanic eruptions. We find a strong intersimulation correlation between El Niño intensity and monsoon precipitation responses after volcanic erup-tions and significantly reduced spread in monsoon precipitation responses when removing El Niño influences. This indicates that diverse El Niño responses among model simulations to volcanic eruptions strongly affect the amount of precipitation decrease over global summer monsoon regions. We further demonstrate that a large portion (>42%) of the intersimulation spread in El Niño responses is due to the difference in volcanic forcing implemented (through the MC drying mechanism) and the different pre-eruption oceanic conditions, which represent internal variability (through the recharge oscillator mechanism).
Our finding based on a multimodel ensemble emphasizes that reliable estimates of the magnitude of volcanic forcing are critical and that the systematic consideration of pre-eruption ocean condi-tions is required for more reliable simulacondi-tions or prediccondi-tions of the volcanically induced climate response. In this regard, an endorsed Model Intercomparison Project on the climate response to Volcanic forcing (VolMIP) (7) will help to better understand roles of ocean initial conditions on climate responses and explore associated physical mechanisms. With large initial condition ensemble, it will also be easier to better isolate the model response, which in individual coupled runs is still strongly affected by internal variability. There is also a Fig. 4. The influence of forcing difference on El Niño spread. (A) Distribution of Niño3.4 RSST responses to volcanic eruptions for CMIP5 models using Ammann (AM, blue) and Sato (ST, red) forcing data for El Niño peak periods [May (+1) to April (+2)]. Box and whiskers indicate the first and third quartiles and the minimum and maximum values, respectively. Solid black horizontal lines indicate the multimodel median. Presented P value is obtained from a t test between AM- and ST-forced model responses. (B) Spatial patterns for CMIP5 MMM precipitation (shading) and 850-hPa horizontal wind (vector) responses during the El Niño initiation periods [February (+1) to April (+1)]. Dark blue dots indicate areas in which more than 70% of the models have consistent signs. (C) Scatter diagram of MC (108°E to 140°E, 8°S to 4°N) precipitation responses versus westerly wind responses over western-to-central equatorial Pacific (120°E to 180°E, 5°S to 5°N) during the El Niño initiation periods. Linear regression line and correlation coefficients with corresponding P values based on all 35 models (black) and without one outlier (GFDL-ESM2G; gray square) (red) are presented. (D) Same as (A), but for the MC precipitation response during the El Niño initiation periods.
on June 30, 2020
http://advances.sciencemag.org/
need for experiments with the same model with different forcing datasets to establish the volcanic forcing effects more cleanly. In addition, modeling factors that contribute to the large differences in El Niño and monsoon simulations themselves and their interactions across models need to be explored to further reduce the remaining uncertainty. Further understanding from these efforts would have important impli-cations for improving decadal climate predictions (33) and also assessing the adverse effects from solar geoengineering (34, 35), which have a prolonged rather than short-term stratospheric aerosol forcing.
MATERIALS AND METHODS
Model data
We used multimodel datasets of CMIP5 experiments. Historical model simulations are used, which were integrated with both anthro-pogenic and natural (solar and volcanic) external forcing. A single ensemble member (r1i1p1) is used for 35 models (table S1). All models cover the five largest tropical eruptions since the 1880s, which are analyzed in this study. Among the 35 models, 10 and 19 models are simulated with Ammann et al. (21, 22) and Sato et al. (23) as reference stratospheric volcanic aerosol forcing, respectively. For CMIP5 models, global land area is defined as a region in which more than 25% of a grid cell is covered with land for each model. When we display spatial patterns, model datasets are bilinearly interpolated onto a 2.0° × 2.0° grid and an observational (30) land-sea mask is applied.
Epoch analysis
The five largest explosive tropical volcanic eruptions occurring since the 1880s are analyzed in this study (Table 1). Because these erup-tions occurred in tropical regions, they are suitable for studying the global impact because their aerosols spread out globally over both hemispheres. To minimize the influence of natural internal variability, climate responses are averaged across all five eruptions. The responses are calculated as changes relative to pre-eruption 5-year means without the years containing at least 1 month after volcanic eruptions. We take two approaches to assess the significance of the MMM re-sponses. One is to quantify the level of model agreement in the sign of the responses, for which we define a robust response when at least 70% of the models (at least 25 of 35) have a consistent sign of the responses. The other is to carry out a Student’s t test for area-averaged responses, in which the set of multimodel post-eruption values are compared with pre-eruption 5-year values (36). The Student’s t test is also used to assess significance in the different responses between AM- and ST-forced models. An F test is used to assess statistical significance of the differences in the intermodel spreads.
Monsoon region
For each model, we define monsoon regions as areas in which the annual range (difference between local summer and winter pre-cipitation) of precipitation is greater than 2 mm day−1 and the local summer precipitation exceeds 55% of the annual rainfall (37) during 1871–2000. For the monsoon area, summer is defined as May to
A
C
B
D
Fig. 5. The influence of ocean initial state on El Niño spread. (A and B) Lead-lag correlation of WWVW with November0-January+1 (red) and May0-April+1 (blue) averaged
Niño3.4 SST from (A) observation over 1951–2018 and (B) CMIP5 over 1871–2000. Dark and light green shaded bars indicate November0-January+1 and May0-April+1,
respectively. (B) Thick colored lines represent the MMM, whereas blue thin lines indicate each model results only for using May0-April1 Niño3.4 SST. (C and D) Intermodel
relationship of 29 AM- or ST-forced CMIP5 models between the pre-eruption 1-month WWVW and peak El Niño [Niño3.4 RSST over May (+1) to April (+2)] responses from
(C) a five–volcanic eruption composite and (D) five individual volcanic eruptions from each model (blue open circles). Blue filled circles indicate MMMs. The average Niño3.4 RSST was subtracted for each group of AM- or ST-forced models before analysis to remove the influence of volcanic forcing. Correlation coefficients with corre-sponding P values calculated using all model values of the (C) five-volcano average and (D) five individual volcanoes are presented.
on June 30, 2020
http://advances.sciencemag.org/
as follows. First, the explained variance due to forcing differences is estimated by applying a one-way ANOVA to AM- or ST-forced models. The sum of squares of each group average and total 29 AM- or ST-forced model simulations are calculated, and the percentage of their ratio is defined as explained variance by the forcing difference. Second, for the contribution of ocean initial condition, we calculate the coefficient of determination (r2) between WWV
W and El Niño
responses using 29 model runs after removing each group average (AM or ST forced), and then we adjust the resulting r2 based on the
residual variance (%) from ANOVA to obtain the explained variance of the intersimulation spread in El Niño responses by pre-eruption ocean condition differences.
SUPPLEMENTARY MATERIALS
Supplementary material for this article is available at http://advances.sciencemag.org/cgi/ content/full/6/21/eaba1212/DC1
REFERENCES AND NOTES
1. A. Robock, J. Mao, The volcanic signal in surface temperature observations. J. Climate 8, 1086–1103 (1995).
2. R. Joseph, N. Zeng, Seasonally modulated tropical drought induced by volcanic aerosol. J. Climate 24, 2045–2060 (2011).
3. C. E. Iles, G. C. Hegerl, The global precipitation response to volcanic eruptions in the CMIP5 models. Environ. Res. Lett. 9, 104012 (2014).
4. A. Winter, D. Zanchettin, T. Miller, Y. Kushnir, D. Black, G. Lohmann, A. Burnett, G. H. Haug, J. Estrella-Martínez, S. F. M. Breitenbach, L. Beaufort, A. Rubino, H. Cheng, Persistent drying in the tropics linked to natural forcing. Nat. Commun. 6, 7627 (2015).
5. S. Paik, S.-K. Min, Assessing the impact of volcanic eruptions on climate extremes using CMIP5 models. J. Climate 31, 5333–5349 (2018).
6. K. E. Taylor, R. J. Stouffer, G. A. Meehl, An overview of CMIP5 and the experiment design. Bull. Amer. Meteor. Soc. 93, 485–498 (2012).
7. D. Zanchettin, M. Khodri, C. Timmreck, M. Toohey, A. Schmidt, E. P. Gerber, G. Hegerl, A. Robock, F. S. R. Pausata, W. T. Ball, S. E. Bauer, S. Bekki, S. S. Dhomse, A. N. LeGrande, G. W. Mann, L. Marshall, M. Mills, M. Marchand, U. Niemeier, V. Poulain, E. Rozanov, A. Rubino, A. Stenke, K. Tsigaridis, F. Tummon, The model intercomparison project on the climatic response to volcanic forcing (VolMIP): Experimental design and forcing input data for CMIP6. Geosci. Model Dev. 9, 2701–2719 (2016).
8. J. Emile-Geay, R. Seager, M. A. Cane, E. R. Cook, G. H. Haug, Volcanoes and ENSO over the past millennium. J. Climate 21, 3134–3148 (2008).
9. S. McGregor, A. Timmermann, The effect of explosive tropical volcanism on ENSO. J. Climate 24, 2178–2191 (2011).
10. M. Ohba, H. Shiogama, T. Yokohata, M. Watanabe, Impact of strong tropical volcanic eruptions on ENSO simulated in a coupled GCM. J. Climate 26, 5169–5182 (2013). 11. B. Zambri, A. N. LeGrande, A. Robock, J. Slawinska, Northern Hemisphere winter warming
and summer monsoon reduction after volcanic eruptions over the last millennium. J. Geophys. Res. Atmos. 122, 7971–7989 (2017).
12. D. Zanchettin, C. Timmreck, M. Toohey, J. H. Jungclaus, M. Bittner, S. J. Lorenz, A. Rubino, Clarifying the relative role of forcing uncertainties and initial-condition unknowns in spreading the climate response to volcanic eruptions. Geophys. Res. Lett. 46, 1602–1611 (2019).
6729–6744 (2018).
19. C. F. Ropelewski, M. S. Halpert, Global and regional scale precipitation patterns associated with the El Niño/Southern Oscillation. Mon. Wea. Rev. 115, 1606–1626 (1987). 20. A. Dai, T. M. L. Wigley, Global patterns of ENSO-induced precipitation. Geophys. Res. Lett.
27, 1283–1286 (2000).
21. C. M. Ammann, G. A. Meehl, W. M. Washington, C. S. Zender, A monthly and latitudinally varying volcanic forcing dataset in simulations of 20th century climate. Geophys. Res. Lett. 30, 1657 (2003).
22. C. M. Ammann, F. Joos, D. S. Schimel, B. L. Otto-Bliesner, R. A. Tomas, Solar influence on climate during the past millennium: Results from transient simulations with the NCAR climate system model. Proc. Natl. Acad. Sci. U.S.A. 104, 3713–3718 (2007).
23. M. Sato, J. E. Hansen, M. P. McCormick, J. B. Pollack, Stratospheric aerosol optical depths, 1850–1990. J. Geophys. Res. Atmos. 98, 22987–22994 (1993).
24. S. Driscoll, A. Bozzo, L. J. Gray, A. Robock, G. Stenchikov, Coupled Model Intercomparison Project 5 (CMIP5) simulations of climate following volcanic eruptions. J. Geophys. Res. Atmos. 117, D17105 (2012).
25. J.-L. Dufresne, M.-A. Foujols, S. Denvil, A. Caubel, O. Marti, O. Aumont, Y. Balkanski, S. Bekki, H. Bellenger, R. Benshila, S. Bony, L. Bopp, P. Braconnot, P. Brockmann, P. Cadule, F. Cheruy, F. Codron, A. Cozic, D. Cugnet, N. de Noblet, J.-P. Duvel, C. Ethé, L. Fairhead, T. Fichefet, S. Flavoni, P. Friedlingstein, J.-Y. Grandpeix, L. Guez, E. Guilyardi, D. Hauglustaine, F. Hourdin, A. Idelkadi, J. Ghattas, S. Joussaume, M. Kageyama, G. Krinner, S. Labetoulle, A. Lahellec, M.-P. Lefebvre, F. Lefevre, C. Levy, Z. X. Li, J. Lloyd, F. Lott, G. Madec, M. Mancip, M. Marchand, S. Masson, Y. Meurdesoif, J. Mignot, I. Musat, S. Parouty, J. Polcher, C. Rio, M. Schulz, D. Swingedouw, S. Szopa, C. Talandier, P. Terray, N. Viovy, N. Vuichard, Climate change projections using the IPSL-CM5 Earth System Model: From CMIP3 to CMIP5. Climate Dynam. 40, 2123–2165 (2013).
26. C. S. Meinen, M. J. McPhaden, Observations of warm water volume changes in the equatorial Pacific and their relationship to El Niño and La Niña. J. Climate 13, 3551–3559 (2000).
27. N. Ramesh, R. Murtugudde, All flavours of El Niño have similar early subsurface origins. Nat. Clim. Change 3, 42–46 (2013).
28. T. C. Peterson, R. S. Vose, An overview of the global historical climatology network temperature database. Bull. Amer. Meteor. Soc. 78, 2837–2849 (1997).
29. N. A. Rayner, D. E. Parker, E. B. Horton, C. K. Folland, L. V. Alexander, D. P. Rowell, E. C. Kent, A. Kaplan, Global analyses of sea surface temperature, sea ice, and night marine air temperature since the late nineteenth century. J. Geophys. Res. Atmos. 108, 4407 (2003).
30. B. Huang, P. W. Thorne, V. F. Banzon, T. Boyer, G. Chepurin, J. H. Lawrimore, M. J. Menne, T. M. Smith, R. S. Vose, H.-M. Zhang, Extended reconstructed sea surface temperature, version 5 (ERSSTv5): Upgrades, validations, and intercomparisons. J. Climate 30, 8179–8205 (2017). 31. S. A. Good, M. J. Martin, N. A. Rayner, EN4: Quality controlled ocean temperature
and salinity profiles and monthly objective analyses with uncertainty estimates. J. Geophys. Res. Oceans 118, 6704–6716 (2013).
32. S. Self, M. R. Rampino, J. Zhao, M. G. Katz, Volcanic aerosol perturbations and strong El Niño events: No general correlation. Geophys. Res. Lett. 24, 1247–1250 (1997). 33. C. Timmreck, H. Pohlmann, S. Illing, C. Kadow, The impact of stratospheric volcanic
aerosol on decadal-scale climate predictions. Geophys. Res. Lett. 43, 834–842 (2016). 34. B. Kravitz, A. Robock, S. Tilmes, O. Boucher, J. M. English, P. J. Irvine, A. Jones,
M. G. Lawrence, M. MacCracken, H. Muri, J. C. Moore, U. Niemeier, S. J. Phipps, J. Sillmann, T. Storelvmo, H. Wang, S. Watanabe, The Geoengineering Model Intercomparison Project Phase 6 (GeoMIP6): Simulation design and preliminary results. Geosci. Model Dev. 8, 3379–3392 (2015).
35. S. Tilmes, J. Fasullo, J.-F. Lamarque, D. R. Marsh, M. Mills, K. Alterskjær, H. Muri, J. E. Kristjánsson, O. Boucher, M. Schulz, J. N. S. Cole, C. L. Curry, A. Jones, J. Haywood, P. J. Irvine, D. Ji, J. C. Moore, D. B. Karam, B. Kravitz, P. J. Rasch, B. Singh, J.-H. Yoon, U. Niemeier, H. Schmidt, A. Robock, S. Yang, S. Watanabe, The hydrological impact
on June 30, 2020
http://advances.sciencemag.org/
of geoengineering in the Geoengineering Model Intercomparison Project (GeoMIP). J. Geophys. Res. Atmos. 118, 11036–11058 (2013).
36. E. M. Fischer, J. Luterbacher, E. Zorita, S. F. B. Tett, C. Casty, H. Wanner, European climate response to tropical volcanic eruptions over the last half millennium. Geophys. Res. Lett. 34, L05707 (2007).
37. P.-c. Hsu, T. Li, H. Murakami, A. Kitoh, Future change of the global monsoon revealed from 19 CMIP5 models. J. Geophys. Res. Atmos. 118, 1247–1260 (2013).
38. R. B. Stothers, Major optical depth perturbations to the stratosphere from volcanic eruptions: Pyrheliometric period, 1881–1960. J. Geophys. Res. Atmos. 101, 3901–3920 (1996).
39. R. B. Stothers, Major optical depth perturbations to the stratosphere from volcanic eruptions: Stellar extinction period, 1961–1978. J. Geophys. Res. Atmos. 106, 2993–3003 (2001). 40. R. Seager, N. Naik, G. A. Vecchi, Thermodynamic and dynamic mechanisms for large-scale
changes in the hydrological cycle in response to global warming. J. Climate 23, 4651–4668 (2010).
41. H. Hersbach, B. Bell, P. Berrisford, A. Horányi, J. M. Sabater, J. Nicolas, R. Radu, D. Schepers, A. Simmons, C. Soci, D. Dee, Global reanalysis: Goodbye ERA-Interim, hello ERA5. ECMWF Newsl. 159, 17–24 (2019).
42. V. Eyring, T. G. Shepherd, D. W. Waugh, Stratospheric processes and their role in climate: SPARC report on the evaluation of chemistry-climate models. WCRP-132, WMO/TD-1526, SPARC Report 5 (2010).
43. G. L. Stenchikov, I. Kirchner, A. Robock, H.-F. Graf, J. C. Antuña, R. G. Grainger, A. Lambert, L. Thomason, Radiative forcing from the 1991 Mount Pinatubo volcanic eruption. J. Geophys. Res. Atmos. 103, 13837–13857 (1998).
44. R. J. Andres, A. D. Kasgnoc, A time-averaged inventory of subaerial volcanic sulfur emissions. J. Geophys. Res. Atmos. 103, 25251–25261 (1998).
Acknowledgments: We would like to thank the World Climate Research Programme’s Working Group on Coupled Modelling, which is responsible for CMIP, and the climate modeling groups for producing and making their model output available. Funding: This study was supported by a National Research Foundation of Korea (NRF) grant funded by the South Korean government (MSIT; grant 2017R1A2B2008951). A.P.S. was funded by the UK Natural Environmental Research Council via the grant Vol-Clim (NE/S000887/1) and under the Belmont forum, Grant PacMedy (NE/P006752/1). Author contributions: S.-K.M. and S.P. conceived the research and conducted the analysis. S.P. and S.-K.M. led the writing. C.E.I., E.M.F., and A.P.S. have contributed to the analysis and writing. Competing interests: The authors declare that they have no competing interests. Data and materials availability: All data needed to evaluate the conclusions in the paper are present in the paper and/or the Supplementary Materials. Additional data related to this paper may be requested from the authors.
Submitted 6 November 2019 Accepted 18 March 2020 Published 22 May 2020 10.1126/sciadv.aba1212
Citation: S. Paik, S.-K. Min, C. E. Iles, E. M. Fischer, A. P. Schurer, Volcanic-induced global monsoon drying modulated by diverse El Niño responses. Sci. Adv. 6, eaba1212 (2020).
on June 30, 2020
http://advances.sciencemag.org/
MATERIALS
REFERENCES
http://advances.sciencemag.org/content/6/21/eaba1212#BIBL
This article cites 43 articles, 1 of which you can access for free
PERMISSIONS http://www.sciencemag.org/help/reprints-and-permissions
Terms of Service
Use of this article is subject to the
is a registered trademark of AAAS. Science Advances
York Avenue NW, Washington, DC 20005. The title
(ISSN 2375-2548) is published by the American Association for the Advancement of Science, 1200 New Science Advances
License 4.0 (CC BY-NC).
Science. No claim to original U.S. Government Works. Distributed under a Creative Commons Attribution NonCommercial Copyright © 2020 The Authors, some rights reserved; exclusive licensee American Association for the Advancement of
on June 30, 2020
![Fig. 4. The influence of forcing difference on El Niño spread. (A) Distribution of Niño3.4 RSST responses to volcanic eruptions for CMIP5 models using Ammann (AM, blue) and Sato (ST, red) forcing data for El Niño peak periods [May (+1) to April (+2)]](https://thumb-eu.123doks.com/thumbv2/123doknet/13366393.403494/6.891.175.713.85.484/influence-forcing-difference-distribution-responses-volcanic-eruptions-ammann.webp)