HAL Id: halshs-00588060
https://halshs.archives-ouvertes.fr/halshs-00588060
Preprint submitted on 22 Apr 2011
HAL is a multi-disciplinary open access archive for the deposit and dissemination of sci-entific research documents, whether they are pub-lished or not. The documents may come from teaching and research institutions in France or
L’archive ouverte pluridisciplinaire HAL, est destinée au dépôt et à la diffusion de documents scientifiques de niveau recherche, publiés ou non, émanant des établissements d’enseignement et de recherche français ou étrangers, des laboratoires
Should market liberalization precede democracy? Causal
relations between political preferences and development
Pauline Grosjean, Claudia Senik
To cite this version:
Pauline Grosjean, Claudia Senik. Should market liberalization precede democracy? Causal relations between political preferences and development. 2007. �halshs-00588060�
WORKING PAPER N° 2007 - 17
Should market liberalization precede democracy?
Causal relations between political preferences
and development
Pauline Grosjean Claudia Senik
JEL Codes: H1, H5, P2, P3, P5, O1, O12, O57 Keywords: market and democracy, sequencing of
development, transition economies, attitudinal variables, cross-countries survey
PARIS
-
JOURDAN SCIENCES ECONOMIQUESLABORATOIRE D’ECONOMIE APPLIQUÉE - INRA
48,BD JOURDAN –E.N.S.–75014PARISTÉL. :33(0)143136300 – FAX :33(0)143136310
“
Should Market Liberalization precede Democracy? Causal Relations
between Political Preferences and Development”
Pauline Grosjean1 and Claudia Senik2
21 June 2007
Summary
This paper is dedicated to the relation between market development and democracy. We distinguish contexts and preferences and ask whether it is true that the demand for democracy only emerges after a certain degree of market development is reached, and whether, conversely, democratization is likely to be an obstacle to the acceptation of market liberalization. Our study hinges on a new survey rich in attitudinal variables: the Life in Transition Survey (LITS) conducted in 2006 by the European Bank for Reconstruction and Development and the World Bank, in 28 post-Transition countries.
Our identification strategy consists in relying on the specific situation of frontier-zones. We find that democracy enhances the support for market development whereas the reverse is not true. Hence, the relativist argument according to which the preference for democracy is an endogenous by-product of market development is not supported by our data.
Keywords: market and democracy, sequencing of development, Transition economies,
attitudinal variables, cross-countries survey.
JEL Codes: H1, H5, P2, P3, P5, O1, O12, O57.
1 European Bank for Reconstruction and Development, [email protected]
2 Paris School of Economics, University Paris Sorbonne, IUF and IZA. Address: PSE, 48 bd Jourdan, 75014 Paris, France. [email protected]
1. Introduction
One of the unexpected side-effects of China’s spectacular emergence is the diffusion of a new conventional wisdom concerning the sequencing of political and economic reforms in developing countries. Essentially, the idea is that early democratization can be harmful. The continued hold of the Chinese Communist Party over political power is taken to be a positive ingredient in the construction of a viable market economy, as opposed to the erratic reform path experienced by Central and European countries of the former socialist block, which predominantly chose rapid economic and political liberalization in the 1990’s (Dewatripont and Roland, 1992; Godoy and Stiglitz, 2006; Roland and Verdier, 2003). Another example is Latin America, where pervasive economic crises seem to illustrate the danger that democracy can be an obstacle to the development of the market when leaders have to impose unpopular reforms while being responsible in front of their constituencies. It follows that the optimal route is to develop market institutions in a first stage of development, and consider democratization at a latter stage.
Pushing the argument one step further, some authors have argued that the desire for political freedom and democratic institutions does not arise until the countriesy reach a certain degree of material comfort and market liberalization (Lipset, 1959; Miller et al. 1996). Hence, the argument goes, not only is it preferable to postpone democracy to advanced stages of a country’s economic development, but this sequence also meets citizens’ preferences.
Some observers may find it difficult to reconcile this relativist statement with the recent vivid public demonstrations in favor of democratization in countries of the Commonwealth of Independent States (CIS), e.g. Belarus, Georgia, Ukraine, and in China. In terms of scientific evidence, the empirical literature devoted to the relationship between market and democracy
remains rather inconclusive. Most studies are unable to draw a clear direction of causality because of the interdependent dynamics followed by the two variables along the history of any given country. Hence, in spite of the strong dynamism of this research field, the scientific consensus on these issues is still in the making.
This paper tries to contribute to the understanding of the relationship between political preferences and development. We exploit a new set of micro evidence from an original survey of 28 Transition economies, the Life in Transition Survey, which was implemented in summer 20063.
We first try to isolate the causal relation running from actual democratization to the demand for market liberalization. Our empirical identification strategy relies on the specificities of frontier-zones. Our main assumption is that people who live in an integrated frontier-zone share the same experience of the market and, often, the same historically inherited “cultural attitudes” towards the market and democracy, on both sides of the frontier. This is particularly plausible for the (often artificial) frontiers of the former USSR and in some formerly integrated regions such as the Ottoman Empire or the Austro-Hungarian Empire. This assumption is tantamount to keeping constant the usually omitted variables that bias any estimation of the relation between market development and the support to democracy.
Reciprocally, we try to assess the relation that runs from actual market development to popular demand for democracy. Here, we exploit within-country regional variations. We rely on the fact that the degree of market development is notoriously different across regions of the survey; whereas people who live in the same country share a common experience of democracy. Hence, we regress the preference for democracy on an index of regional market development, reflecting the share of the modern sector of the economy, which is composed of private and smaller size firms. We also compare the support to democracy of the various frontier-zones inside a given country, on the grounds that market development at borders are partly exogenous, as it is influenced by the neighbouring region’s market development.
The main result of this paper is that, contrary to leading conjectures, democracy appears to generate some popular support for the market, while economic liberalization does not clearly
raise the support for democracy. To be sure, this finding only suggests that democracy increases the subjective support to the market; it does not mean that democracy does not complicate the task of reformers, with the risk of impeding market liberalization. Our results also cast doubt on the idea that democracy would naturally emerge as a by-product of capitalism. Even if the demand for democracy increases with individual income, market liberalization as such does not seem to be sufficient to trigger the demand for democracymodernisation of the industrial structure of the economy seems to have no impac seems to vest the interests of the poor in politics and make them more supportive of democracy. A minima, the take-home message of the paper is that one cannot advocate the preferences of citizens to postpone the construction of democratic institutions.
Section 2 discusses the background literature in the reciprocal linkages between economic and political liberalization. Section 3 presents the identification strategies. Section 4 presents the data and Section 5 discusses the results. Section 6 concludes.
2. Background
The conventional wisdom concerning the lLinkages between political and economic systems and in particular between democratisation and market liberalisation haves been widely studiedchanged over time. . While the eaearly XIXth century was predominantly skeptical about septicism about the compatibility between democracy and capitalism (see J.S. Mill or K. Marx4), today, the consensuswisdom is that development leads to both a market economy and to political democracy5 with anteriority of the market. The idea that “modern democracy is a by-product of the capitalist process”6 dates back to Toqueville (1839), who stressed that market development is conducive to democracy because it provides the “social space within which individuals, groups and entire institutional complexes can develop independent of state control”7. Lipset (1959) claims that: “industrialization, urbanization, high educational standards and a steady increase in the overall wealth of society [are] a basic condition
4 Mill, John Stuart. Considerations on Representative Government. In Utilitarianism, Liberty, and
Representative Government, ed. H. B. Acton. London: Dent, 1860. Karl Marx (1867) Capital, Vol. 1 A Critique of Political Economy, ed. Penguin Classique London, 1990.
5 This idea was namely Hence the concept of the “End of History” (Fukuyama 1992 ). 6 J.A. Schumpeter, Capitalism, Socialism and Democracy (New York, Harper and Bros., 1942).
sustaining democracy”.
Historically, market economies have emerged existed both in the context of democracy and autocratic regimes, but there is no example of a socialist economy under within a democratic regime has been observed. This observation lies at the foundation of a certain “instrumental” view of political regimes is . In the context of the political economy literature of Transition (Aslund et al., 2001; Dewatripont and Roland, 1992; Roland, 2001; Roland and Verdier, 2003), researchers have focuseds on the question of how to overcome the on political opposition to reforms, and in particular the opposition to economic liberalization. This literature discusses the relative advantages and drawbackspros and cons of democracy and versus authoritarianism for from the point of view of facilitating economic reforms and growth (for a review, see Roland, 2001; Przeworski and Limongi, 1993). Here, the causality runs from the political regime to the development of the market.
Beyond these theoretical models, what can we learn from empirical studies? To date, the existing empirical literature does not offer many reliable clear-cut results. concerned with the linkages between democracy and economic liberalisationMany studies focus on the aggregate relationship between democracy or economic liberalization and economic growth. Concerning the relation running from political liberalization to growth, Barro (1990) suggests that the relationship between GDP and democracy is curvilinear and Minier (2001) finds that the probability of that emergence of a democratic movement emerges in an authoritarian regime is increasing in income per capita up to a level of approximately US$5000. However, these results are contradicted by However, Przeworski (2004), who finds that transition from authoritarian regime to democracy is not influenced by income levels, once initial conditions are controlled for8. He argues that the observed relationship between income and democratic political regimes is due almost exclusively to the. Przeworski and Limongi (1993) review 18 studies and 21 findings of concerning the impact of political systems on growth, among which eight are in favor of democracy, eight in favor of authoritarianism and five conclude to no difference. As underlined by Persson and Tabellini (2007b), “the findings are essentially all over the place” with regards to whether democracy shapes economic development (see
8 Przeworski argues that the observed relationship between national income and democratic regimes is an artefact; it is due almost exclusively to the higher durability of any political regime under a higher national
also, among many, Barro, 1990; Burkhart and Lewis-Beck, 1994; Helliwel, 1994; Leblang, 1997; Przeworski, 2004).
The study of the reverse causality is similarly unconvincing and. Przeworski and Limongi (1993) argue that most of these empirical studies suffer from a simultaneity bias. Evidence based on cross- section aggregate data suggests that education and income are the strongest channels towards democracy (La Porta et al., 1999). However, in two related papers, Acemoglu, Johnson, Robinson and Yared (2004a, 2004b) invalidate this view finding by showing that the impact of education and income becomes insignificant once within-country variation and endogeneity of income are taken into account. The authors conclude that cross-section correlations between democracy and education or income are due to an omitted variable bias. This omitted variable, they suggest, consists of the initial institutions that have presided over the country’s development (Acemoglu, Johnson and Robinson, 2001). This problem of omitted variable is pervasive in this entire literature.
Some authors have tried to overcome this obstacle using matching, propensity scores and differences in differences methods, exploiting both the cross-country and time series variations in aggregate datasets. Persson and Tabelini (2007a) show that democratic regimes have an important impact on growth but that this relation is conditional on the heterogeneous characteristics of the countries under study. Persson and Tabellini (2007b) show that longer time spans of democracy are a factor of economic development. Persson and Tabellini (2006) suggest that some forms of democracy (presidential) are more development friendly than others (parliamentary)². Rodrick and Wacziarg (2005) find that democratic transitions exert a positive impact on growth in the short run, especially in the poorest countries; it also reduces economic volatility. Other papers, e.g. Sachs and Werner (1995) or Wacziarg and Welch (2003) have tried to elucidate the relation from economic liberalization to growth.
A few papers address directly the question of the interplay between democratization and economic liberalization using aggregate data. Among those, Giavazzi and Tabellini (2005) find that both kinds of reforms have mutual feedbacks on one another, although causality is more likely to run from democratization to economic liberalization. However, they conclude to the superiority of a sequencing based on market liberalization first, from the point of view of growth: “Countries that first liberalize and then become democracies do much better than countries that pursue the opposite sequence”.
Another set of studies has focused on the support for democracy and market economy at based on the individual datalevel. At the individual level, Surveys try ies to confirm the predictions that individuals who support a free market economy are hypothesised to be those more likely to embrace democratic principles (Mc Intosh et al., 1994). The channels of the impact of economic development on democracy identified by theThis can be because it is in the best self-interest of the wealthiest individuals to support democracy: as they benefit from market development, they seek political representation to protect their newfound economic opportunities. Alternatively, modernisation theory, such as education, income, being an urban resident or an entrepreneur, should translate at the individual level and should constitute the main determinants of the demand for democracy. The alternative hypothesis to the self-interest demand for democracy is that attitudes towards the market economy can be determined by the political socialization of individuals and that the demand for democracy responds to symbolic motives (Citrin et al, 1990; Easton, 1965).
In the case of Russia and Ukraine at the beginning of the 1990’s, Gibson (1996) find support for the latter hypothesis and argues that economic values are not primary and that democratic institutions are valued for their intrinsic characteristics. In the case of Russia, it even appears that attitude towards democratic institutions have a greater influence on economic attitudes than the other way around. HoweverW, with the exception of Finifter and Mickiewicz (1992), most studies related to Central and Eastern Europe find evidence in accordance with the modernisation theory and conclude that the support for democracy and democratic institutions is highest among the better educated urban residents (Brym, 1996; Mason, 1995; Mc Intosh et al. 1992; Miller et al. 1994 and 1996;) and those most satisfied with the performance of the economy (Mishler and Rose, 1994). However,
However,most although studies based on of individual data do not suffer from the attrition and, to a certain extent, from the selection bias put forward by Przeworski and Limongi (1993), they nonetheless suffer from an identification problem similar simultaneity bias.. This is contained in the very idea of the modernization theory that If therethe same development dynamics is a common opinion trend toward favoring both democracy and a market development.economy, and if economic liberalisation implies political liberalisation, which itself promotes economic freedom, the study of the determinants of political and economic
liberalisation, whereas at the aggregate or at the individual level, suffer from a simultaneity bias that hinders any empirical assessment. Recovering Assessing the direction of causality between the advancement of economic freedom and that the degree of political freedom appears to be an almost impossible exercise in the absence of a valid exogenous instrument, which needs to be traced back at least as far back as the legal or colonial origins (Acemoglu et al.., 2001).
In this paper, we try to overcome this simultaneity bias. We do not pretend to explain the long run causality between democracy and market development; instead we restrict our interest to the short run causality running from the state of market development to the demand for democracy, and, conversely, from political democracy to the support to the market.In this paper, we however propose to study how the state of one dimension influences the demand for the other dimension, by using sources of exogeneity in the state of economic or political freedom. We ask whether it is true that the demand for democracy only emerges after a certain degree of market development is reached, and whether, conversely, democratization is more likely to be an obstacle or an ingredient to citizens’ support to market liberalization.
3. Identification strategy
We address the general question of the direction of causality between market and democracy by distinguishing contexts and preferences. We try to assess the direction of causality from existing democracy to the support for the market and from existing market liberalization to the support for democracy.In order to discern the direction of causality between market and democracy, one would ideally need to rely on a situation in which one variable is exogenously “frozen” while the other randomly takes different values across countries. Of course, in the real world there are many reasons why this ideal setting could never exist. On the contrary it is obvious that market liberalization and democracy are processes that follow
highly intertwined dynamic evolutions and depend on countries’ historical background. Even in the case of Transition countries, where democracy and the market have been both abolished by the communist experience, the development and the popular support to these institutions have evolved in parallel since 1989, probably under the influence of common factors. As an illustration, Figure 1 shows the strong general cross-country relation between the average support to the market and the average support to democracy in the 28 countries covered by the Life in Transition Survey. Regional differences are also visible. In particular, countries of Central and Eastern Europe and the Baltics, which are both the closest to a free market and a full-blown democracy, are the most supportive of the two processes. Identical factors, such as the perspective of accessing the European Union, are likely to have driven the two attitudes simultaneously.
Figure 1. Support for the Market and for Democracy 9
Czech rep Estonia Hungary Latvia Lithuania Poland Slovakrep Slovenia Albania Bosnia Bulgaria Croatia Fyrom Montenegro Romania Serbia Armenia Azerbaijan Belarus Georgia Kazakhstan Kyrgyzstan Moldova Russia Tajikistan Ukraine Uzbekistan Mongolia 40 50 60 70 80 Su pp or t f o r D e m o c rac y 30 40 50 60 70
Support for the Market
Central and eastern Europe and the Baltics South eastern Europe Commonwealth of independent States
Obviously, using the pooled cross-section data of the LITS survey and running a naive regression of the support to democracy on an index of market development, or of the support to the market on a democratic index, would run into serious identification problems. The relation put in evidence would not readily be interpretable in terms of causality as it would be subject to the influence of omitted variables affecting both market development and democracy. We propose two different identification strategies in order to isolate the direction of causality from market development to the support to democracy and vice-versa.
3.1.The identification problem
How can one hope to discern the direction of causality between market and democracy? Ideally, one would like to be able to rely on a situation in which one variable is exogenously “frozen” while the other randomly takes different values across countries. Of course, in the
real world there are many reasons why this ideal setting could never exist and is just meaningless. The most important reason is that it would be hard to convince anyone that the reason why the market or democracy is underdeveloped in some countries is exogenous. The reasons that hindered the development of democracy cannot be completely independent from the determinants of market liberalization and vice-versa. In other words, it is hard to imagine that in the real world, the state of democracy and market development are (i) independent and (ii) the fruit of exogenous random shocks. On the contrary it is obvious that market liberalization and democracy are processes that follow highly intertwined dynamic evolutions and depend on the countries’ historical backgrounds.
Can the experience of communism and the following period of Transition be considered as of some help with this regard? To be sure, democracy and the market have been both abolished by the communist experience and one could consider as a crude approximation that all the countries of the former Soviet block and its satellites started at the same point in 1989. Of course, this is not quite true and it is well-known that there were marked differences between for instance Poland and Czechoslovakia, the former being more decentralized and the second more strictly conform to the pure Soviet model. But even if all countries of the former communist block were considered identical up to 1989, the evolution that they have known since that date cannot be thought to be exogenous; the development of market and democracy has evolved in parallel since 1989, probably under the influence of common factors. However, the specificity of the socialist block is the parallelism in the history of the constituent countries. Diverging forces have been unleashed only since the early 1990’s, and in contexts that continue sharing many similarities due to the identical Transition process that is going on. Hence, comparing the attitudes towards the market and the democracy of these countries is less farfetched than in other contexts. In more technical terms, when analyzing the relation between democracy and the market, the risk is high of omitting important variables, but the variation of these omitted variables is certainly smaller inside the considered group of Transition countries than it would be in a more general cross-country comparative study.
Figure 1 in annex shows that, despite the strong positive correlation between support to the market and support to democracy in all transition countries, there are some noticeable differences among the countries in Central and Eastern Europe and the Baltics (CEB) and
towards a free market democracy are also much more supportive of the two values. Of course, the relationship between preferences for democracy and for the market is not very informative, as identical factors, such as, in this example, adhesion to the European Union, are likely to drive the two attitudes simultaneously.
[*autre idée: utiliser UE non UE en supposant que adhésion à l’UE est exogène.]
de toutes façons il faut faire des stat des à un moment dans l’article pour voir si demo+ Ù market+ et le lien avec la situation avant 1989 et le lien avec la perspective d’adhésion à l’UE.
Similarly, in spite of the comforting thought about the common fate of Transition countries, and even if differentiation factors, such as EU adhesion can be assumed to be exogenous, using the pooled cross-section data and running a regression of the support to democracy on an index of market development would run into serious identification problems. The relation put in evidence would:
-not readily be interpretable in terms of causality but rather as a mere co-variation between the two variables
-be subject to the influence of omitted variables susceptible of affecting both market development and democracy
-be subject to reverse causation problems.
Of course this is one of the usual problems of cross-section analysis, which researcher have traditionally tried to surmount by looking for an “instrument” of either variable, i.e. looking for some exogeneity that helps exiting this reasoning circularity. We propose two different identification strategies in order to isolate the direction of causality from market development to the support to democracy and vice-versa.
3.2.3.1. Democracy and the dDemand for the market
Is a higher degree of democracy an obstacle to reform, or does it increase the support to market development? In order to address this question, we need to overcome the problem that people’s support to the market may be due both to the degree of democracy and to the degree of the market development itself, both variables being likely to develop at a parallel pace. More generally, it can be suspected that common “cultural factors” influence the national attitudes towards both the market and democracy.
differential attitudes to the market for people who, in an exogenous way, are exposed to different levels of democracy, although they are exposed to the same degree of market liberalization development.
In other words, one would like to estimate the naive equation (1):
Ssupport for market ij = a0 + a1 degree of development of democracy ij + a2 Xij + a3Cj + ui (1) but suspects that the true relation is (1’):
Ssupport for market ij = a0 + a1 degree of development of democracy ij + a3 degree of
development of market ij + a2 Xij + a3Cj + ui (1’)upport for
market ij = a0 + a1 degree of development of democracy j + a2 degree of developmentof market
j + a3 cultural factors j + a4 Xij + a5 Cj + ui (1’)
where Xijj stands for socio-demographic characteristics of the respondent i in country j, Cj is a vector of country dummies and ui the error term.
Our strategy consists in trying to find a way of keeping the second and third terms of equation (1’) constant. As our analysis is based on individual data, we need to find people who, in an exogenous way, are exposed to different levels of democracy but to the same degree of market development and who share the same “culture” regarding the politico-economic system.
Our strategy consists in trying to find a way of keeping the third term of equation (1’) constant.
Our The idea is to match observations in frontier-zones. We make use of the spatial integration of regions which stand on both sides of a given frontier, at the immediate proximity of the border. We assume that people who live in open the close vicinity of a frontier-zones share the same culture and the same perception of market development even if though they live on both sides of itthe frontier.
interregional trade in frontier zones. Secondly, it is well known that in such regions, when it is possible, people do not hesitate, when it is possible, to cross the frontier to go to working, to buy their daily shopping, or to buy cheaper appliances or and cars, hence regional integration is a fact of their everyday life, which certainly influences their perception of the market when lower local tax rates make it advantageous. MoreoverThird, in the specific case of the 21 former Soviet Republics, regional integration was a hard fact until the early 1990’s: under the socialist system, the economy of the Soviet Republics was submitted to the centralized organization of material resources by the Soviet plan based in Moscow. Many countries, in particular in Central Asia and the Caucasus, have inherited from the Soviet Union an integrated network of infrastructures, which is aare positive factors of trade and regional integration (Broadman, 2005). We thus assume that inhabitants of a certaingiven frontier-zones share the same experience of the market even when they live in different countries with different political institutions.
Clearly, the validity of our assumption relies on the level of market integration across the borders of the surveyed countries. We thus distinguish open frontiers from those that are closed or restricted because of political conflicts or geographical obstacles. We also check that the degree of market development is more similar in adjacent frontier-zones than it is in pairs of adjacent countries.
Market integration at frontier-zones is useful to eliminate the risk that the support to the market, that is measured reflects the actual development of the market. What about the “cultural” omitted variable? A first element is that the citizens of the former Socialist block, and in particular of the Soviet Union, have been living for 45 to 70 years in a common political system marked by strong official ideological values concerning the market. Hence, we can assume that they share a common heritage in terms of attitudes towards the market (Alesina and Fuchs-Schundeln, 20065). Beyond this remark, we rely on the fact that current frontiers of many transition countries, especially countries of the CIS, are more or less artificial divisions of formerly integrated jurisdictions, whose citizens have developed common attitudes concerning both market development and political freedom (e.g. the Austro-Hungarian empire, the Ottoman Empire, etc.). The very idea of “culture” and more specifically “national culture” is that countries’ past experience continues to exert some
effects in the long run10. We thus rely on the idea that citizens of countries which have belonged to formerly highly integrated zones share a common culture, i.e. common inherited general attitudes towards the market and democracy.
There are some subsets of Transition countries in which this assumption is particularly appealing. Countries that have belonged to the Ottoman Empire (Albania, Armenia, Bosnia, Bulgaria, Macedonia, Montenegro, Romania and Serbia) have developed under the same rule for several centuries (1299-1922). The same can be said about countries of the Austro-Hungarian Empire (Croatia, Czech Republic, Hungary, Slovak Republic and Slovenia, 1867-1918), countries of the former Polish Empire (which included Poland, Ukraine, Lithuania, Belarus and parts of Russia, 1569-1795), countries of the USSR (1922-1991), or countries of the Former Yugoslavia (Bosnia, Croatia, Macedonia, Montenegro, Serbia and Slovenia) who shared the same rule for several decades (1918-1991). We thus retain these cultural grouping in order to deal with the potential impact of cultural factors on the demand for democracy.
.
In the dataset, we identify 44 frontiers-zones with quasi-adjacent Primary Sample Units (PSU)s of the survey located on the twoboth sides of the frontier (less than 30 km from each other). For each couple of countries corresponding to a given frontier, we use the democracy score established by Freedom House Nations in Transit 2006 (Freedom House, 2006a)Freedom House (refref). In another specification, we use a dummy variable that indicates which of the two countries is “more democratic”, according to this ranking.
Our test thus consists, for all pairs of observations at frontier zones, in regressing the individual support to the market on this index of democratic development, controlling for frontier zone dummies and other socio-demographic controls. The assumptions of (i) market
10 In Bisin and Verdier (2000) or Fernandez and Fogli (2005), culture is can be defined as a long term inertia in preferences.
integration and (ii) common culture at the frontier between two formerly integrated countries mean that the third and fourth terms of equation (1’) are constant and hence need not be included in the regression. We thus run the following regression on the sub-samples of frontier zones:
Support for market ijk = a0 + a1 Democracy Level j + a4 Xi + a5 Zk + ui (1’’)
where Democracy Level j corresponds to the democracy score of country j, Xi stands for socio-demographic characteristics of respondent i, Zk is a vector of frontier zone dummies and ui the error term. In an alternative specification, we run the same regression on a dummy variable indicating whether the country of residence of an individual is more democratic (or not) than the adjacent country.
3.2. Demand for democracy
In order to identify the determinants of the demand for democracy, we need to overcome the symmetrical problem, i.e. to isolate the causation running from market liberalization to the support for democracy, avoiding the contamination of the actual degree of democracy already reached and the influence of “cultural factors”, i.e. keeping the second and third terms of equation (2) constant.
Support for democracy ijj = b0 + ba1 degree of development of market ij + b12 degree of
developmentof democracy ij + b3 cultural factors j + b24 Xijj + b35 Cj + ui (2’)
Where Cj is a vector of country dummies.
Here, we hinge both on frontier-zones and on regional and national variations. We rely on the fact that political institutions (and “culture”) are by definition the same in a given country, whereas market liberalization development is highly uneven across the various regions of a given country (refZhuravskaia, 2006;, EBRD, 2006), p. 12). We thus build indices of market liberalization at the regional level, and match individuals from the same country who live in regions that experience unequal degrees of market development. As explained in section 4.3, the constructed “industrial liberalization” score” reflects the regional development of private, small and medium enterprises and the formal sector, which are characteristics of market development.
and an “industrial liberalisation” score that reflects the development of private, small and medium enterprises and the formal sectorHenceWe thus estimate the following equation: Support for democracy ijr = b0 + b1 degree of development of regional marketjr + b4 Xij + b5 Cj
+ ui (2’)
Where index r refers to the administrative regions of country j.
This strategy relies on the admittedly strong assumption that the uneven development of the market across regions of a country is not due to some regional variable that would also influence the support attitudes of the inhabitants of the region towards democracy by the inhabitants of the region. In order to lift this assumption, we use two strategies. First of all, we control for the type of residence of respondents ( in metropolitan, urban or rural areas). Second, we again rely on borders’ specificities. We assume that in the context of high regional economic integration at borders, the level of market development is strongly influenced by that of the adjacent country. Hence even inside a given country, we assume that market development at the borders vary in a way that is partly exogenous to citizens’ preferences for politico-economic values. We thus match individuals of the same country, who live in different frontier-zones, and we regress individual support for democracy on the level of market development in the different frontier-zones. To go one step further, in an alternative specification, we use as a proxy for market development in the frontier zone zj of country j the industrial liberalization score of the adjacent frontier-zone zk across the border, in country k. We thus estimate the following regressions:
Support for democracy ijk = b0 + b1 degree of development of regional marketzl + b4 Xij + b5 Cj
+ ui (3’)
With l=j,k, and where z refers to the frontier-zone of, alternatively, country j and k.
Of course, even using these identifications strategies, we do not pretend to escape the influence of long term determinants of economic and political development. Having belonged
to the Ottoman Empire versus the Austro-Hungarian Empire certainly continues to influence the degree of adhesion to democracy and to market mechanisms up to the 21st century.
Neutralizing these long term trends would imply finding an instrument that could approximate the exogenous ultimate origin of these differences. This limits the validity of our
conclusions to short term relevance. Hence, the causality effects that we put in evidence should not be interpreted as long term processes but rather as some piece of evidence of the short term dynamic relations between these variables. More precisely, we ask, at a given point of time, whether the causality really runs with an identical force in the two directions between democracy and market development, or whether there is an asymmetry in the influence of one variable on the other.
4. Data
Our study hinges on the Life in Transition Survey (LITS), a survey conducted by the European Bank for Reconstruction and Development and the World Bank in 2006, in 285 post-Transition countries and Turkey11and Turkey (including Turkey and excluding Turkmenistan)..
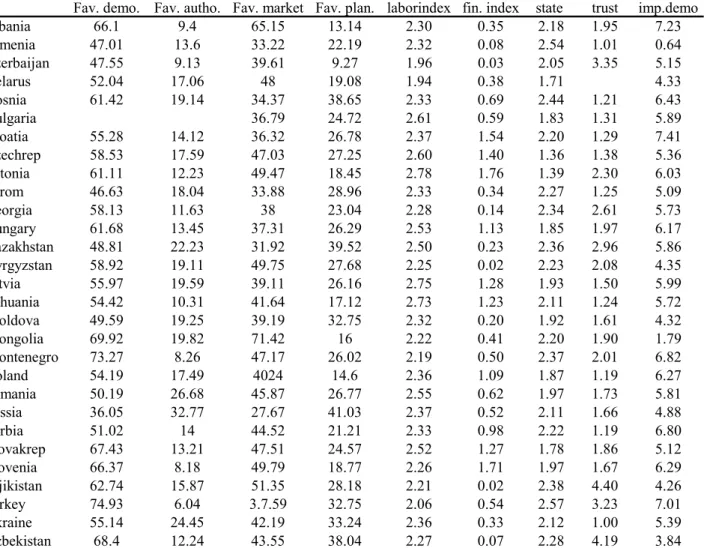
Respondents to the survey were drawn randomly, using a two stage sampling method, with census enumeration areas as primary sampling units, and households as secondary sampling units. The survey includes 1000 observations per country, for a total of 29000 observations. The sample of respondents is equally balanced in terms of gender, but is biased in favor of elder people: the age of the respondents varies from 17 to 97 years old, with a means of 46 years old. All descriptive statistics are presented in the Annex.
4.1.
The support to the market and to democracy
The support for the market is analyzed using the following question: Q3.10. with which one of the following statements do you agree most:
- A market economy is preferable to any other form of economic system.
- Under some circumstances, a planned economy may be preferable to a market
economy.
- For people like me, it does not matter whether the economic system is organized as a
market economy or as a planned economy.
We analyze the probability to choose any of the three modalities of questions q3.10.
4.2. The demand for democracy
Concerning the support for democracy, we analyze the probability to choose either modalities of question Q.3.11: with which one of the following statements do you agree most:
- Democracy is preferable to any other form of political system.
- Under some circumstances, an authoritarian government may be preferable to a
democratic one.
- For people like me, it does not matter whether a government is democratic or
authoritarian.
We also study the determinants of the demand for more specific aspects of democracy, such as law and order, independence of the press or of the courts system (Q.3.12). Finally, we verify that the support to democracy comes with trust in democratic institutions, using question q3.03 (see section 5.3).
4.23.
Frontier-zones
The LITS survey is based on Primary Sample Units12, each containing 20 observations (surveyed persons). We use the geographical map of the survey in order to identify groups of PSUs which are located on both sides and in the immediate vicinity of a political frontier. We identify 37 frontier-zones that contains from 40 to 460 observations, concentrated in 2 (Slovakia-Ukraine) to 24 (Croatia-Slovenia) PSUs.
The validity of our identification assumption relies on the intensity of market integration on either side of borders. This makes little doubt for the new ten EU members, among which goods and persons are free to circulate. This is also true of many neighboring countries in most part of Central, Eastern Europe and South Eastern Europe (for example the Slovak and the Czech Republics; Albania, Macedonia and Montenegro13; Bulgaria and Macedonia or Moldova and Romania). Many countries of the sample are integrated in Euro-Regions, the purpose of which is to promote trans-frontier cooperation14. Even the relationships between
12 Primary Sampling Units were selected randomly, with probability proportional to size. 13 As well as Kosovo, but Kosovo was excluded from our sample.
14 For example, Albania, Bosnia- Herzegovina, Croatia, Montenegro and Slovenia are part of the Adriatic Euroregion; Latvia, Lithuania, Poland and Russia are part of the Baltic Euroregion (alongside with Sweden and Denmark); the Czech Republic, Poland, Slovakia constitute the Beskydy Mountains Eeuro region; and trade
countries of the former Yugoslavia have eased to a large extent in the last few years, with, for example, the relaxation of visa procedures between Serbia and Croatia in 2003. Two CIS countries: Belarus and Ukraine are also integrated in Euro-Regions15. This implies deeper cross border integration between these neighbor countries, despite the relative closeness of Ukraine and Belarus. These countries are also largely integrated with Russia, historically and formally, in the Neman Euro-Region that also includes Lithuania and Poland.
In the particular case of Central Asia and the Caucasus, patterns of trade have changed less rapidly than in Eastern Europe (Babetskii et al, 2003; Broadman, 2005). While the costs of intra-regional trade have likely increased with the creation of independent countries (Djankov and Freund, 2000) and by the recent nationalist stance of some countries, such as Uzbekistan, these countries appear to be “overtrading” among themselves16. Using relative prices of a bundle of goods to complement official trade data, Grafe et al. (2005) show that the impact of borders on trade between Kazakhstan, Kyrgyzstan, Uzbekistan and Tajikistan is much smaller than what the view of cumbersome crossing border procedures and licensing systems would imply. The authors attribute this result to the large development of shuttle trade in this region. We leave out of our sample frontiers that are impaired by geographical obstacles or either restricted or closed because of political tensions and disputed territories. We thus exclude the frontiers between Georgia and Russia, Armenia and Azerbaijan, Moldova and Ukraine, as well as all Uzbek borders.
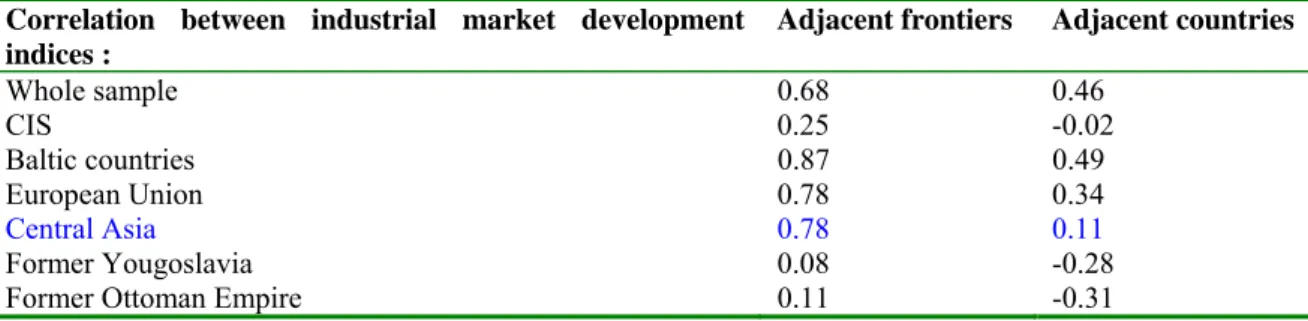
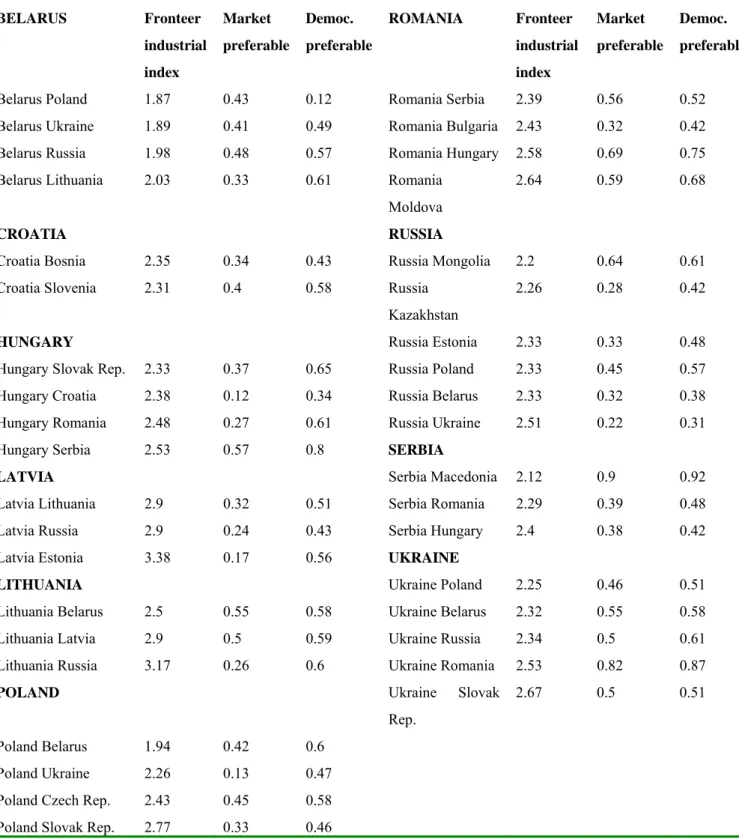
De facto, we verify that the degree of market development is more similar between two adjacent frontier-zones than it is in average between two adjacent countries. We calculate, for each frontier-zone between two countries i and j of the survey, the index of market development (defined infra in section 4.3) of frontier-zone i and frontier-zone j, and of country i and country j in average. Table 1 shows that on average, the correlation between indices of industrial market development is twice as high concerning adjacent frontier-zones of the sample as it is between adjacent countries of the sample. If one restricts the analysis to
15 Białowieża Forest Eeuroregion between Poland and Belarus, the BUG Eeuro-Region between Belarus, Poland, Ukraine, or the Carpathian Eeuro-Region between Hungary, Poland, Romania, Slovakia.
16 Using relative prices of a bundle of goods to complement official trade data, Grafe et al. (2005) show that the impact of borders on trade between Kazakhstan, Kyrgyzstan, Uzbekistan and Tajikistan is much smaller than
subsets of formerly more integrated countries, the proximity between adjacent frontier-zones appears even higher. For instance, in central Asia, the correlation between two adjacent frontier-zones is 0.78 against 0.34 in two adjacent countries (row 5 of Table 1).
Table 1. Industrial Market Development Indices at Frontier-Zones
Correlation between industrial market development indices :
Adjacent frontiers Adjacent countries
Whole sample 0.68 0.46 CIS 0.25 -0.02 Baltic countries 0.87 0.49 European Union 0.78 0.34 Central Asia 0.78 0.11 Former Yougoslavia 0.08 -0.28
Former Ottoman Empire 0.11 -0.31
Number of observations (frontier-zones): whole sample: 65; CIS (Armenia, Azerbaijan, Belarus, Georgia, Kazakhstan, Kyrgyzstan, Moldova, the Russian Federation, Ukraine and Tajikistan): 28; Baltic states: 8; EU: 28; Central Asia (Kazakhstan, Kyrgyzstan, Tajikistan): 5; Former Yugoslavia (Bosnia, Croatia, Macedonia, Montenegro, Serbia and Slovenia): 12; Former Ottoman Empire (Albania, Armenia, Bosnia, Bulgaria, Macedonia, Montenegro and Serbia): 14.
For each pair of frontier-zones between two countries i and j, the average industrial indices of market liberalization (cf infra) are calculated at the level of frontier zone i and frontier zone j and of country i and country j.
4.3.4
Indices of market liberalization
We build a regional industrial score of market liberalization, using questions about the respondents’ first, second and third jobs17. The score is the regional sum proportion of respondents who declare that they either: work in a small enterprise, work in a medium enterprise, work in a private firm, work in a newly created enterprise (since 1989), are self-employed with more than 5 employees or have a formal labor contract. More precisely, the industrial score that we build is the sum of each of the sub-indicators mentioned above. During the socialist era, Soviet economies were distinguished by their exceptionally low proportion of Small and Medium Enterprises (SMEs). The necessities of central planning
favored the organization of production and distribution in large units. We thus interpret the presence of SMEs as an indicator of market development. The presence of private firms and newly created firms are also a sign of progress in the Transition, an essential aspect of which is the process of privatization of the formerly dominant state-owned sector and the elimination of former monopolies under the pressure of new competitive firms (Berkowitz and Jackson, 2005). Self-employed persons with at least 5 employees are also part of this new economic pattern that is typical of a market economy and was absent from the landscape of planned economies. We do not count self-employed persons without employees on the grounds that those are likely not to be small firms but rather forms of quasi unofficial economy or what is sometimes called “disguised unemployment” (Earle and Sakova, 2000). (ref). Finally, we interpret the existence of a labor contract as a sign that the person is working in the official sector rather than in the informal onesector, a sign of development of the market. This industrial regional score varies from 0 to 5 with an average of 2.37.
The quality of these indices of market liberalization is limited by the lack of representativeness of the data at the regional level. However, there is no available alternative regional index of private sector development or market liberalization at the regional levelavailable for the whole regionset of countries.
5. Results
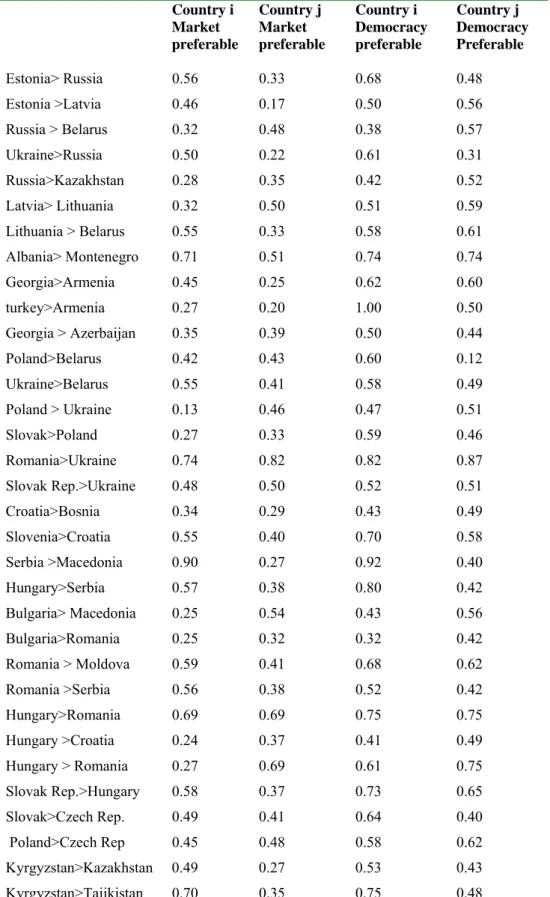
Although simple correlations show that supporting the market and supporting democracy are highly correlated attitudes (the correlation coefficient between the first modality of question q3.10 and question q3.11 is 0,45), our identification strategies leads to a different picture. We find that democracy does increase the support to market liberalization, but that the reverse relation is not as clear-cut. This pattern is apparent even in descriptive statistics. Table A2 shows that at frontier zones, the support for a market economy tends to be higher on the border of the country that enjoys a higher level of democracy (according to the Freedom
House Nations in Transit ranking). Table A3 however shows that preferences for democracy
within a given country do not seem to be consistently higher in the frontier zones where the market is most advanced.
5.1. Democracy raises the support to the market
Table 1 presents the general regressions of support to the market (equation 1’’) on, alternatively, the Freedom House Nations in Transit 2006 (Freedom House, 2006a) democracy index (Columns 1 to 3), and on a dummy variablen representing the relative advancement of democracy,indicator of development of democracy, i.e. on an index of democracy for each group of PSUs located at the frontier-zones of the survey (Columns 4 to 7). The Freedom House Nations in Transit 2006 (Freedom House, 2006a) democracy index takes values from 1 to 7, with 1 representing the highest level of democratic progress and 7 the lowest; we have recoded it in order to present the score of democracy in an ascending order. The constructed dummy variable attributes a score of 1 to the PSUs located in the most democratic country of each pair, and 0 to PSUs located in the country which fares worse in terms of the political scale, according to the Freedom House (Freedom House, 2006a and b),
Polity IV (CIDCM, 2006) or other indicesexes (see Table A4 in the Annex). For a given
border we only first retain the PSUs that are located at the frontier-zone (30 km around the border). All regressions are thus performed on the sub-sample of people living in the close vicinity of common frontier-zones. We control for frontier zone dummies and we adjust standard errors for clustering on frontier zones. Finally, in Table A7 (Annex), the regressions
are performed within each border-zone.
Columns 1 and 4 in Table 2 analyze the determinants of the probability to declare that “a
market economy is preferable to any other form of economic system”. Both the coefficients
on the democratic index and the more democratic dummy variable are significant. Column 1 displays the marginal effect of a change in the Freedom House Nations in Transit democratic score, while the coefficient on the variable “more _democracycy” represents the effect of a discrete change of this dummy variable from 0 to 1 (on the probability to support the market). Hence, column 4 in Table 21 shows that conditionally on living in a frontier-zone, living on the “more democratic” side of the frontier increases the probability of supporting the market by about 8.4%.
Columns 2 and 5 analyze the determinants of the probability to declare that “under some
circumstances, a planned economy may be preferable to a market economy”. Column 2
shows that an incremental change in the democracy score does not significantly affect preferences for the market. However, the coefficient on the “more democracy” dummy variable is significant at 5%, as it captures more significant changes in democratic advances. Column 5 thus indicates that conditionally on living in a frontier zone, experiencing a more democratic regime reduces the probability of favoring a planned economy by roughly 6,7%. Finally, columns 3 and 6 analyze the probability of declaring that “for people like me, it does
not matter whether the economic system is organized as a market economy or a planned economy”. It shows that democratic variation across frontier zones has no impact on such an
attitude.
Other rows of Table 2 display the other correlates of attitudes to the market. We distinguish three income categories (the richest, 30%, middle and poorest quantile inside each country), 6 educational levels, white- collar workers versus blue- collar workersoccupational categories, and employment status (self-employed versus employees). Self-employed workers tend to be more supportive of the market, while elder people and the poorest 30% of the population are less so.
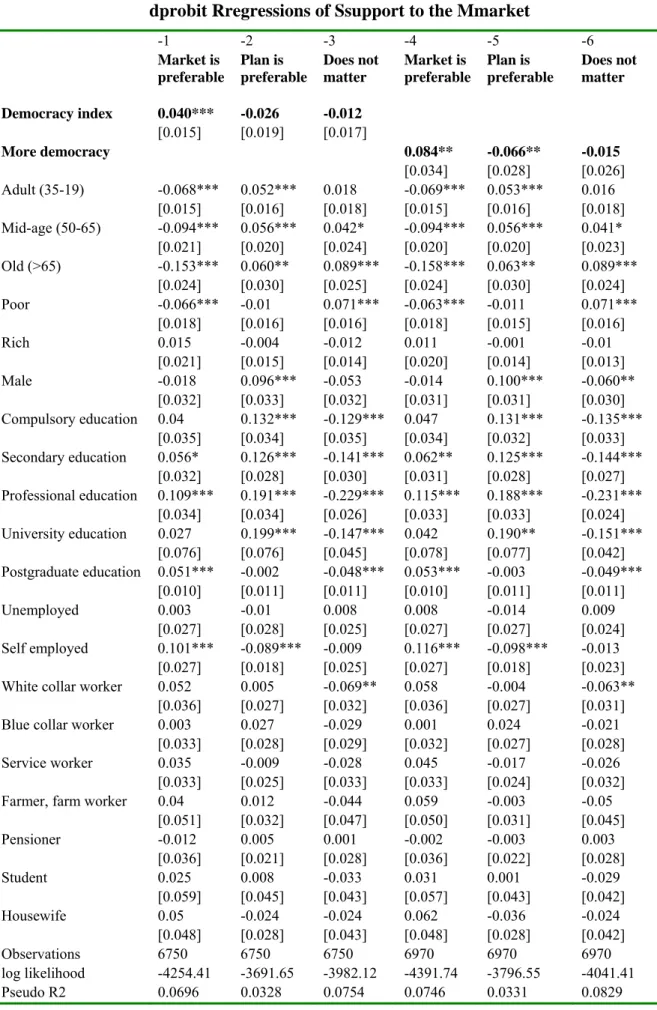
Table 21. Ddemocracy Iincreases the Ssupport to Mmarket Ddevelopment dprobit Rregressions of Ssupport to the Mmarket
-1 -2 -3 -4 -5 -6 Market is preferable Plan is preferable Does not matter Market is preferable Plan is preferable Does not matter Democracy index 0.040*** -0.026 -0.012 [0.015] [0.019] [0.017] More democracy 0.084** -0.066** -0.015 [0.034] [0.028] [0.026] Adult (35-19) -0.068*** 0.052*** 0.018 -0.069*** 0.053*** 0.016 [0.015] [0.016] [0.018] [0.015] [0.016] [0.018] Mid-age (50-65) -0.094*** 0.056*** 0.042* -0.094*** 0.056*** 0.041* [0.021] [0.020] [0.024] [0.020] [0.020] [0.023] Old (>65) -0.153*** 0.060** 0.089*** -0.158*** 0.063** 0.089*** [0.024] [0.030] [0.025] [0.024] [0.030] [0.024] Poor -0.066*** -0.01 0.071*** -0.063*** -0.011 0.071*** [0.018] [0.016] [0.016] [0.018] [0.015] [0.016] Rich 0.015 -0.004 -0.012 0.011 -0.001 -0.01 [0.021] [0.015] [0.014] [0.020] [0.014] [0.013] Male -0.018 0.096*** -0.053 -0.014 0.100*** -0.060** [0.032] [0.033] [0.032] [0.031] [0.031] [0.030] Compulsory education 0.04 0.132*** -0.129*** 0.047 0.131*** -0.135*** [0.035] [0.034] [0.035] [0.034] [0.032] [0.033] Secondary education 0.056* 0.126*** -0.141*** 0.062** 0.125*** -0.144*** [0.032] [0.028] [0.030] [0.031] [0.028] [0.027] Professional education 0.109*** 0.191*** -0.229*** 0.115*** 0.188*** -0.231*** [0.034] [0.034] [0.026] [0.033] [0.033] [0.024] University education 0.027 0.199*** -0.147*** 0.042 0.190** -0.151*** [0.076] [0.076] [0.045] [0.078] [0.077] [0.042] Postgraduate education 0.051*** -0.002 -0.048*** 0.053*** -0.003 -0.049*** [0.010] [0.011] [0.011] [0.010] [0.011] [0.011] Unemployed 0.003 -0.01 0.008 0.008 -0.014 0.009 [0.027] [0.028] [0.025] [0.027] [0.027] [0.024] Self employed 0.101*** -0.089*** -0.009 0.116*** -0.098*** -0.013 [0.027] [0.018] [0.025] [0.027] [0.018] [0.023] White collar worker 0.052 0.005 -0.069** 0.058 -0.004 -0.063**
[0.036] [0.027] [0.032] [0.036] [0.027] [0.031] Blue collar worker 0.003 0.027 -0.029 0.001 0.024 -0.021
[0.033] [0.028] [0.029] [0.032] [0.027] [0.028] Service worker 0.035 -0.009 -0.028 0.045 -0.017 -0.026
[0.033] [0.025] [0.033] [0.033] [0.024] [0.032] Farmer, farm worker 0.04 0.012 -0.044 0.059 -0.003 -0.05
[0.051] [0.032] [0.047] [0.050] [0.031] [0.045] Pensioner -0.012 0.005 0.001 -0.002 -0.003 0.003 [0.036] [0.021] [0.028] [0.036] [0.022] [0.028] Student 0.025 0.008 -0.033 0.031 0.001 -0.029 [0.059] [0.045] [0.043] [0.057] [0.043] [0.042] Housewife 0.05 -0.024 -0.024 0.062 -0.036 -0.024 [0.048] [0.028] [0.043] [0.048] [0.028] [0.042] Observations 6750 6750 6750 6970 6970 6970 log likelihood -4254.41 -3691.65 -3982.12 -4391.74 -3796.55 -4041.41 Pseudo R2 0.0696 0.0328 0.0754 0.0746 0.0331 0.0829
Controls: frontier zone dummies.
Thus, even though more educated, wealthier and self-employed people are more supportive of the market, the interaction with democracy is not significant. The impact of living in a more democratic country does thus not seem to transit via social positions of citizens.
Other mMain effects indicate that self-employed and white collar workers tend to be more supportive of the market, while elder people and the poorest 30% of the population is less so. White collar and service workers are significantly more supportive of democracy, as well as, what is more surprising, farmers and farm workers. Omitted categories: young (17-34) average income, lowest education, employee, blue-collar worker, occupation in army.
Robust standard errors adjusted for clustering on frontier zones. ?.
Main effects: older and poorer favour less democracy, rich, white collar, self employed, service workers and farmers or farm workers favour more
If one accepts the assumption that people living in a common frontier-zone share the same practical experience of market development (and the same background culture), the lesson of Table 2 shows is that living in a country with a higher degree of democracy exerts a positive influence on the declared support to the market. This result contradicts the conjecture discussed in introduction, according to which democracy might be an obstacle to reform. However, our conclusion is limited by the fact that we are unable to discuss how such stated preferences translate into voting behaviour.
As a robustness check, we have run the same regression as that of column 4 of Table 21 within each frontier-zone. The positive effect of democratic institutions on the support for the market proves particularly strong and significant at borders that are well integrated both culturally and economically (see Table A6 in the Annex for the quality of market integration at frontier-zones). This is notably the case for the Moldova-Romania frontier or the Estonia-Latvia frontier. The effect is also strong for the Belarus-Lithuania, Belarus-Poland and Ukraine-Russia frontier-zones, all formerly part of the Polish Empire and--- currently highly integrated.
The effect is globally well respected except for most Hungarian frontiersy and the , Bulgarian-Romanian frontier, Croatia-Serbia frontier and Polandish-Ukrainiae frontier-zonesian frontier. The unexpectedUnexpected results for Hungary mayare certainly be explained by the difficult situation of the country, whichin summer 2006 , at the time of the
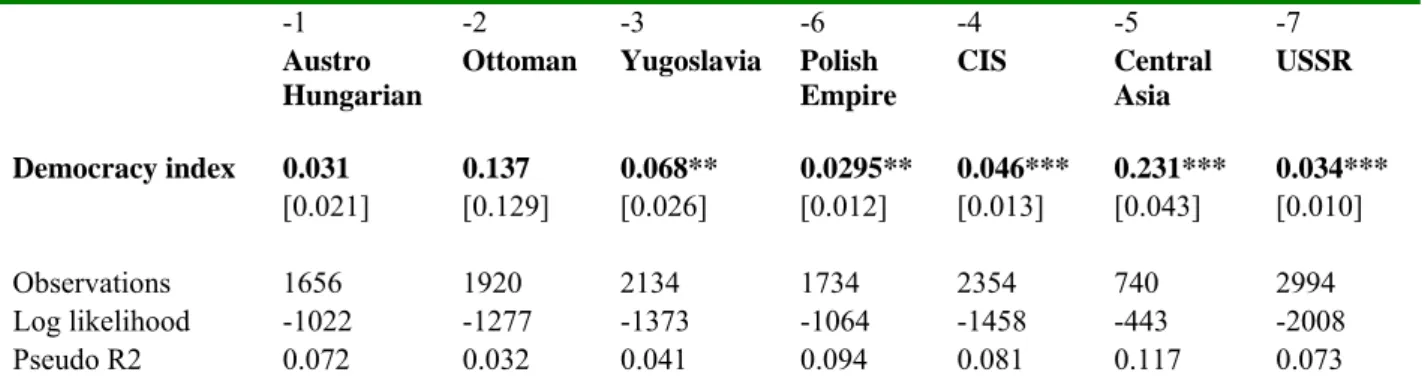
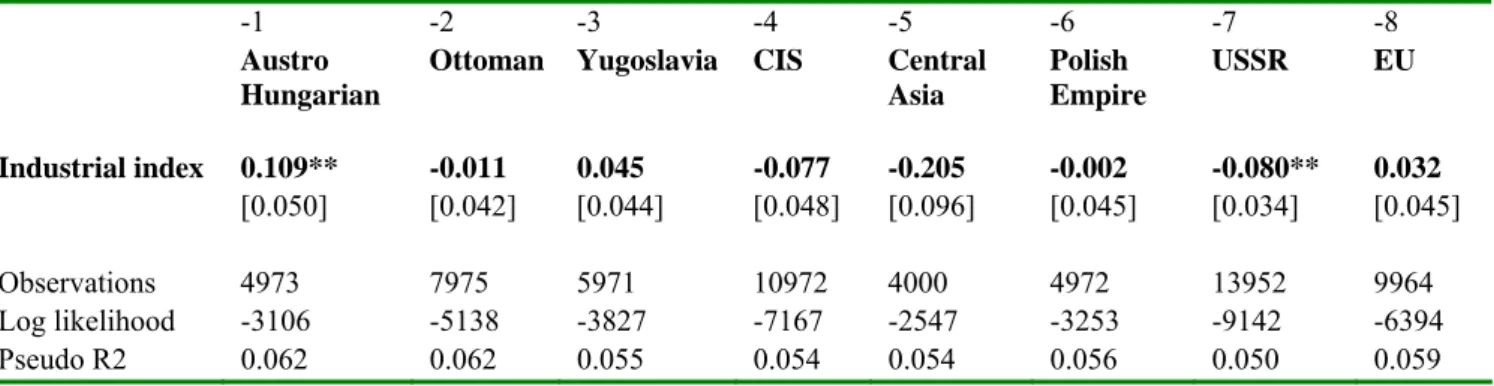
media of a broadcast of a the president Prime Minister trying to bribe a deputy. The Prime Minister being one of the main pro-market reformist advocates, the confidence crisis that affected him certainly contaminated attitudes towards the economic system and the virtues of a market democracy as a whole. Concerning the Bulgaria-Romanian frontier, the fact that the development of democracy in the two countries is very close, as shown by the identical ranking of these countries by other democracy indexesindices, like Polity IV (CIDCM, 2006) (see appendix) might explain why the sign of the coefficient of “More ‘more Ddedemocraticy”’ at the frontier between the two countries is reversed. The same reason may explain why many coefficients are insignificant at the borders of other countries that experience similar level of democracy, such as the Czech Republic and Poland (which obtain the same ratings both by both Freedom in the World (Freedom House, 2006b) and Polity IV (CIDCM, 2006)), Bulgaria and Macedonia or Bosnia and Croatia. Other results are impaired by the fact that economic integration may be only partial at some borders, such as s of the frontier between Croatia and Serbia, where, heavy restrictions were lifted only in 2003. We verified that our results do not hold when the frontiers that were excluded from our sample for being closed or severely restricted are considered. For instance, the coefficient inside the Armenia-Azerbaijan border zone is -0.070 (0.128); it is of -0.3283 (0.207) in the Kazak-Uzbek frontier-zone; of -0.097* (0.051) in the Kyrgyz-Uzbek and of 0.004 (0.696) in the Moldova-Ukraine zone. Considering all the closed border-zones together (and controlling for border-zones dummies), the coefficient on the freedom house democracy index is 0.039 (0.053) in the regression of the support to the market. Hence the relation is not significant in closed frontier-zones, which is consistent with our interpretation of regional integration. In order to go one step further in the attempt to control for “cultural” omitted factors, we now estimate equation (1’’) within various sub-samples of frontier-zones belonging to historically integrated regions. Table 3 presents the regressions by “cultural zones” as defined in section 3.2. Market development still hasexerts a positive and significant effect on the demand for democracy among countries of the former Ottoman Empire, countries of the former Yugoslavia, countries of the former Polish Empire and countries of the CIS, as well as among the subset of Central Asia.
integration in the past18, such as the USSR, and a fortiori the CIS and Central Asia, where, in addition, today’s frontiers are often arbitrary. The effect is also significant in the former Yugoslavia and the Polish Empire. By contrast, it is not significant for the countries of the former Austro-Hungarian Empire. A possible interpretation is that the relation between democratic institutions and the support for the market is particularly strong for less developed countries. Another possible interpretation is that the countries of the former Austro-Hungarian Empire are too close in terms of democratic development for the effect to be sizeable.
Table 3. Democracy and Support to the Mmarket within each Ccultural Aareas
dprobit Estimates of Support to the Market
-1 -2 -3 -6 -4 -5 -7
Austro Hungarian
Ottoman Yugoslavia Polish Empire CIS Central Asia USSR Democracy index 0.031 0.137 0.068** 0.0295** 0.046*** 0.231*** 0.034*** [0.021] [0.129] [0.026] [0.012] [0.013] [0.043] [0.010] Observations 1656 1920 2134 1734 2354 740 2994 Log likelihood -1022 -1277 -1373 -1064 -1458 -443 -2008 Pseudo R2 0.072 0.032 0.041 0.094 0.081 0.117 0.073
Controls: income categories, age categories, gender, occupation categories, self employed, education. Robust standard errors adjusted for clustering on frontier zones.
The Austro Hungarian zone comprises Croatia, Czech Republic, Hungary, Slovak Republic and Slovenia. The Ottoman zone comprises Albania, Armenia, Bosnia, Bulgaria, Macedonia, Montenegro and Serbia. Yugoslavian zone comprises Bosnia, Croatia, Macedonia, Montenegro, Serbia and Slovenia. The Commonwealth of Independent states (CIS) consists of Armenia, Azerbaijan, Belarus, Georgia, Kazakhstan, Kyrgyzstan, Moldova, the Russian Federation, Tajikistan, Ukraine and Uzbekistan. The former USSR comprises all of the CIS, plus Estonia, Latvia and Lithuania. Central Asia consists of Kazakhstan, Kyrgyzstan, Tajikistan and Uzbekistan. The Polish Empire zone comprises Belarus, Lithuania, Poland, Ukraine, the Russian Federation (western borders). EU zone comprises Bulgaria, the Czech Republic, Estonia, Latvia, Lithuania, Hungary, Poland, Romania, the Slovak Republic and Slovenia.
5.2.As a robustness check, The positive and significant link identified between democracy and demand for the market seems is also consistent when using other indicators of support for the market. Regressions for the support to the market depending on respective democracy levels across borders were also performedwe also test different indicators of democracy and different country rankings (see the Annex). The result that the development of democracy positively and significantly influences the demand for the market is preserved in the aggregate regression using the Freedom of the World (Freedom House, 2006b) or BTI indicators (Bertelsmann Stiftung, 2005).
Results at the frontier level are less conclusive, probably because
these indices are less focused on formal democratic institutions.
5.2.
5.3.Market liberalization does not raise the support for democracy
We now address the symmetric question whether more democracy comforts the support for market liberalization comforts the support for democracy. We need to make sure that the attitude toward democracy that is we elicitobserved is not caused by the degree of democratization already reached in the country of the respondent. Hence, we need to find some groups of citizens which sharewho experience a common political eenvironment with experience different degrees of market liberalization.As explained in section 2, we rely on the widely publicized evidence that there are wide regional differences within the countries of the former Soviet block and Eastern and Southern Europe (e.g. etc.EBRD, 2006, p. 12). We build 2 an index of market advance at the regional level, which is based on the regional market structure (size and type of firms).
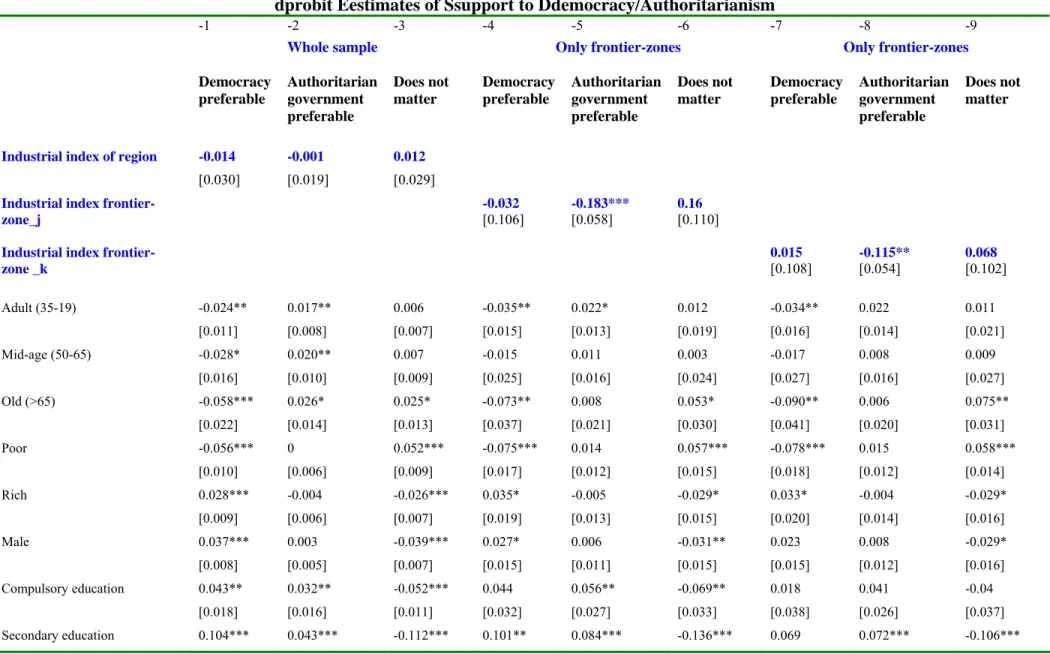
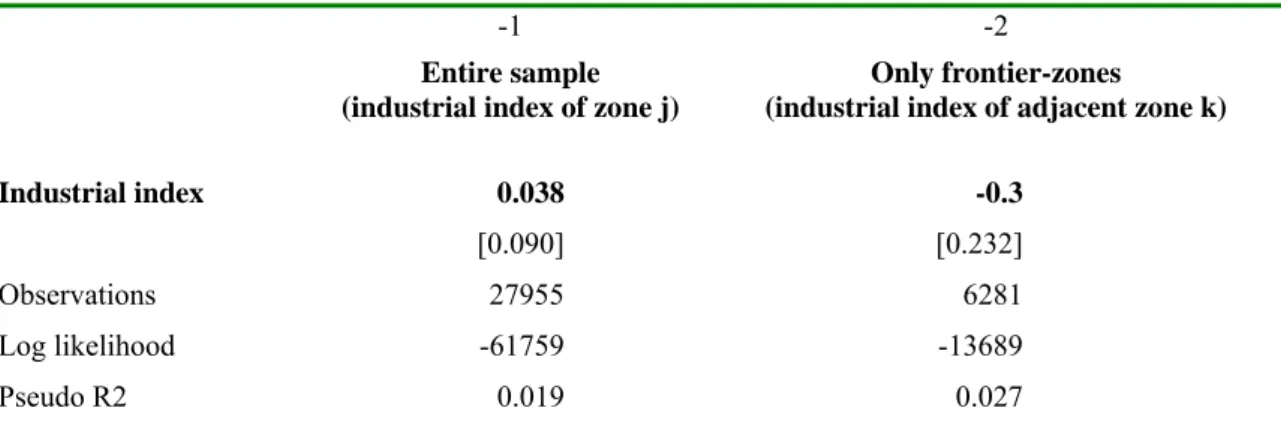
Table 44 shows the regressions of the support to democracy on indices of regional market development. Because an immediate thought is that the impact of market development on attitudes towards democracy could be driven by the metropolitan regions in which the market liberalization is well in advance of other regions, and where people are also supposedlikely to have different political attitudes, we include a control for the type of area (urban-metropolitan/urban/rural) in all regressions. We checked that the results are essentially unchanged when these controls are not performed and when metropolitan regions are dropped from the sample.
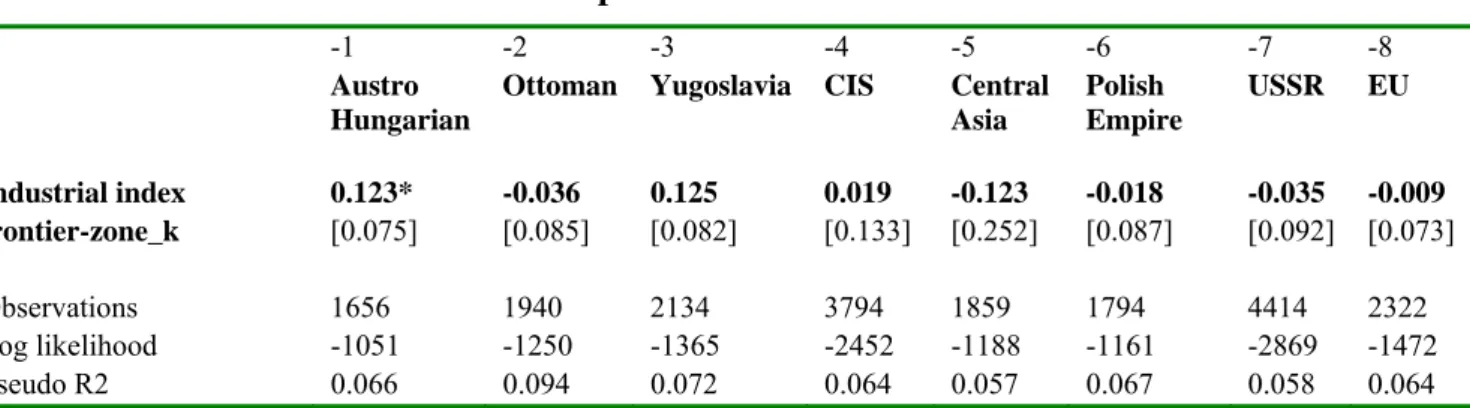
Columns 1 to 3 present the regression of individual preferences for the political regime on our index of market development across all regions of a given country. Columns 4 to 6 present an alternative specification where we restrict the sample to open frontiers, and measure the effect of market development in the various frontier zones of a country. Lastly, columns 7 to 9 display the result of a third specification where the degree of market development of a frontier-zone j is proxied by the degree of market development of the adjacent region k across the frontier (cf section 3.2). As explained in section 3.2, the two latter specifications are useful in order to avoid the risk that the observed relationship between market development and support to democracy is due to reverse causality.
development has no impact on this variable, in any of the specifications. Identically, the probability of choosing the modality “for people like me, it does not matter whether a
government is democratic or authoritarian” (columns 3, 6 and 9) does not depend on the
index of market development.
Columns 2, 5 and 8 analyze the determinants of the probability to declare that “under some
circumstances, an authoritarian government may be preferable to a democratic one”. Here,
market development has a negative and significant effect when the sample is restricted to frontier zones of a given country. Hence, conditionally on living in a frontier zone, living close to a country where the market is more advanced and benefiting from this market development thanks to cross border market integration reduces individual support for authoritarian regime. However, this effect is not significant when all regions of the country are considered (columns 2.5 and 8).
Market liberalization thus does not appear to reinforce democratic values. Other effects indicate that the the richer, better educated, younger, self- employed people and surprisingly, farmers and farm-workers, are more supportive of democracy. On the contrary, the poor, those who have not completed compulsory education and women are less supportive of democracy and more likely to declare that the political system does not matter for them.
Table 44. Support to Ddemocracy and Regional Iindices of Mmarket Lliberalization
dprobit Eestimates of Ssupport to Ddemocracy/Authoritarianism
-1 -2 -3 -4 -5 -6 -7 -8 -9
Whole sample Only frontier-zones Only frontier-zones
Democracy preferable Authoritarian government preferable Does not matter Democracy preferable Authoritarian government preferable Does not matter Democracy preferable Authoritarian government preferable Does not matter
Industrial index of region -0.014 -0.001 0.012
[0.030] [0.019] [0.029]
Industrial index frontier- -0.032 -0.183*** 0.16
zone_j [0.106] [0.058] [0.110]
Industrial index frontier- 0.015 -0.115** 0.068
zone _k [0.108] [0.054] [0.102] Adult (35-19) -0.024** 0.017** 0.006 -0.035** 0.022* 0.012 -0.034** 0.022 0.011 [0.011] [0.008] [0.007] [0.015] [0.013] [0.019] [0.016] [0.014] [0.021] Mid-age (50-65) -0.028* 0.020** 0.007 -0.015 0.011 0.003 -0.017 0.008 0.009 [0.016] [0.010] [0.009] [0.025] [0.016] [0.024] [0.027] [0.016] [0.027] Old (>65) -0.058*** 0.026* 0.025* -0.073** 0.008 0.053* -0.090** 0.006 0.075** [0.022] [0.014] [0.013] [0.037] [0.021] [0.030] [0.041] [0.020] [0.031] Poor -0.056*** 0 0.052*** -0.075*** 0.014 0.057*** -0.078*** 0.015 0.058*** [0.010] [0.006] [0.009] [0.017] [0.012] [0.015] [0.018] [0.012] [0.014] Rich 0.028*** -0.004 -0.026*** 0.035* -0.005 -0.029* 0.033* -0.004 -0.029* [0.009] [0.006] [0.007] [0.019] [0.013] [0.015] [0.020] [0.014] [0.016] Male 0.037*** 0.003 -0.039*** 0.027* 0.006 -0.031** 0.023 0.008 -0.029* [0.008] [0.005] [0.007] [0.015] [0.011] [0.015] [0.015] [0.012] [0.016] Compulsory education 0.043** 0.032** -0.052*** 0.044 0.056** -0.069** 0.018 0.041 -0.04 [0.018] [0.016] [0.011] [0.032] [0.027] [0.033] [0.038] [0.026] [0.037]