HAL Id: halshs-00523512
https://halshs.archives-ouvertes.fr/halshs-00523512
Submitted on 5 Oct 2010
HAL is a multi-disciplinary open access archive for the deposit and dissemination of sci-entific research documents, whether they are pub-lished or not. The documents may come from teaching and research institutions in France or abroad, or from public or private research centers.
L’archive ouverte pluridisciplinaire HAL, est destinée au dépôt et à la diffusion de documents scientifiques de niveau recherche, publiés ou non, émanant des établissements d’enseignement et de recherche français ou étrangers, des laboratoires publics ou privés.
Missing trader fraud on the emissions market
Marius-Cristian Frunza, Dominique Guegan, Fabrice Thiebaut
To cite this version:
Marius-Cristian Frunza, Dominique Guegan, Fabrice Thiebaut. Missing trader fraud on the emissions market. 2010. �halshs-00523512�
Documents de Travail du
Centre d’Economie de la Sorbonne
Missing trader fraud on the emissions market
Marius-Cristian FRUNZA, Dominique GUEGAN, Fabrice THIEBAUT
MISSING TRADER FRAUD ON THE EMISSIONS MARKET
Marius-Cristian Frunza1, Dominique Guegan2 and Fabrice Thiebaut3
Abstract
Purpose – The aim of this paper is to show evidence and to quantify with forensic
econometric methods the impact of the missing trader fraud on European carbon allowances markets. This fraud occurred mainly between the end of 2008 and the beginning of 2009. In this paper we explore the financial mechanisms of the fraud and the impact on the market behaviour as well as the consequences on its econometric features.
Design/methodology/approach – In a previous work (Frunza and Guégan, 2010), we showed
that the European carbon market is strongly influenced by fundamentals factors as oil, energy, gas, coal and equities. Therefore, we calibrated Arbitrage Pricing Theory-like models. These models enabled us to quantify the impact of each factor on the market. In this study, we focused more precisely on spot prices quoted on Paris based Bluenext market over 2008 and 2009. We observed during this period a significant drop in performances and robustness of our model and a reduced sensitivity of carbon prices to fundamentals.
Findings – Therefore, we identify the period where the market was driven by missing trader
fraud movements and we were able to measure the value of this fraud. Soon after governments passed a law that cut the possibility of fraud occurrence the performance of the model improved rapidly. We estimate the impact of the VAT extortion on the carbon market at 1.3 billion euros.
Originality/value – This paper is the first study that attempts to prove and quantify
scientifically the missing trader fraud on emission markets.
1. Introduction
The frauds based on pocketing governmental taxes in the retail businesses is probably one of the eldest and most ―lucrative‖ illegitimate affaire. It made over the time the reputation of several alleged criminals as for instance that of Michael Franzese4, iconographic figure and one time rising star of the reputed New York based Colombo family.
In the torments generated by the last economic fall new sources of illegitimate yields have risen across the financial industry. The perpetual competition among investment professionals for supplying with more attractive returns led in a lot of cases to cross not only the efficient
1
Sagacarbon, a subsidiary of Caisse des Dépôts et Consignations, 15-17 rue Marsollier , Paris 75002, France, PSE, Centre d'Economie de la Sorbonne, University Paris 1 Panthéon-Sorbonne and Sagacarbon, MSE, 106 bd de l'Hôpital, 75013 Paris, France. Email: [email protected],
2 PSE, Centre d'Economie de la Sorbonne, University Paris 1 Panthéon-Sorbonne and Sagacarbon, MSE, 106 bd
de l'Hôpital, 75013 Paris, France. Email: [email protected] . Tel: +33 1 40 07 82 98.
3
Sagacarbon, a subsidiary of Caisse des Dépôts et Consignations, 15-17 rue Marsollier , Paris 75002, France, Email: [email protected] . Tel: +33 1 40 63 10 17.
4 Member American organises crime immortalized in Martin Scorsese's 1990 film Goodfellas. Franzese's rise in
came in the early ‗80s from the infamous gasoline rackets collecting the state and federal gas taxes, but keeping the money instead.
but also the legal frontier. As a result the number of investment institutions and markets allegedly linked to fraud schemes multiplied over the last three years. From the historical loss of Jerome Kerviel reputed trader inside Société Générale to the massive havoc provoked by the Madoff system the financial industry have passed through a challenging period in terms of public image. If the new acts proposed by different investment authorities have enforced the role of the control function inside the financial institutions, less attention is paid to statistical analysis of market fundamentals or trading styles that could show proofs of price manipulations or frauds. Econometric research as a forensic tool is a relatively new field and less literature is available on this topic. If "pump and dump" schemes could be tracked by classic investigatory means, recent cases of market fraud show the necessity of a deeper statistical analysis of mechanisms and consequences following the financial white collar crime.
Over the past decade few researchers paid a special attention to the increasing number of reported VAT frauds. (Schaden et al, 2001) made a first attempt to quantify the VAT evasion and fraud in the EU, on the basis of the national accounts data. On a similar approach (Pashev, 2007), explained the experience of Bulgaria in identifying the types and modus operandi of VAT frauds with a focus on the abuse of tax credit. He analyses the elements of tax design conducive to such abuses and concludes that the possible solutions should be sought along the lines of optimizing risk management techniques and especially the implementation of the principle of joint responsibility rather than through tighter control at entry or on the conduct of business.
(Keen et al, 2007) showed that administrative measures alone may prove insufficient to deal with the MTF, and a fundamental redesign of the VAT treatment of intra-community trade required. (Ainsworth, 2010) assessed the VAT skim in the case of cash sales at retail and proposed a digital VAT solution in order to deal with this problem.
If initially MTF was specific to retail or wholesale businesses, over the past years it was enhanced by the use of financial markets. (Ainsworth, 2009) described how the VAT fraud has been slowly morphing from cell phones and computer chips to other commodities and discussed closely the MTF on the tradable CO2 permits.
The aim of our paper is first to extend the actual literature on carbon markets and on the use of statistics as a forensic tool. Second we focus on a financial fraud that allegedly took place on a new market, the carbon emission allowances exchange. The fraud consisted mainly in cashing out the VAT proceedings from allowances sales instead of returning it to governments. Our approach focus on developing an econometric approach being able to track and quantify the MTF and in that sense is complementary to previous works of (Ainsworth, 2009) and (Schaden et al, 2001). In the second part of the work we describe the mechanism of the fraud scheme and in third section we give few arguments that could explain the changes in market metrics. In the fourth part we explain our statistical methodology that brings relevant proofs for the fact that the VAT extortion scheme was not an isolated phenomenon and had a serious influence on prices dynamics. In the fifth part we discuss the results. The sixth part concludes.
2. Fundamentals of MTF
A detailed report addressed to the British House of Lords on the behalf European Union Committee analysed the Missing Trader Fraud in the EU. It appears that the abolition of barriers to internal trade in 1992 required further changes to the system of VAT applied to intra-Community trade. The Commission proposed a clearing house which would ensure that tax collected in the supplying Member State and deducted in the importing Member State would be passed to the latter Member State‘s revenue authority. This proposal was rejected by the Council of Ministers, who expressed concerns that the clearing house would not be practicable, not least because Member States would have no incentive to investigate their purchasers in order to collect tax which would be passed on to another Member State. Instead, Member States adopted a system under which intra-Community transactions were zero-rated. An exporter would not charge VAT, but would be able to claim a refund of input VAT; a purchaser would not pay VAT, but would have to charge it on subsequent sales and remit the VAT income to its fiscal authority. Thus consumption is taxed in the importing country. Any changes to this system, and other fiscal matters, require unanimity. This, along with a lack of political will to make a major change, has led to the current system continuing largely unchanged, despite suggestions on its introduction that it would only operate until 1997.
In MT fraud‘s most simple form, a trader collects tax on sales and then fails to remit it to the government, for example by engineering bankruptcy. In the past decade a more damaging form of this fraud has arisen in the European Union. It is not a fraud against the Community itself, and does not come about because of mismanagement by European institutions, but instead is an attack upon the measures Member States have introduced to promote cross-border trade in the Community. Growth in the fraud is driven by four factors:
(a) The increase in high value/low weight goods which make it easy and inexpensive to transport valuable consignments.
(b) The zero rate of taxation on intra-Community cross-border trade, which allows purchasers of goods from other EU countries not to pay VAT on purchase, although they charge VAT on sales as normal.
(c) At the same time, exporters of goods are still able to reclaim VAT they have paid to other traders, thus crystallising the loss as the revenue authority refunds a payment for which it had not received a remittance earlier in the transaction chain.
(d) The abolition of frontier formalities within the European Community which prevents Member States from operating procedures which could impede the free flow of goods within the Union. This means that the verification of the zero-rated goods imported could only be based on an audit of the traders‘ transaction records—a process which at present is normally only undertaken when VAT receipts are remitted, some times after the transactions.
In MTF‘s more virulent form, the first and fourth factors above are abused to trade repeatedly the same consignment of goods between companies set up for this specific purpose. It is this repeated cycling of goods which gives this version of the fraud its common name of ―Carousel Fraud‖. Once the shell companies have been created, MTF is a relatively simple crime to commit, with the cycling of goods allowing continuing profit from one initial outlay. .
3. The carbon VAT fraud scheme
The EU emission trading system (ETS) raised in 2005 and is now by far the largest multi-national scheme in the world (73 % of the value of the global carbon market in 2008). The scheme is a "cap and trade" system whose objective is to cut greenhouse gas emissions by allocating emission allowances (allocated for free or auctioned) which can then be transferred between operators. Phase 3 of the ETS (2013-2020) will incorporate a yearly decrease of the cap of 1.74 % per year, arriving at a reduction of 21 % below the 2005 emissions. Transfers of allowances between taxable persons are considered as a supply of service and were taxable at the place where the recipient is established. Thus the carbon allowances entered under the framework described in the previous section, being the perfect underlying for the MTF. First the allowances (EUA) showed a high value between 10 and 30 euros and are electronic ―goods‖ deposited under national registries, thereby making them weightless ands costless for transfers between countries. Second as a tradable good inside EU the allowances had a zero VAT regime for intra-Community cross-border trades. Third, the allowances traders were still able to reclaim VAT for trades with same country counterparties. Fourth, the existences of organised exchanges as Bluenext in France and Climex in Netherlands constituted a real fraud ―incentive‖ as the VAT was paid by the market exchange during the clearing process, thereby making the MTF faster and more efficient.
During the summer of 2009, a number of suspected cases of fraud were detected in several EU Member States and have led different EU governments to take swift action by including the greenhouse gas emission allowances in the list of supplies to which a (domestic) reverse charge system could be applied. As a consequence in June 2009 the governments of France and the Netherlands have removed the VAT from carbon permits. The UK has followed the French treatment in large measure. Announced on July 30, 2009 the UK change went into effect the next day. The UK has applied for a ―retrospective derogation‖ to ratify its position. On Monday June 8, 2009 rumours of MTF in carbon emission permits closed the main European exchange for spot trading of European Union carbon emissions permits and Kyoto offsets. When BlueNext began trading permits again on Wednesday, June 10, 2009, the certificates, which had previously been subject to the 19.6% French VAT, were exempt (without right of deduction). For French purposes CO2 permits were now a security.
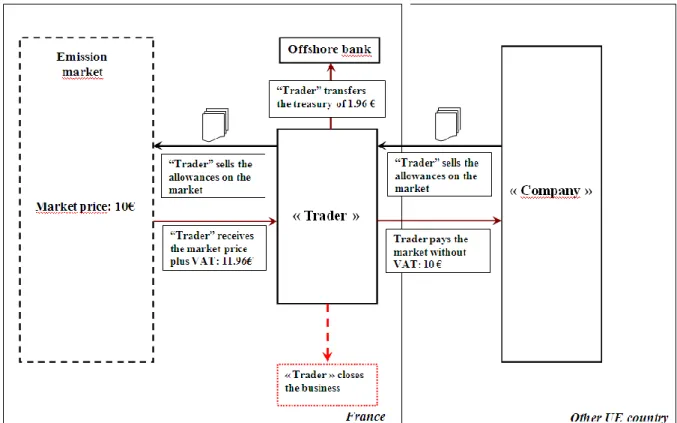
The so-called ―carousel‖ Value Added Tax (VAT) fraud or ―Missing Trader Fraud‖ involving carbon emissions allowances, or carbon credits is summarized in Figure 1.
Figure 1. VAT carousel scheme
The trading companies implied in the scheme allegedly imported large volumes of carbon credits VAT-free from other countries then sold the credits on French carbon market BlueNext, having already marked up the price with VAT. The market players purchasing the permits would then have been able to claim the VAT back from the French government. But the suspects allegedly never reported that VAT revenue, pocketing it instead.
The exchange handled a record 19.8 million metric tons of EU carbon permits on June 2 2009, according to data on Reuters. The previous record was 15.1 million tons on May 28 2009. The exchanged volumes felt nearly to zero following the announce of reverse charge of VAT in the beginning of June 2009. The following day trades fell to 2.5 million. For a backdrop, consider that average trading volumes of CO2 permits on BlueNext for the first four
months of 2009 was less than 7 million credits per day. There was a mild warning of possible problems when average trading volume jumped to 9.4 million credits in May.
The MTF on the carbon market could have passed under the radar of market regulators for almost two years for the following three reasons. First the carbon allowances had a double status: financial instrument and basic commodity. Hence the financial regulators did not focus on this market from its inception. Second, the carbon allowances had different regulations across the UE countries and some times inside the same countries. Third, the fraud appeared during a global financial distress and market regulators were focused on credit and liquidity issues.
4. Forensics methodology
After drawing an accurate picture of the MTF mechanism on the carbon market we focused on the consequences of the VAT fraud on the econometric features of the market. Thus we designed a forensic framework being able to bring rationale proofs and to quantify the impact of the fraud. Our forensic methodology is based on the validation of five hypothesis described as following. First, given the rapid return and the low market surveillance the VAT carousel would emphasize a bullish tendency of volumes traded on the market. Second in a market with a strong selling trend the prices would be pushed to a bearish behaviour, thereby showing an excess of negative skewness. Third a market strongly influenced by one strategy (mainly sell-side) would show a breach in the Efficient Market Hypothesis (EMH) assumptions mainly by autocorrelation effects. Fourth, the carbon prices would cease to respond to fundamental driving factors. Fifth, the carbon prices would show an extra noise due to abnormal trading.
We divide the emission price time series in three periods: ante fraud, fraud and post fraud. The period limits are established based on prior test results and on public information about the MTF. For each period we perform tests for volumes, skewness, autocorrelation, fundamental factors and extra noise and we compare the results of the three periods for the specific tests.
Our analysis shows that the VAT carousel represented a big part of the exchanged allowances and this massive scheme influenced significantly the market prices. One consequence of the fraud is the unusual high volumes of permits exchanged in the market. In fact in the pick weeks of the carousel the number of transactions was around 10 times higher than normal. After the ban of VAT on carbon trades the volumes dropped and stabilized to a basal regime in the last part months of 2009.
As explained in the Figure 2 the French carbon exchange was exposed to high quantities of selling which should drive the market to significant contraction and to an asymmetric behaviour. We investigate the fundamental level of permits' prices during this period and also the dynamic of the skewness. In a market with a strong selling trend the prices would be pushed to a bearish behaviour, thereby showing an excess of negative skewness.
In a previous work (Frunza and Guegan, 2010) provided a statistical study which identifies the "`actual"' main fundamentals for CO2 prices through an Arbitrage Price Theory
(APT)-like model. We observed that Oil, Dark Spread, Spark Spread and CAC40 explain more than 75 percent of the CO2 prices behaviour and the dynamic feature of the dependencies. We use
these findings in order to demonstrate that during the VAT carousel the carbon prices ceased to respond to fundamental driving factors but recovered promptly after the VAT ban rule.
5. Statistical results
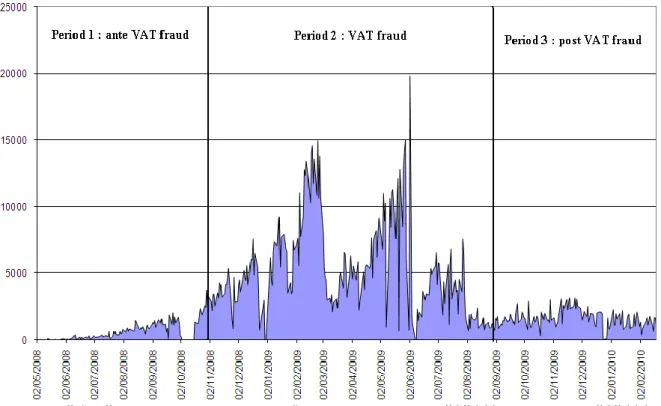
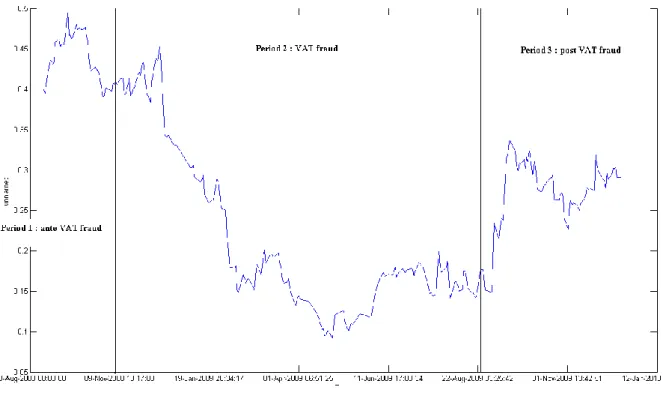
The Figure 2 shows the exchanged volumes of permits on BlueNext market. As expected it picked on June 2 and drooped the day after the VAT ban announce. This finding shows on one hand that a big stake of volumes were linked to the VAT crime and on the other hand that once the carousel suspended the market lacked of fundamental value forcing the "clean"
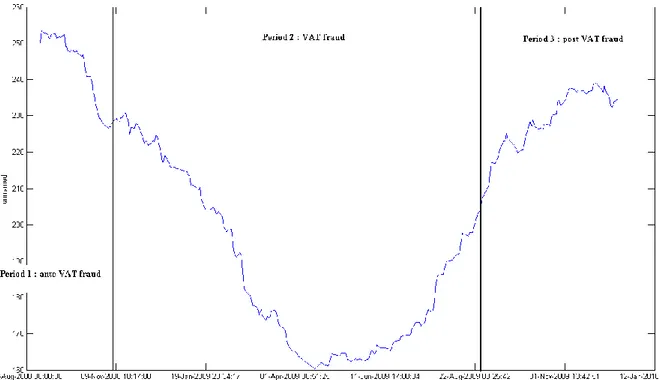
traders to cease shortly the activity. Moreover in February 2009 the prices touched an historical low of 7 euros per ton which is significantly less than the minimal estimated economic price of depolution which is around 10 Euros per ton, Figure 3.
Figure 2 CO2 volumes exchanged on Bluenext from June 2, 2008 to February 2, 2010
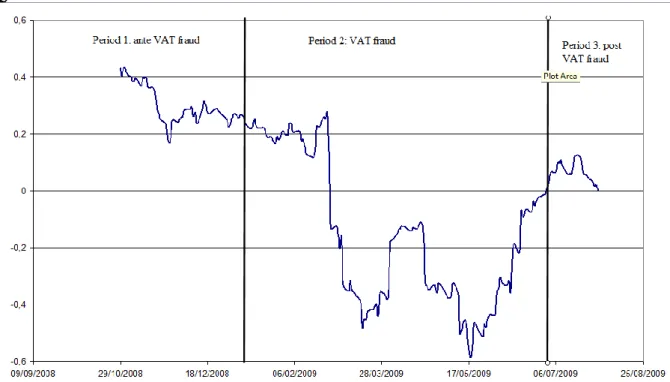
Figure 3 CO2 Emission prices from February 22, 2008 to January 22, 2010, and limits of the three periods: Ante VAT fraud, VAT fraud and post VAT fraud.
The Figure 4 shows the evolution of the carbon yield skewness measured on a moving window of 90 trading days. We observe that a phenomenon of skew reverse appears in the end of 2008 when the VAT carousel allegedly started. As the market become artificially long with large offering the daily yields become predominantly negative. We underline that the VAT fraud was an absolute 19.6 % return investment. The return was not linked by any means to market price, thereby pushing the permits to an unusual fundamental level. The skewness reverses to non-negative levels shortly after the end of VAT fraud.
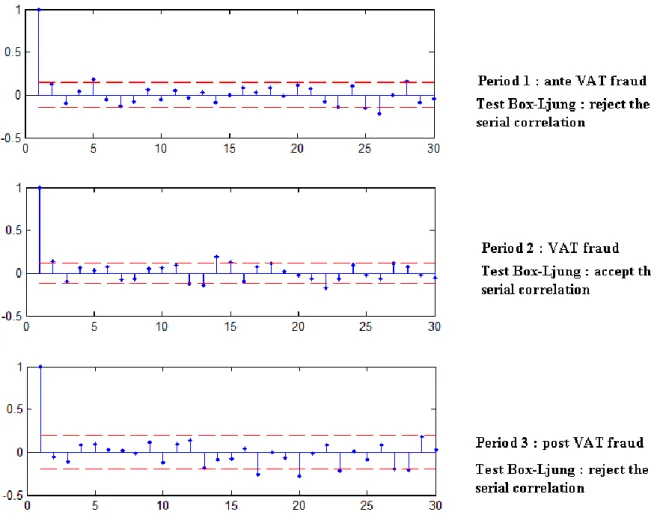
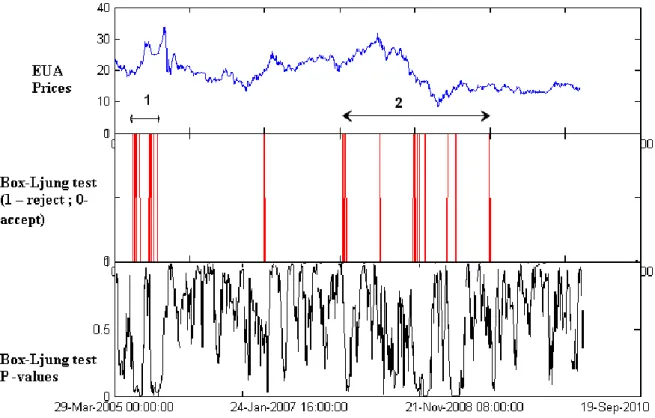
Figure 4. Skewness evolution of carbon yields computed using 90 days moving windows. Our next argument turns around the fact that in a market strongly influenced by one strategy we would expect significant autocorrelation effect. We investigate the autocorrelation of carbon prices returns on the three periods defined in the previous section. The Box-Ljung test reject at 95 % confidence level the null hypothesis on the ante and post period and accept it for the VAT period. The presence of autocorrelation and non-normality in EUA daily returns series is a strong indication of EMH5 breach. This finding is justified by heterogeneous information spread in the carbon market, due to the presence of some behavioural pattern across traders‘ strategies.
Figure 5. Autocorrelation tests for the 3 periods: Ante VAT fraud, VAT fraud and post VAT fraud.
As discussed in a previous paper (Dunban and Heler, 2006) the fraud-on-the-market theory is closely link to the behavioural finance through the EMH. The carbon allowances market is mainly driven by power producers, which neutralize the carbon emission of their production on a regular basis. Hence the carbon market is structurally linked to the power and fossils markets. On one hand the assumption that the carbon prices are driven by a quasi-stationary offer /demand equilibrium on energy exchanges we might find an EMH framework. On the other hand the regulated status of the market and the heterogeneous information spread are serious reasons for EMH violations and for occurrence of correlated patterns of behaviour. It is well known that in absence of market drivers prices are driven more by behavioural biases and by psychological trading effects. An analysis (Figure 6) of the ACF over a 90 days moving windows of daily returns shows that on some periods, allegedly linked to market uncertainty we find phenomena of persistence and time series trends. These facts are emphasized by rejection of the Box-Ljung test on different periods. In fact the EMH breach and the behavioural effect were determined by the opportunity of high returns via the VAT fraud.
Figure 6. Autocorrelation tests for CO2 emission prices using a 90 days moving window
In this section we use the APT model developed by (Ross, 1976) in order to show the impact of the factors previously identified on the CO2 price evolution, and show calibration results
with several noises. We make this calibration using EUA prices on the period 2006 - 2009. Using the historical time series we consider some models based on residuals that go from the classical Brownian diffusion to more sophisticated generalized hyperbolic distributions. The model supposes that a risky asset return follows a factor structure and has the following representation: r f f k fk r ... ~ 2 2 1 1 (1)
where r is the expected return of carbon allowance prices, βi is the factor loading of factor
“i” ,ε is the idiosyncratic component, and we assume E(fi) = 0 and E(ε) = 0;
Described by (Ross, 1976) and based on the underlying hypothesis that the markets are efficient the APT model assumes a Gaussian distribution of the residuals. Given the atypical nature of the CO2, the assumptions of the APT model are in some cases broken. Hence the
residuals do not follow a Normal distribution and the dependencies are not stationary over the time. In order to overpass this issue we used different distributions to replace the classic Gaussian modelling for residuals. Amongst the candidate functions t-Student, GED and Normal Inverse Gaussian (NIG) retained our attention for their capacity to take in account heavy tails.
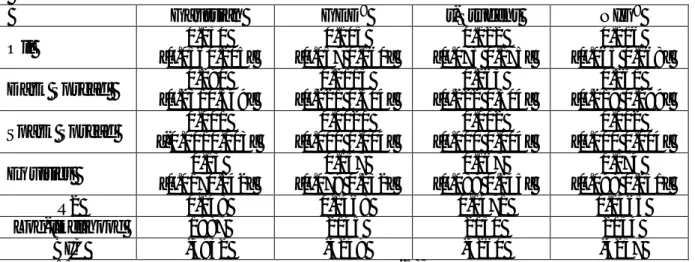
The Table 1 synthesis the results of our static calibration over the considered dataset using a daily timestep, for different residual distributions. The discriminatory elements are the R2;
the log-likelihood6 as a proxy for the information captured by innovations and the Bayesian Information Criterion7 (BIC). It appears that the levels of dependencies of CO2 price are
generally close for the different models. But the degree of fitness depends highly of the chosen model. Hence the NIG and t-Student distributions for residuals capture better the behavior of the residuals. The Ljung-Box test of residuals autocorrelation shows no presence of persistence at 99 percent of significance for all the distributions.
Gaussian GED8 t-Student NIG9
Oil 0.130 [0.0560.205] 0.105 [0.057 0.160] 0.122 [0.073 0.175] 0.116 [0.065 0.168] Dark Spread 0.290 [0.2310.349] 0.2115 [0.221 0.304] 0.263 [0.222 0.304] 0.261 [0.219 0.299] Spark Spread 0.001 [-0.0010.003] 0.0020 [0.000 0.004] 0.002 [0.000 0.004] 0.002 [0.000 0.004] Equities 0.13 [0.0170.242] 0.157 [0.079 0.232] 0.167 [0.088 0.245] 0.174 [0.098 0.251] R2 0.148 0.1468 0.1471 0.1465 Log-likelihood 1987 2145 2150 2153 BIC -3932 -4249 -4260 -4257
Table 1: Estimation of the beta parameters of model (1), with their standard deviation in brackets, using for le noise several distributions.
The results from the Table 1 show that the Dark Spread is the strongest driver for the carbon prices followed by Equities and Oil prices. The Spark Spread plays only a minor role. Beyond the statistical interpretation of the modelling results the economic reality shows a strong dependency between the energy prices and the economic turn over on one side and carbon prices on the other side. Power producers and industries submitted to the cap and trade system hedge regularly the carbon-cost of their production on the carbon markets. In the case of utilities both carbon and power are traded on organized exchanges thereby implying a structural linkage of these markets.
We applied the t-Student based APT model to carbon prices for the period when the VAT carousel took place. Hence we traced the explained dependency (R2) and the model fitting (Likelihood) on a moving window of 90 trading days. The results are presented in Figures 7 and 8.
6
The higher it is, more information is capture by the innovations' modeling
7 We emphasized the fact that the we don't compare model fitting from the economic point of view as the
innovation series vary for different models.
8
Generalized Error Distribution
Figure 7. R2 evolution of APT model
The Figure 7 shows the evolution of the explained dependencies during the period when allegedly the fraud occurred. The results indicate that the R2 decreases significantly in the end of 2008 and regains after the summer of 2009. In fact our APT model quantify to a certain extent the link between the carbon yields and the fundamental factors. If at a certain moment the carbon price is driven by some new factor the accuracy of our model diminishes. This situation occurred in our case during the VAT carousel when prices where established mainly by the scheme traders, thereby responding less to fundamentals.
One could justify this downfall in model quality by the global bearish tendency on commodities markets and high volatility that occurred in between end of 2008 and beginning of 2009. Yet in order to investigate this scenario we focused on the evolution of model likelihood. The likelihood estimates the accuracy of the distribution fit on residuals. The Figure 8 indicates that the likelihood diminished substantially in the end of 2008 with a minimum in June 2009 and rallied afterwards. This finding shows that the residual noise of the model became stronger in the same period the VAT carousel was turning as a result of trades that violated fundamental trends.
Figure 8 Likelihood evolution of APT model
The previous results underline that a trading "epiphenomena" occurred between November 2008 and August 2009. This "`hidden trading"' modified significantly the behaviour of the carbon market, its price level as well as its relationship to other commodities as oil and energy. The epiphenomena were pushed by high trading volumes ceased after the VAT ban on carbon allowances. The link between the hidden trading pattern and the VAT carousel fraud is obvious and the estimated loss on the BlueNext exchange is between 1.7 and 1.9 billions euros, given our estimations.
6. Conclusions
Statistics as forensic instrument is a new field and yet its actual applications are very vast and futures research in this area is justified. The VAT fraud on the carbon permits market that occurred between 2008 and 2009 represented a breach in the regulatory system. Beyond the fund pocketing effect the scheme had a strong effect of market manipulation, by drifting carbon prices behaviour from its fundamental state. This situation reversed immediately after the French government banned the VAT trade. This type of analysis could be extended to other type of markets and trading system in order to track or search of abnormalities or trading rules violation.
This approach could be employed further as a monitoring framework for MTF on other markets like gas or power.
7. References
1. Ainsworth R.T., (2006), ―Carousel Fraud in the EU: A Digital VAT Solution‖, Tax Notes International, p. 443, 1st of May
2. Ainsworth R.T., (2006), ―The Digital VAT (D-VAT)‖, Virginia Tax Review, vol. 25, 27th
of September
3. Ainsworth R.T., (2009), ―The Morphing of MTIC Fraud: VAT Fraud Infects Tradable Co2 Permits‖, working paper No. 09-35, Boston Univ. School of Law, 29th of August 4. Ainsworth R.T., (2010), ―Zappers - Retail VAT Fraud‖, Boston Univ. School of Law,
working paper No. 10-04, Boston Univ. School of Law, 9th of March
5. Authority of the House of Lords (2007), ―Stopping the carousel : The missing trader fraud in the EU‖, London, 20th
of May
6. Dunbar C., and Heller D.,(2006) ―Fraud on the Market Meets Behavioral Finance‖,
Delaware Journal of Corporate Law, Vol. 31, No. 2, 20th of June
7. Franzese M., (1992), Quitting the Mob, HarperCollins, New York, NY
8. Frunza M.C. and Guegan D. (2010), “Dynamic factor analysis of carbon allowances prices: From classic Arbitrage Pricing Theory to Switching Regimes”, working paper No. 54, Centre d‘Economie de la Sorbonne.
9. Nam C.W., Parsche R., Schaden B., (2001), ―Measurement of Value Added Tax Evasion in Selected EU Countries on the Basis of National Accounts Data‖, Working Paper Series No. 431, Center for Economic Studies and Ifo Institute for Economic Research Germany,24th of April
10. Pashev K.V., (2007), ―Countering cross-border VAT fraud: the Bulgarian experience‖,
Journal of Financial Crime, vol. 14, issue 4, pp. 490 – 501, 1st
of September
11. Ross S., (1976), ―The arbitrage theory of capital asset pricing‖, Journal of Economic
Theory 13 (3), 341360
12. Smith S., Keen M.,(2007) ―VAT Fraud and Evasion: What Do We Know, and What Can Be Done?‖, Working Paper No. 07/31, International Monetary Fund, 20th of June