Design and Implementation of a User-Adaptive
Website with Information Palettes
by
Qiuyuan Jimmy Li
S.B., EECS M.I.T., 2007
S.B., Management Science M.I.T., 2007
Submitted to the Department of Electrical Engineering and Computer
Science
in partial fulfillment of the requirements for the degree of
Master of Engineering in Electrical Engineering and Computer Science
at the
MASSACHUSETTS INSTITUTE OF TECHNOLOGY
May 2008
Copyright 2008 Qiuyuan Jimmy Li. All rights reserved.
The author hereby grants to M.I.T. permission to reproduce and to
distribute publicly paper and electronic copies of this thesis document
in whole and in part in any medium now known or hereafter created.
Author . . . .
Department of Electrical Engineering and Computer Science
May 23, 2008
Certified by . . . .
Glen L. Urban
David Austin Professor of Marketing
Thesis Supervisor
Accepted by . . . .
Arthur C. Smith
Professor of Electrical Engineering
Chairman, Department Committee on Graduate Theses
Design and Implementation of a User-Adaptive Website with
Information Palettes
by
Qiuyuan Jimmy Li
Submitted to the Department of Electrical Engineering and Computer Science on May 23, 2008, in partial fulfillment of the
requirements for the degree of
Master of Engineering in Electrical Engineering and Computer Science
Abstract
The majority of existing websites on the Internet do not adapt to the individual user. Instead, they serve the same static content that has been created beforehand to ev-eryone who visits the site. However, it has been shown that different people have different cognitive styles, or preferred ways in which they think, perceive informa-tion, and solve problems. Each cognitive style desires a certain type of information presented in a certain way.
In this thesis, I design and implement a framework for creating user-adaptive websites that can infer a user’s cognitive style from the webpages he or she visits and serve adaptive information palettes with content suited for that cognitive style. Specifically, the system first assigns ratings to each webpage, defining how each one rates along a set of cognitive style dimensions. Then it tracks a user’s session on a website, compares it to sessions of past users, clusters similar sessions together, and computes the likely cognitive style of the user using a weighted average of the ratings of the webpages in the user’s current session and in the cluster. I implemented this system as a customer advocacy website for General Motors. The website successfully infers users’ cognitive styles and displays suitable information palettes.
Thesis Supervisor: Glen L. Urban
Acknowledgments
I thank Professor Glen Urban for inspiring this thesis and for providing me with the valuable experience of working with and learning from him over the past year.
I thank Clarence Lee and Shirley Fung for welcoming me enthusiastically to the team and for bringing me quickly up to speed. They, Kevin Wang, and Ele Ocholi, have made our office an amazingly fun place to work.
I thank Kevin Wang for his help in designing the website and information palettes. I thank General Motors for its support of this project.
To Jenny, thank you for your patience as you listened to my ideas, for your insight as you made sense of them, and for your care as you reviewed this attempt to put them to paper.
To my parents, thank you for your love and support and for giving me this in-credible opportunity. I owe and dedicate this thesis to you.
Contents
1 Introduction 17 1.1 Vision . . . 17 1.2 Overview . . . 18 2 User-Adaptive Websites 19 2.1 Fundamental problem . . . 19 2.2 Existing solutions . . . 20 2.2.1 Customization . . . 20 2.2.2 Recommendation . . . 21 2.2.3 Targeted advertising . . . 21 2.3 User-adaptive websites . . . 222.4 User-adaptive information palettes . . . 22
2.4.1 Why information palettes? . . . 23
2.5 Applications . . . 24
2.5.1 Target business application . . . 24
2.6 Customer advocacy . . . 25
3 Cognitive Styles 27 3.1 Individual differences . . . 27
3.2 Cognitive styles . . . 28
3.2.1 Development and evidence . . . 28
4 System Overview 31 4.1 Design . . . 31 4.2 Session recording . . . 32 4.3 Inference . . . 33 4.3.1 Intuition . . . 33 4.3.2 Prerequisite definitions . . . 34 4.3.3 Inference algorithm . . . 36 4.4 Webpage serving . . . 37
5 Implementation Tools & Algorithms 39 5.1 Session tracking . . . 39
5.2 Session storage . . . 40
5.3 Session similarity . . . 41
5.3.1 Intuition . . . 41
5.3.2 Longest common subsequence . . . 41
5.3.3 LCS session similarity metric . . . 42
5.3.4 Properties of the LCS session similarity metric . . . 44
5.4 Session clustering . . . 45
5.5 Inference algorithm . . . 47
5.5.1 Rating the current session . . . 47
5.5.2 Rating past sessions . . . 49
5.5.3 Combining the two ratings . . . 50
5.6 Webpage recommendations . . . 50
6 System Implementation 53 6.1 Application . . . 53
6.1.1 Website design . . . 53
6.2 Prerequisite definitions . . . 54
6.2.1 Cognitive style dimensions . . . 54
6.2.2 Webpage ratings . . . 56
6.4 Website implementation . . . 57 6.4.1 Model . . . 58 6.4.2 Controller . . . 58 6.4.3 View . . . 58 6.5 Results . . . 59 7 Discussion 65 7.1 Related work . . . 65 7.2 Future work . . . 66 8 Contributions 67 A Style Ratings 69 B Information Palettes 71 Bibliography 75
List of Figures
2-1 An example of an information palette used to highlight relevant infor-mation on a university website. . . 23
2-2 The customer advocacy pyramid: Maintaining product quality through TQM and customer satisfaction form the foundation. Relationship management and customer advocacy build on top of this foundation. Figure from [19]. . . 26
4-1 The three components in the architecture: The inference module re-ceives the session history, infers the cognitive style, and passes that information to be used in serving the appropriate webpage. . . 32
4-2 The inference algorithm broken down into individual components. . . 37
5-1 An example of a cluster tree for the elements {A, B, C, D, E}. The clusters are {A}, {B}, {C}, {D}, {E}, {B, C}, {D, E}, {A, B, C}, and {A, B, C, D, E}. . . 46
5-2 The clustering algorithm reads in past sessions from the database and computes the clusters to pass to the session-cluster association compo-nent. . . 48
6-2 A screenshot depicting the layout of the website. The left panel con-tains navigational links to the six main sections. Below these links, the current estimate of the user’s style is shown, along with the current ses-sion and the style rating of the most similar cluster of past sesses-sions. The main content and the information palette lie to the right. . . 55 6-3 An example information palette for the style
Analytic-Deliberative-Learning. Note that the information is detailed and broken down into individual specifications in order to cater to the analytic and deliber-ative styles. By comparing to other cars to help users narrow down their choices, the information is also geared to those who are in the Learning stage. . . 57 6-4 The first page in the session: The system begins by assuming the user
has the Holistic-Impulsive-Learning style, and the information palette shown reflects that style. Note that all of the style ratings begin in the middle: 0.500 for D1 and D2, 1.000 for S1. . . 61 6-5 The second page in the session: The user visits the Data section,
sug-gesting that he is analytic and deliberative. The style rating of the current session updates to become more analytic and deliberative (see “Session style”). The session as a whole matches most closely past ses-sions that mostly visited the Data section; therefore, the style of the associated cluster is even more analytic and deliberative (see “Cluster style”). The overall style of the user is the average of these two rat-ings (see “Current style estimate”). The information palette adapts to display detailed, numerical information to appeal to the analytic and deliberative style. . . 62 6-6 The third page in the session: The user visits the Fast Solutions section,
suggesting that he is impulsive and also late in the buying process. However, the system does not immediately assume this is true because the user may have mistakenly clicked the wrong link and because the session does not yet match any past Impulsive-Buying sessions. . . 63
6-7 The fourth page in the session: The user visits the Deals & Promotions page under the Fast Solutions section. This gives a stronger indication that he is impulsive and late in the buying process. Accordingly, the style of the current session updates to be Impulsive and Buying (see “Session style”). In addition, the session now matches past sessions that were Impulsive-Buying; therefore, the style of the most similar cluster is also Impulsive and Buying. The information palette changes to reflect this new style: it displays incentives for scheduling a test
drive and a link to locate local dealerships. . . 64
B-1 Analytic-Deliberative-Browsing information palette . . . 71
B-2 Holistic-Deliberative-Browsing information palette . . . 72
B-3 Analytic-Deliberative-Learning information palette . . . 72
B-4 Holistic-Deliberative-Learning information palette . . . 73
B-5 Analytic-Deliberative-Buying information palette . . . 73
List of Tables
4.1 A session history records the ordered sequence of pages visited and the corresponding time spent on each page. . . 33 4.2 An example of cognitive style dimensions. Each dimension is a pair of
contrasting cognitive characteristics. . . 35 4.3 An example of cognitive style ratings of hypothetical webpages. . . . 35
5.1 An example iteration of the clustering algorithm. . . 47 5.2 An example of a hypothetical session. . . 49 5.3 The calculation of the style rating of dimension D1 for a hypothetical
session. The calculations of the style ratings of other dimensions are analogous. . . 50 5.4 The calculation of the style of an example session using its associated
cluster: first calculate the style rating of the current session (I); then calculate the style rating of each session in the most similar cluster {β, γ, δ} and average together to get C, the style rating of the cluster; finally, average I and C to get the final style rating F of the user. . . 51
6.1 The cognitive style dimensions used in this implementation. “Stage in the buying process” is used as an additional dimension with which to characterize users. . . 56
Chapter 1
Introduction
Imagine that you are shopping for a new car. You visit carmaker A’s website to learn about its cars and determine whether you should consider them. You like to analyze data and specifications, and so you are looking for a vehicle specifications webpage where you can compare the specifications of different cars. Unfortunately, you cannot find this page because it is either nonexistent or buried deep within some corner of the website.
Frustrated, you turn to carmaker B’s website hoping to find the information you want there. Here, you see a variety of useful information organized clearly into distinct sections. To your surprise, you find that a box on the page prominently displays “Click here to compare vehicle specifications”. As you navigate through the website, it seemingly knows exactly what information you’re looking for at each step. You leave B’s website happily with the information that you need, along with a quote and directions to your nearest dealer.
1.1
Vision
The website of carmaker B described above is the goal of this thesis. The motivation behind this research is driven by several questions:
• How do individuals navigate through a website to find the relevant information they need?
• What can we learn about them by observing their browsing patterns?
• How can techniques in computer science improve their browsing experiences?
This thesis proposes that different people exhibit different browsing patterns, which are influenced by their different cognitive styles. By observing their brows-ing patterns, we can learn their cognitive styles and then present a website that is best suited to these styles. In this manner, we can create websites that adapt to their users and realize carmaker B’s website.
The research goals are to design a system that can accomplish the proposed vision, implement the system as a functional website, and test its effectiveness through a market survey.
1.2
Overview
In Chapter 2, I highlight current techniques for personalizing user experience on web-sites and introduce user-adaptive webweb-sites as an improved alternative. In particular, I introduce the concept of user-adaptive information palettes as an example of such user-adaptive websites and give the motivation behind it.
In Chapter 3, I introduce the concept of cognitive style and explain its usefulness in segmenting users.
In Chapter 4, I provide an overview of a system that creates websites with user-adaptive information palettes and give the motivation behind its design.
In Chapter 5, I explain the specific tools and algorithms used in the system. In Chapter 6, I describe how the system was integrated to implement an actual user-adaptive website and demonstrate the results.
In Chapter 7, I discuss related work in the field and suggest possibilities for future research.
Chapter 2
User-Adaptive Websites
2.1
Fundamental problem
The majority of existing websites on the Internet function more like carmaker A’s in Chapter 1 than like carmaker B’s. Most websites serve static information to every user who visits the website. Because they have been developed beforehand, the content and presentation do not change over time and remain the same each time a user visits it, regardless of the user.
Oftentimes, the information on a website is not actually relevant to the user. Or if it is relevant, it may not be presented in a way that is easily understood. One can imagine that different users may have different preferences for how information is presented to them. For example, a user who likes to get an overall, holistic view of a topic, such as the condition of the economy, may simply want a general statement, like “The economy is doing well”. If this user is presented with a sea of detailed information, like the GDP and inflation rates, he may not want to or be able to process all of the data and arrive at the same conclusion on his own. On the other hand, an analytic user may indeed want to see all of the detailed data underlying the general statement in order to reach his own conclusion.
These are examples of individuals with different cognitive styles, or different pre-ferred ways in which they think, perceive information, and solve problems. People with different cognitive styles prefer different types of content and different ways in
which that content is presented and organized on websites.
The fundamental problem in most current websites is that they do not adapt to these individual users and their cognitive styles. Most websites are created by de-signers who cater to a particular target segment of the population or to a particular cognitive style. However, in doing so, they neglect many other segments and cog-nitive styles, which together may make up a large portion of the population. As a result, when these neglected users encounter websites that are difficult to process and understand, they may simply leave the website and look elsewhere.
This problem motivated the idea of creating dynamically adapting websites that suit the individual user based on his cognitive style.
2.2
Existing solutions
In recent years, there has been an increased emphasis on personalized content and presentation. Some existing technologies solve parts of this problem in various ways. Two such approaches are customization and recommendation.
Another similar approach is targeted advertising. Although this system also pro-vides targeted content, it is focused more on increasing click-through rates and sales and less on improving the browsing experience of users.
2.2.1
Customization
Customization sites, such as iGoogle1 or My Yahoo!2, allow the user to select the
information that he or she wishes to view on the homepage. This method is effective in terms of personalizability because the user has explicit control over the choice of content. However, its drawbacks are that it requires both explicit input from the user and the creation of a user account to save the personalized content. Users may be willing to do this for portals like iGoogle, which often serve as their homepage. However, they may not want to go through this time-consuming process for most
1www.google.com/ig 2my.yahoo.com
other websites that they do not frequent as often. In the latter case, the benefit of customization is eliminated.
2.2.2
Recommendation
Recommendation sites rely on the opinions of users to suggest content that may be relevant and interesting to other users. For example, Amazon uses collaborative fil-tering to suggest products that similar shoppers have viewed or purchased. While this technique often serves relevant product suggestions, it is based mainly on correlations between products and does not take into account any intrinsic characteristics of the users themselves.
Other examples include community websites like Digg3, which allow users to
sub-mit and vote for links and stories that they find interesting. Popular submissions with many votes are highlighted for other users to see. Unfortunately, this type of community voting technique often results in users’ seeing many irrelevant submissions because all users are grouped into a single mass.
2.2.3
Targeted advertising
Targeted advertising is a major business, led by companies like Google and Yahoo!. Advertisers create ads and purchase keywords related to their ads. These keywords are then matched to search queries and webpage text, and the most relevant ads are displayed. Because it relies primarily on keyword matching, this system neither learns about individual preferences nor adapts to them.
A specialized form of targeted advertising is behavioral targeting, led by TACODA4,
which segments users into categories based on their interests. For example, TACODA uses segments like “Active Gamer”, “Entertainment Buff”, and “Health Seeker”5.
Advertisers can then target their ads to specific audience segments. Although this method learns about individual preferences, it does not capture users’ cognitive styles.
3www.digg.com 4www.tacoda.com
A better system would combine interests and cognitive styles to form a more complete picture of users.
2.3
User-adaptive websites
The goal of a user-adaptive website is to fix the shortcomings of these existing tech-niques. Specifically, it adapts itself to individual users by learning their cognitive styles and then changing its content, presentation, and organization to suit their styles. A user-adaptive website passively learns about a user’s cognitive style by tracking the pages he views; no explicit input from the user is necessary. Given a best estimate of the user’s cognitive style, when the user requests a new page, the website automatically serves a version of the requested page with the content, presen-tation, and organization that suit the user’s cognitive style. As the user visits more pages, the website progressively pinpoints the exact style of that user.
2.4
User-adaptive information palettes
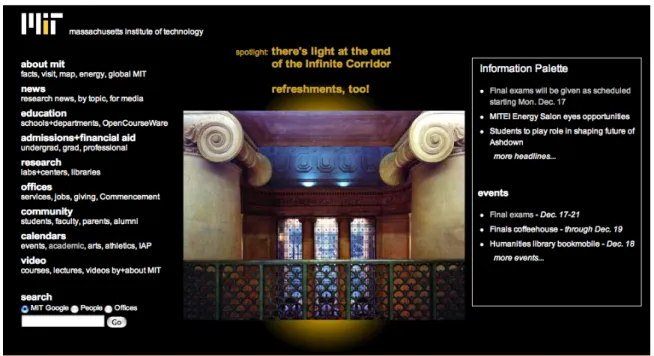
An information palette can be any collection of useful information for the user that is displayed on a webpage. For the purposes of this thesis, an information palette is a self-contained block within a webpage, usually along one of the four borders, which supplements the main content of the webpage. A palette is inserted into a designated slot in the webpage, and can often be used on multiple related webpages. Figure 2-1 shows an example of one such information palette that displays relevant information on a university website.
This thesis uses information palettes as a vehicle for adapting the content, pre-sentation, and organization of a website. These palettes present information rel-evant to the user and suited to his cognitive style. In this manner, the information palettes adapt to the user and improve his browsing experience.
Figure 2-1: An example of an information palette used to highlight relevant informa-tion on a university website.
2.4.1
Why information palettes?
An alternative to adapting information palettes is adapting entire webpages. This approach has been implemented successfully, as described in [5]. However, adapting information palettes offers three important benefits:
1. More intuitive: Some webpages cannot be easily created into different versions because there is a natural style for their content. Purposefully changing them would result in unintuitive and confusing webpages for users of all cognitive styles. In contrast, information palettes are self-contained blocks of content, which can be changed without disrupting the overall webpage.
2. Better scalability: It is easier to create different versions of information palettes than to create different versions of entire webpages. As a website grows to include more and more webpages, it will be also easier to scale up the num-ber of information palettes because they can potentially be reused on multiple webpages.
3. Less inconsistency: A webpage that changes completely may confuse the user if he sees one version of the page when he first visits it and then sees a different version when he returns to it at a later time. Adapting only the information palette reduces the confusion because the changes are isolated.
2.5
Applications
User-adaptive websites have very wide applicability in all kinds of domains. Any website with a wealth of information to deliver to a diverse audience would benefit from using this user-adaptive technique. Specialty websites with a narrow audience and range of topics may still benefit, because even hot rod aficionados have different cognitive styles.
User-adaptive information palettes in particular have two usages:
1. A group creates information palettes and places them on its own website to enhance its own visitors’ browsing experience.
2. A group creates information palettes and places them on other websites. Visitors of these other websites see these palettes adapt to their browsing behavior. In this sense, the information palettes become a sort of targeted advertisement and act as a link to drive traffic to the original website.
2.5.1
Target business application
At the Sloan Center for Digital Business, the primary target applications of this technique are websites of businesses that wish to increase sales of their products. By presenting specific information about their products that would appeal to specific types of customers, the websites could encourage more customers to make purchases. This thesis comprises the first phase of our research: building a user-adaptive website that contains information palettes with the first usage above. A business website would place these palettes on its website to give its users useful information.
The second phase consists of implementing the second usage of information palettes: placing them on trusted third-party websites as enhanced targeted advertisements in order to i) increase awareness and consideration of the business’s products and services, and ii) drive additional traffic to the business’s own website, where the im-plementation of the first phase can also be exploited.
2.6
Customer advocacy
The idea of adapting to the user is part of a larger movement in the field of marketing towards emphasizing and meeting the needs of the customer. With the growing per-vasiveness of the Internet, people are increasingly using the Web to research products before making purchases. The wealth of information available online is enormous, allowing people to find objective information and opinions on products, even as busi-nesses continue to employ biased marketing. Thus, traditional marketing techniques would simply cause customers to lose trust in a business and its products. Conse-quently, trust and loyalty are now the pillars of marketing.
Professor Glen Urban is a proponent of this movement towards customer advocacy. In his book Don’t Just Relate - Advocate!, he states:
Customer advocacy means faithfully representing your customers’ in-terests. It means giving them open, honest, and complete information (because they’ll discover the truth no matter what you do). It means talking with them, not at them. [19]
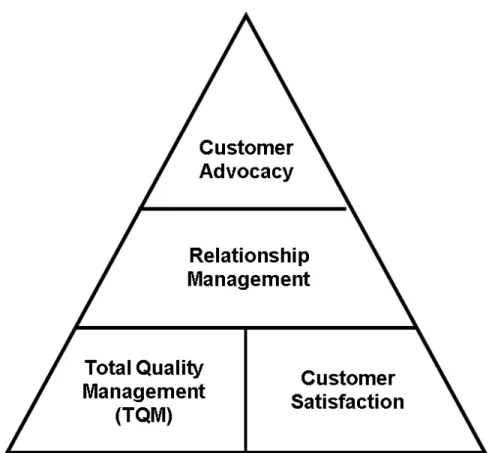
Advocating for the customer consists of multiple levels, as shown in Figure 2-2 [19]. Maintaining product quality through TQM and customer satisfaction form the foundation. Relationship management and customer advocacy build on top of this foundation.
User-adaptive websites promote customer advocacy by demonstrating to cus-tomers that their needs are valued.
Figure 2-2: The customer advocacy pyramid: Maintaining product quality through TQM and customer satisfaction form the foundation. Relationship management and customer advocacy build on top of this foundation. Figure from [19].
Chapter 3
Cognitive Styles
In this chapter, I introduce the concept of cognitive styles and demonstrate how these styles can be used in creating user-adaptive websites.
3.1
Individual differences
It is fairly easy to identify differences between people. Physical differences in at-tributes like height, hair color, and facial features are most easily and immediately noticeable. In our friends, we could probably also identify those who are more social, more organized, or more daring. These could be labeled as differences in personality traits or personality styles.
These differences in physical appearance and in personality are part of what makes each individual unique. These differences also cause different people to approach the same situation or tackle the same problem in very different ways. For example, given a project, an organized individual would likely list the tasks that need to be completed and create milestones for each task. A disorganized individual would likely do none of this preparation.
3.2
Cognitive styles
Whereas personality styles influence how people approach situations, cognitive styles influence how people think, process information, and learn. Riding and Rayner pro-vide the following definition: “Cognitive style is seen to be an individual’s preferred and habitual approach to organising and representing information.”[14]
3.2.1
Development and evidence
The history of cognitive styles can be traced back to Hippocrates’ model of human personality, in which there are four types: melancholic, sanguine, phlegmatic, and choleric. In the past century, the concept of cognitive style has been refined through the research of various psychologists. A good review can be found in [14].
Empirical and physiological evidence has supported the idea that people have different cognitive styles:
• Empirical evidence: Experiments were conducted where subjects were asked to perform simple cognitive processing tasks. These tasks elicited different responses from people of different cognitive styles. [14]
• Physiological evidence: Subjects’ brain activity was measured using elec-troencephalography (EEG) while performing tasks. The results showed corre-lations between the levels of brain activity and cognitive styles of the subjects. [15]
Cognitive styles have also been shown to be independent of intelligence and per-sonality:
• Intelligence: Various experiments have shown very low and insignificant cor-relations between cognitive styles and intelligence, as measured by standardized tests. [16]
• Personality: A study performed by Riding and Wigley showed low correlation between personality and cognitive style. [17]
3.2.2
Cognitive style dimensions
Many different dimensions for categorizing cognitive styles have been developed and proposed (see [14] for a review). The two dimensions I will be using in this thesis are Analytic-Holistic and Impulsive-Deliberative:
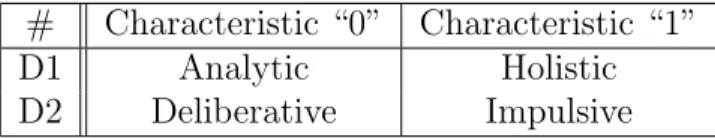
• Analytic-Holistic: This dimension relates to whether an individual tends to organize information into wholes or parts. Analytic individuals prefer to deconstruct information into component parts, while Holistic individuals prefer an overall, big-picture view. [13]
• Deliberative-Impulsive: This dimension measures an individual’s tendency for quick versus deliberate responses. Deliberative individuals carefully consider all options before making a decision, while Impulsive individuals reach decisions quickly and do not spend much time reviewing different options. [14]
Chapter 4
System Overview
This chapter describes the design of a system for creating websites with user-adaptive information palettes. The specific goals of the system are to overcome the drawbacks of existing techniques of user-adaptation by emphasizing the following requirements:
• High quality individualization: The user should be able to experience a website that accurately adapts to his or her style.
• Non-intrusive behavior: The website should be able to learn about the user and adapt itself to him or her without having to ask explicit questions.
4.1
Design
The system operates on the basis of i) passively collecting information about which webpages a user has visited, ii) inferring the user’s cognitive style based on the web-pages he has visited, and iii) serving content tailored to the cognitive style of the user.
This design satisfies the above two requirements: cognitive styles are a good dis-criminating measure by which to differentiate between different users and to adapt a website, and passive collection of browsing history eliminates the hassle of requiring explicit input from the user.
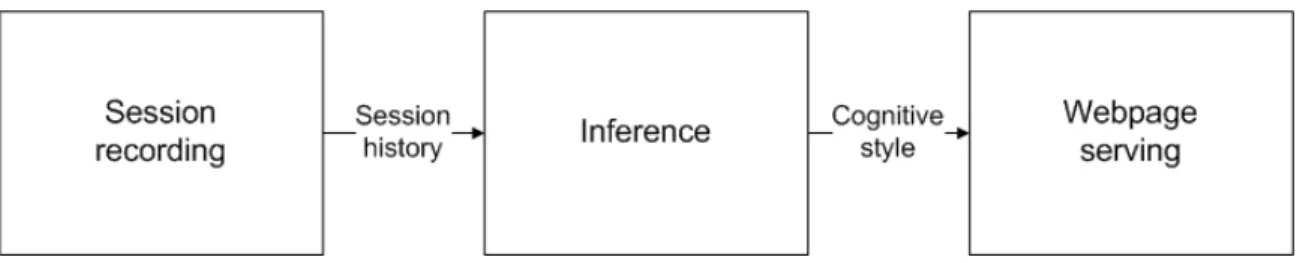
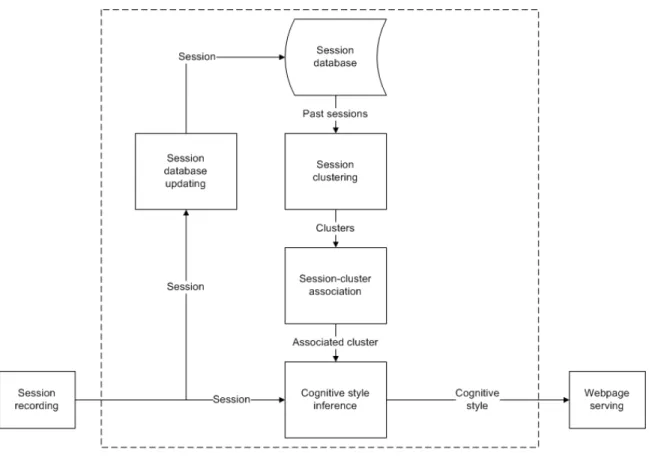
Figure 4-1: The three components in the architecture: The inference module receives the session history, infers the cognitive style, and passes that information to be used in serving the appropriate webpage.
This system design lends itself naturally to the following architecture. The system is composed essentially of three connected components:
• Session recording: Information about the user’s browsing session is recorded into a session history.
• Inference: Using the session history, the system infers the cognitive style of the user.
• Webpage serving: Given a cognitive style, the web engine serves a webpage tailored to that style.
These components operate in a sequence as depicted in Figure 4-1. I will now describe each component in more detail.
4.2
Session recording
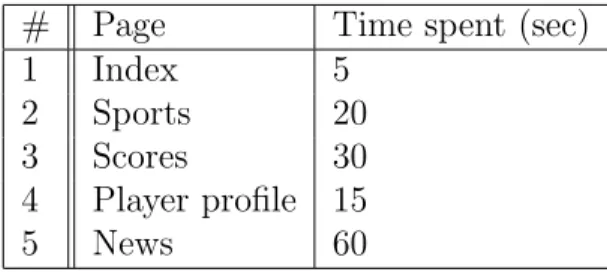
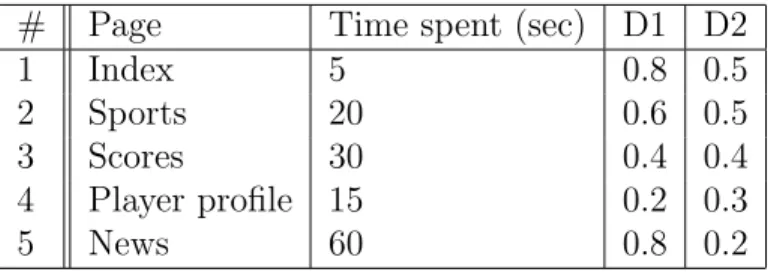
The session history contains various information about a user’s session, most impor-tantly the sequence of pages that have been viewed and the length of time spent on each page. An example of a session history is shown in Table 4.1. The history is collected and updated as the user visits each successive page.
# Page Time spent (sec) 1 Index 5 2 Sports 20 3 Scores 30 4 Player profile 15 5 News 60
Table 4.1: A session history records the ordered sequence of pages visited and the corresponding time spent on each page.
4.3
Inference
The inference engine is based on the fundamental idea that the pages visited by a user are a useful indication of his cognitive style. Before I go into more detail on how the inference is performed, I will first give some intuition to motivate this idea.
4.3.1
Intuition
Users navigate through a website by visiting pages that interest them. Each user may visit a different sequence of webpages since each user may have a different set of interests. These interests are different because they are influenced by the user’s cognitive style and his objective. In other words, a user will visit pages that he thinks will lead him to his objective and will contain information easily comprehensible to him. For example, a user who is analytic would likely visit a page containing data and specifications about a product so that he can synthesize all of the information and arrive at his own conclusion about whether to purchase the product. On the other hand, a user who is holistic would instead likely visit a page containing reviews and advice so that he can get an overall view of the product.
Two indications of cognitive style
Taking this intuition and formalizing it, we can say that a user of a given cognitive style S has a particular probability of visiting a webpage P . Reversing this, if webpage P is visited, then there is a certain probability that the user has cognitive style S. Thus, for each page, we can define a style rating: a probability distribution that
gives the likelihood that the user who visits the page is of each possible cognitive style. Then, given a sequence of visited webpages, we can use the style ratings of the visited webpages to find the probability that the user has each possible style. These probabilities give one indication of the cognitive style of the user.
Taking a step back from the individual user, it would appear that users with the same cognitive style would visit similar sequences of webpages. By defining an appropriate measure of “similarity” between sessions, we can group similar sessions together into “clusters” and associate each cluster with a cognitive style using its con-stituent sessions. A new session can then be compared to past sessions to determine which cluster it falls into. This cluster and its associated cognitive style gives another indication of the cognitive style of the user.
Putting them together
The final inference of a user’s cognitive style takes into account both of these indica-tions. The first is completely determined by the user’s own browsing session and may therefore be influenced by any uncharacteristic and spur-of-the-moment decisions he makes. The second is less affected by the user’s own session; it is instead a collection of past knowledge that helps to compensate for any aberrant behavior by the user. Together, these two indications provide a robust inference of the user’s cognitive style.
4.3.2
Prerequisite definitions
In order to perform this inference, two components must first be defined:
1. Cognitive style dimensions: What are the specific cognitive style dimensions along which to characterize users?
2. Webpage style ratings: What does a visit to each webpage tell us about the cognitive style of the user?
# Characteristic “0” Characteristic “1” D1 Analytic Holistic D2 Deliberative Impulsive
Table 4.2: An example of cognitive style dimensions. Each dimension is a pair of contrasting cognitive characteristics.
Page D1 D2 Index 0.8 0.5 Sports 0.6 0.5 Scores 0.4 0.4 Player profile 0.2 0.3 News 0.8 0.2
Table 4.3: An example of cognitive style ratings of hypothetical webpages.
Cognitive style dimensions
Cognitive styles are defined along a set of dimensions. These dimensions are numbered uniquely (e.g. “D1” and “D2”). Each dimension is a pair of contrasting cognitive characteristics. For each pair, one characteristic is labeled as “0” and the other is labeled as “1”. See Table 4.2 for an example of such dimensions. A complete descrip-tion of a cognitive style is a set consisting of one characteristic from each dimension (e.g. “Analytic-Impulsive” or “01”). Once defined, these dimensions become the metrics for characterizing the cognitive styles of users. Each user is labeled using one of the combinations of dimensions.
Webpage style ratings
A webpage’s style rating consists of a vector of probabilities that defines the likelihood a visitor of that page is of a particular cognitive style. Table 4.3 shows an example of style ratings of some hypothetical pages. A rating in a particular dimension in-dicates the probability that the user exhibits characteristic “1” in that dimension. For example, a rating of 0.2 in dimension D1 indicates that a visitor of that page has a 0.2 probability of having the characteristic “Holistic” in the first dimension (and therefore a 0.8 probability of having the characteristic “Analytic” in the same dimension).
With these components defined, the system can then use the following inference algorithm to estimate a user’s cognitive style as he visits successive webpages.
4.3.3
Inference algorithm
On a high level, the inference algorithm combines the style ratings of each webpage visited in a session to estimate the cognitive style that most likely produced that session. Specifically, the algorithm functions using the following repeating process:
• Session clustering: The sessions of past users of the website are compared to each other and grouped into clusters of “similar” sessions. The similarity between two sessions is determined by the number of common pages visited, the order in which the pages were visited, and the length of time spent on each page. The clustering algorithm is described in detail in Chapter 5.
• Session-cluster association: The session of the current user is compared to the clusters to find the one to which it is most similar.
• Cognitive style inference: Based on the current session and its associated cluster of past sessions, the cognitive style of the session is inferred. The algo-rithm combines the style ratings of the webpages in the current session with the style ratings of the past sessions in the cluster. The details of this algorithm are described in Chapter 5.
• Session database updating: As a user browses through a website, every successive page he visits is persisted to a database so that it can be included when the clusters are recalculated.
Figure 4-2 illustrates this process. The output is an agglomeration of style ratings for the entire session. Since a style rating is the probability that the user is of a particular cognitive style, this final style rating serves as the inference of the user’s cognitive style.
Figure 4-2: The inference algorithm broken down into individual components.
4.4
Webpage serving
Using the estimated cognitive style, the system can then serve the content that is best suited for the given style. In particular, the system can display:
• Tailored information palettes: An information palette with content that is tar-geted to the particular cognitive style is fetched from a library of palettes and served to the user.
• Related page recommendations: Using the associated cluster, the most likely pages to be visited next are calculated and displayed as recommended links.
Chapter 5
Implementation Tools &
Algorithms
The previous chapter provided a high-level overview of the system design and archi-tecture while putting off discussion of the underlying details. This chapter fills in the gaps and describes the specific tools and algorithms that are used in implementing the user-adaptive system.
5.1
Session tracking
As a user browses through a website, the system tracks his session by recording the sequence of pages he has visited and the length of time he has spent on each page. This is accomplished in the following manner:
1. When the first page A is requested by the user, the system
(a) notes the current time (using the UNIX timestamp1) and stores it in a
variable prevT ime;
(b) adds the page to the user’s session as a pair (A, 1), where the format is (page, time spent on page). A value of 1 is used as a temporary placeholder
1The UNIX timestamp is the number of seconds since January 1, 1970. For example, a timestamp
because the system doesn’t yet know how long the user will spend on the page.
2. When the user requests the next page B, the system
(a) notes the new current time, retrieves the previous time stored in prevT ime, and subtracts the two times to find the length of time t spent on page A;
(b) modifies the pair (A, 1) for the previous page to be (A, t), reflecting the actual time the user spent on page A;
(c) stores the new current time in prevT ime;
(d) adds (B, 1) to the user’s session as a temporary placeholder.
This process is repeated when the next page C is requested. Essentially, when a new page is requested, the system will know that the user has finished browsing the previous page, and it will then also know how long the user spent on that previous page. With this information, it can then update the previous page’s entry in the session to reflect the actual time spent on that page. A placeholder entry for the current page with a time spent of 1 is used so that the current page can be factored into the cognitive style inference algorithm, which is described later in this chapter.
5.2
Session storage
Sessions are persisted to a database so that they can be read later and processed into clusters. Each session is assigned a unique ID, and each pageview in a session is per-sisted to its own row in the database. Each row has the form (session ID, timestamp, page, time spent), for example (123, 1210892590, index, 15).
When clusters are created, these sessions are read from the database, and each session is recreated by finding all the rows with that session’s ID.
5.3
Session similarity
In order to cluster sessions together and to associate a session with a cluster, we require first a definition of session “similarity”.
5.3.1
Intuition
To arrive at an accurate measure of similarity, we make the following observations:
• The more pages two sessions have in common, the more similar they should be.
• The order of pages is important – common pages viewed in the same order demonstrate higher similarity than common pages viewed in different orders.
• The time spent on each page is important – pages that users spend more time viewing are likely to be more important to the user and should therefore factor more heavily in calculations of similarity.
Various metrics for webpage path similarity have been developed that incorporate some or all of the above observations, such as in [18] and [12]. I implement the metric based upon longest common subsequences developed by Banerjee and Ghosh in [3], which I will now describe.
5.3.2
Longest common subsequence
A sequence is an ordered list of elements. A subsequence T of a sequence S is a sequence formed by removing some elements of S while maintaining the relative order of the remaining elements. For example, hB, C, E, Gi is a subsequence of hA, B, C, D, E, F, Gi, but hB, C, X, E, Gi and hB, E, C, Gi are not.
The longest common subsequence (LCS) of two sequences is the longest sequence that is a subsequence of both sequences. For example, if ~x = hA, B, C, D, E, F, Gi and ~y = hX, Y, B, E, Z, G, Di, then LCS(~x, ~y) = hB, E, Gi.
The LCS problem exhibits the useful optimal substructure property – an optimal solution to the problem can be constructed from the optimal solutions of its subprob-lems. See Theorem 15.1 in [4] for a proof of the optimal substructure of the LCS problem. Problems that exhibit this property can be solved efficiently using dynamic programming techniques. Section 15.4 in [4] outlines an O(mn) dynamic program-ming solution to the LCS problem for two sequences of length m and n. I implement this algorithm with slight modifications.
5.3.3
LCS session similarity metric
Longest common subsequences have been used in the past in computational biology to find similar strands of DNA by comparing their sequences of nucleotide bases [4]. In our application, webpages are the bases, and we use LCS to find similar sessions.
The longest common subsequence of two sessions gives a good indication of how similar the two sessions are by determining how many of the same pages were viewed in the same order between the two sessions. Therefore, this metric satisfies the first two observations listed in the previous section. This particular metric also incorporates the time spent on each page, thereby satisfying the third observation.
Before detailing the mathematical calculations, I will first formally define the various terms that have been used.
Definitions
Let a session be a sequence consisting of pairs of pages and associated time spent on each page. Let a path be the sequence of pages of a session, defined as ~α = hα1, α2, . . . , αni, and let a time vector be the sequence of times spent on each page,
defined as ~τ = hτ1, τ2, . . . , τni, The ith page of a path ~α is αi and the associated time
spent on that page is τi. A session with n pages visited can therefore be defined as
~
Session intersection
The first step of the algorithm is to find the intersection between two sessions by finding the LCS of their respective paths.
Let the two sessions be ~σ1 with path ~α and time vector ~τ , and ~σ2 with path ~β and
time vector ~υ. Suppose ~α contains m pages and ~β contains n pages, and suppose the LCS of the two paths contains l pages, where l ≤ min(m, n). Then the LCS can be defined as ~λ = LCS(~α, ~β) = hλ1, λ2, . . . , λli.
For each of the l pages in the LCS, we also extract the length of time spent on that page in each of the two sessions and store these times in two separate vectors. Let ~τLCS be the vector containing the lengths of time spent on the pages in the LCS by session ~σ1, and let ~υLCS be the vector containing the lengths of time spent on the
pages in the LCS by session ~σ2. Note that ~τLCS and ~υLCS are l-element subsequences
of the two original time vectors ~τ and ~υ.
Let the total time spent in session ~σ1 be T =Pmi=1τi, and let the total time spent
in session ~σ2 be Υ =
Pn
i=1υi. Similarly, let the total time spent on the pages in the
LCS by session ~σ1 be TLCS = Pli=1τiLCS, and let the total time spent on the pages
in the LCS by session ~σ2 be ΥLCS =
Pl
i=1υLCSi .
Session similarity
Next, we calculate the similarity between the two sessions using two components:
1. Similarity component: This component computes the similarity of the two ses-sions within their region of intersection – their LCS. For each page λiin the LCS,
we compare the length of time spent on that page between the two sessions. Specifically, we compute the min-max similarity:
si =
min(τiLCS, υiLCS) max(τLCS
i , υiLCS)
(5.1)
Thus, the similarity of each page is a maximum of 1 if the time spent by each session is the same, and it drops to 0 as the time spent diverges, which matches
our intuition. The average similarity between the two sessions over the entire LCS is the average of the similarities of each individual page in the LCS:
S1 = 1 l l X i=1 si = 1 l l X i=1 min(τLCS i , υiLCS) max(τLCS i , υiLCS) (5.2)
2. Significance component: This component computes how significant the LCS is compared to the two entire sessions. This significance is captured by computing the ratio of the time spent on the pages in the LCS to the total time spent in each entire session. For session ~σ1 this ratio is T
LCS
T , and for session ~σ2 this ratio
is ΥLCSΥ . The overall significance of the LCS in both sessions is the geometric mean of the two individual ratios:
S2 = r TLCS T × ΥLCS Υ (5.3)
The total similarity between sessions ~σ1 and ~σ2 is given by the product of the
similarity and significance components:
S(~σ1, ~σ2) = S1× S2 = 1 l l X i=1 min(τLCS i , υLCSi ) max(τLCS i , υiLCS) ! × r TLCS T × ΥLCS Υ ! (5.4)
5.3.4
Properties of the LCS session similarity metric
The LCS session similarity metric satisfies the three observations made earlier in this section: it takes into account the number of common pages, the order of pages, and the lengths of time spent on each page. The metric also exhibits some nice properties that align with our intuition:
1. If there is no overlap between the sessions, then S = 0. This is because if there is no overlap, then the LCS contains no pages, meaning that l = 0, and so S1 = 0 because the summation in Equation 5.2 is empty. In addition,
TLCS = ΥLCS = 0, and thus S
2 = 0. Therefore, S = S1× S2 = 0, as should be
2. If two sessions are identical (i.e. the same pages are viewed in the same order, and the same length of time is spent on each page), then S = 1. In this case, the LCS would equal the entire path for both sessions, implying that λi = αi = βi ∀i, and τi = τiLCS = υi = υLCSi ∀i. Hence, the
min-max similarity of each page si = 1 ∀i, implying that S1 = 1. In addition,
T = TLCS = Υ = ΥLCS, implying that S
2 = 1. Therefore, S = S1 × S2 = 1, as
should be the case.
3. In general, S falls between 0 and 1. Since the min-max ratios si all fall
between 0 and 1, S1, which is an average of the ratios, also falls between 0 and
1. Similarly, since TLCST and ΥLCSΥ lie between 0 and 1, their geometric mean S2
also lies between 0 and 1. Therefore, S = S1× S2 lies between 0 and 1.
4. The similarity measure is commutative, so that S(~σ1, ~σ2) = S(~σ2, ~σ1).
This is because the LCS operator is commutative and because we could simply swap ~α and ~τ with ~β and ~υ in the calculations and arrive at the same similarity measure. This makes intuitive sense and also eliminates half of the calculations because each pair of sessions needs to be compared only once.
5.4
Session clustering
Clustering is a general technique for classifying elements by grouping similar elements together. It was originally developed by biologists who wanted an efficient method of classifying organisms into a taxonomy [1]. Since then, clustering has been used in many other fields to perform analogous tasks.
In my system, clustering is performed using the Unweighted Pair Group Method with Arithmetic Mean (UPGMA). UPGMA is a simple clustering method originally used in biology to create phylogenetic trees [10]. It has also been used in [7] to cluster perceptual input and extract regularities in order to solve the Symbol Grounding Problem. This latter usage inspired the use of UPGMA in this thesis.
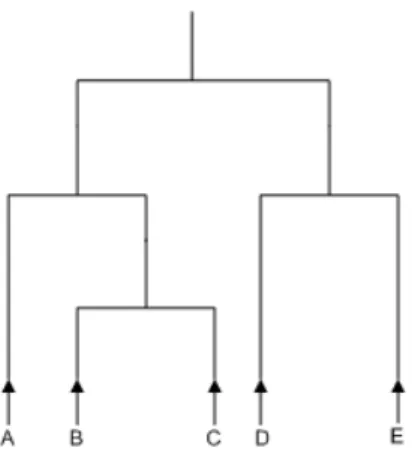
Figure 5-1: An example of a cluster tree for the elements {A, B, C, D, E}. The clusters are {A}, {B}, {C}, {D}, {E}, {B, C}, {D, E}, {A, B, C}, and {A, B, C, D, E}.
An example of a cluster tree is shown in Figure 5-1. At the root of the tree, all elements are grouped into one cluster. As you move down the tree, larger clusters are divided into smaller clusters. At the leaves of the tree, each element is in its own cluster.
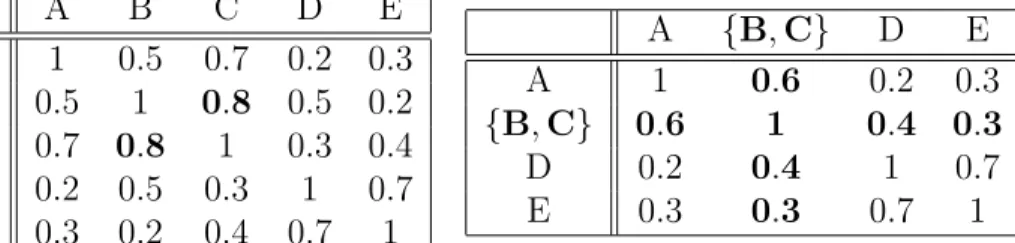
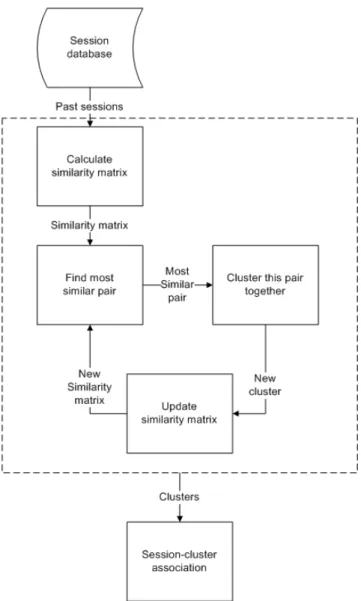
The algorithm works in the following manner:
1. Calculate the similarity matrix: For each pair of sessions, calculate their similarity. Because the LCS metric is commutative, only one computation is needed for each pair. Store these similarity values in a matrix.
After this first step is completed, the following steps repeat in a loop:
2. Find the most similar pair: From the similarity matrix, find the pair that is most similar. Ignore pairs of the same two elements, as these will always have similarity 1. Suppose this most similar distinct pair is B and C.
3. Cluster this pair together: Create a new cluster consisting of this pair. Note that B and C may themselves be clusters. The new cluster’s label is the combination of the two original labels: {B, C}.
4. Update the similarity matrix:
(a) Create a new row and column for this new cluster containing the similar-ities between this cluster and all other elements. For each element, the
A B C D E A 1 0.5 0.7 0.2 0.3 B 0.5 1 0.8 0.5 0.2 C 0.7 0.8 1 0.3 0.4 D 0.2 0.5 0.3 1 0.7 E 0.3 0.2 0.4 0.7 1
(a) The initial similarity matrix. B and C are the most similar pair.
A {B, C} D E A 1 0.6 0.2 0.3 {B, C} 0.6 1 0.4 0.3 D 0.2 0.4 1 0.7 E 0.3 0.3 0.7 1
(b) The updated similarity matrix after clustering B and C together.
Table 5.1: An example iteration of the clustering algorithm.
similarity between it and the new cluster is the average of the similarity between the element and B and the similarity between the element and C. (b) Remove the rows and columns of B and C from the similarity matrix.
After each iteration of the last three steps, a new cluster is created and the matrix loses one row and one column. To generate a desired number of clusters, such as 12, this process is repeated until the matrix has only 12 rows and 12 columns remaining. At this point, each row corresponds to one cluster, and the label of each row contains all of the elements belonging to that cluster. This entire process is shown in Figure 5-2. An example iteration of this algorithm is also shown in Table 5.1.
5.5
Inference algorithm
As shown in Figure 4-2, the inference module takes as input the current user’s session and a history of past sessions. The two inputs are processed and then combined to produce the final inference of the user’s cognitive style.
5.5.1
Rating the current session
The overall style rating of a session is a weighted average of the style rating of each page in the session, where the weight is a combination of the length of time spent on the page and how long ago the page was viewed:
Figure 5-2: The clustering algorithm reads in past sessions from the database and computes the clusters to pass to the session-cluster association component.
• Time factor: Ratings of pages on which the user spent more time are weighted more heavily. Specifically, the page on which the user spent the most time has weight 1. All other pages have weights equal to the ratio of the time spent on that page to the maximum time.
• Recency factor: Ratings of pages viewed more recently are weighted more heavily. Specifically, the current page has weight 1, and each previous page has weight one-half that of the next page.
# Page Time spent (sec) D1 D2 1 Index 5 0.8 0.5 2 Sports 20 0.6 0.5 3 Scores 30 0.4 0.4 4 Player profile 15 0.2 0.3 5 News 60 0.8 0.2
Table 5.2: An example of a hypothetical session.
Let each page have a rating of the form r = (d1, d2) along the defined dimensions.
For example, the hypothetical page “Index” in Table 5.2 would have a rating of r = (0.8, 0.5).
Using the same notation as defined earlier in the chapter, let a session ~σ consist of a path ~α and a time vector ~τ . The session then also has a sequence of ratings ~r = hr1, r2, . . . , rni, where each ri corresponds to the style rating of the ith page in
the session. The nth page is the most recent page viewed.
The overall rating of a session is then defined as:
R~σ = 1 N n X i=1 1 2n−i · τi τmax · ri, (5.5)
where τmax is the longest time spent on any one page, and N =
Pn i=1 1 2n−i τi τmax is the
normalizing factor. In the equations above, multiplication or addition of style ratings operates on each style dimension separately. Table 5.3 shows an example calculation using a session of 5 pages shown in Table 5.2.
This weighted averaging produces an overall rating for the current session, which can be interpreted as the probability that the session belongs to a particular style. Let this rating be I.
5.5.2
Rating past sessions
The past sessions are grouped into clusters using the clustering algorithm described in the previous section. Each cluster is assigned a numerical ID, and each session is then assigned the ID of the cluster it belongs to.
Player
Page Index Sports Scores profile News Total Recency factor 161 18 14 12 1 × × × × × × Time factor 605 2060 3060 1560 6060 = = = = = = Combined factors 0.005 0.042 0.125 0.125 1 = 1.297 × × × × × × D1 rating 0.8 0.6 0.4 0.2 0.8 = = = = = = Weighted rating 0.004 0.025 0.05 0.025 0.8 = 0.904 Overall D1 rating 0.904 ÷ 1.297 = 0.697 Table 5.3: The calculation of the style rating of dimension D1 for a hypothetical session. The calculations of the style ratings of other dimensions are analogous.
to find the one to which it is most similar. Suppose that this most similar session belongs to cluster X. Then, for each session in X, we perform the same weighted averaging of style ratings described in Equation 5.5. These average style ratings are then averaged together to produce an overall style rating for the entire cluster. Let this style rating be C.
5.5.3
Combining the two ratings
The final style rating F of the user is the average of the two style ratings produced: F = I+C2 . See table 5.4 for an example of this calculation. This scheme places a relatively heavy weight on the current session itself, but also takes into consideration similar past sessions. This combination provides a balanced measure of the user’s cognitive style.
5.6
Webpage recommendations
Given the most similar cluster to a session, the system can also find the most likely pages to be viewed next and proactively recommend these pages to the user.
Suppose that the current session is ~σ, the most similar cluster to ~σ is X, and the current page is α. For all the sessions in cluster X, we select the ones which visited
Current Most similar Final session cluster {β, γ, δ} style
I β γ δ Total C F D1 0.8 0.8 0.7 0.6 0.7 0.75 D2 0.4 0.5 0.4 0.3 0.4 0.4
Table 5.4: The calculation of the style of an example session using its associated cluster: first calculate the style rating of the current session (I); then calculate the style rating of each session in the most similar cluster {β, γ, δ} and average together to get C, the style rating of the cluster; finally, average I and C to get the final style rating F of the user.
the current page α at some point in their paths. For each of these sessions, we find the next page that was visited after α and rank these next pages in order of frequency. The system can then recommend the most frequent pages to the user as potential next pages to visit.
Chapter 6
System Implementation
This chapter explains in detail how the system described in Chapters 4 and 5 is implemented as a functioning user-adaptive website with information palettes.
6.1
Application
The system was implemented as a customer advocacy website for General Motors1.
The goal of the website is to give users access to a wealth of unbiased information to enable them in making an enlightened choice about purchasing a vehicle. Ultimately, the business-oriented goal is to improve GM’s online marketing and increase sales of its vehicles.
6.1.1
Website design
The website is divided into 6 sections, each containing a different type of information for car buyers. Each section consists of several webpages that contain relevant infor-mation. A site tree is shown in Figure 6-1. On the left of each page, a navigation panel provides direct links to each of the 6 main sections, as well as information about the user’s current session and estimated style. The user-adaptive information palette appears at the bottom of each page. See Figure 6-2 for a screenshot of the layout.
Figure 6-1: The site tree of the website
This design follows the one defined in [6] and is devised to contain webpages that appeal to the extremes of each style dimension in order to make each pageview most informative about the user’s style. The application-specific content, such as vehicle specifications, is borrowed from the existing GM.com website.
6.2
Prerequisite definitions
As mentioned in Chapter 4, the system requires certain definitions, which will now be explained.
6.2.1
Cognitive style dimensions
The cognitive style dimensions that are used in this implementation are listed in Table 6.1.
Figure 6-2: A screenshot depicting the layout of the website. The left panel contains navigational links to the six main sections. Below these links, the current estimate of the user’s style is shown, along with the current session and the style rating of the most similar cluster of past sessions. The main content and the information palette lie to the right.
Deliberative-Impulsive, this implementation incorporates a novel dimension: stage in the buying process. The inclusion of this dimension was motivated by the specific application of car-buying: it is important to distinguish what stage in the buying process a user is in so that the system can show the user relevant information for that stage.
Dimension “0” “1” “2” D1 Analytic Holistic – D2 Deliberative Impulsive –
S1 Browsing Learning Buying
Table 6.1: The cognitive style dimensions used in this implementation. “Stage in the buying process” is used as an additional dimension with which to characterize users.
This implementation distinguishes between three distinct stages:
1. Browsing: The user is not seriously considering buying a car. He is mostly browsing the website because he is curious about the different cars and their features.
2. Learning: The user is considering buying a car. He is using the website to learn more about the cars he is interested in to narrow down the few he will seriously consider.
3. Buying: The user is ready to buy a car. He has narrowed his choices down to a few cars. He is using the website to pinpoint the exact car he wants to buy and to find dealer locations, current promotions, and financing information.
I will use the general term style to refer to the combination of cognitive styles and stage in the buying process. A style is defined as a vector along the 3 dimensions. Using the numbering notation given in the table, we can identify a specific style using its unique 3-digit string. For example, Analytic-Deliberative-Learning can be represented as “001”.
6.2.2
Webpage ratings
Each webpage is assigned a rating over the 3 style dimensions. I rated each page subjectively by considering the definitions of each style dimension. The complete set of ratings can be found in Appendix A.
Figure 6-3: An example information palette for the style Analytic-Deliberative-Learning. Note that the information is detailed and broken down into individual specifications in order to cater to the analytic and deliberative styles. By comparing to other cars to help users narrow down their choices, the information is also geared to those who are in the Learning stage.
6.3
Creating different information palettes
Different versions of information palettes were created to match each style. The palettes were created as images, and each version is named by its style string (e.g. the Analytic-Deliberative-Learning palette is named “001.png”). The appropriate one for a particular user is later retrieved and displayed at run-time. An example of an “Analytic-Deliberative-Learning” information palette is shown in Figure 6-3. See Appendix B for the complete set of information palettes.
6.4
Website implementation
The website was created using the CakePHP framework2, with a combination of PHP, HTML, JavaScript, CSS, and MySQL database.
CakePHP is a rapid development framework for PHP-based applications. It uses the Model-View-Controller design pattern to isolate the data (Model), the webpages
that are displayed (View), and the logic controlling the system behavior (Controller). The framework also simplifies interaction between the three components by providing convenient built-in functions and features. In particular, CakePHP provides a simple interface for passing variables and data between the View and Controller. This allows the Controller to tell the View which information palette to display.
6.4.1
Model
The Model is used to store the session data to the database. As each new page is viewed by the user, the Model sends a request to the MySQL database to insert a new row corresponding to the new page. The Model is also used to retrieve past sessions from the database in order to perform the clustering algorithm.
6.4.2
Controller
The Controller performs all of the logic behind the system, including session tracking and inference. Each webpage has a handler function in the Controller that is called when the page is accessed by the user. These functions perform the following tasks, which are aligned with the processes within the Inference module shown in Figure 4-2:
1. Update the session to include the current page,
2. Determine the cluster to which the current session belongs,
3. Update the inference of the user’s style,
4. Select the information palette to be displayed and pass the choice to the View.
6.4.3
View
Each webpage has an associated View, which defines the content that is shown when that page is accessed. It consists of standard HTML, with PHP used to access data passed from the Controller. Each View contains a slot for inserting an information
palette. The View receives the Controller’s choice of an appropriate information palette in the form of a vector, such as “011”, and retrieves the correspondingly named information palette for display.
6.5
Results
Perhaps the best way of demonstrating the results is through a series of screenshots depicting the changes in the information palettes as a session progresses. Figures 6-4 through 6-7 show a session in which the user navigates from the homepage, to the Data section, to the Fast Solutions section, and finally to the Deals & Promotions webpage.
The session occurs as follows:
1. The system begins by assuming the user has the Holistic-Impulsive-Learning style, and the information palette shown reflects that style. Note that all of the style ratings begin in the middle: 0.500 for D1 and D2, 1.000 for S1.
2. The user visits the Data section, suggesting that he is analytic and deliberative. The style rating of the current session updates to become more analytic and deliberative. The session as a whole matches most closely past sessions that mostly visited the Data section; therefore, the style of the associated cluster is even more analytic and deliberative. The overall style of the user is the average of these two ratings. The information palette adapts to display detailed, numerical information to appeal to the analytic and deliberative style.
3. The user visits the Fast Solutions section, suggesting that he is impulsive and also late in the buying process. However, the system does not immediately assume this is true because the user may have mistakenly clicked the wrong link and because the session does not yet match any past Impulsive-Buying sessions.
4. The user visits the Deals & Promotions page under the Fast Solutions section. This gives a stronger indication that he is impulsive and late in the buying
pro-cess. Accordingly, the style of the current session updates to be Impulsive and Buying. In addition, the session now matches past sessions that were Impulsive-Buying; therefore, the style of the most similar cluster is also Impulsive and Buying. The information palette changes to reflect this new style: it displays incentives for scheduling a test drive and a link to locate local dealerships.
Figure 6-4: The first page in the session: The system begins by assuming the user has the Holistic-Impulsive-Learning style, and the information palette shown reflects that style. Note that all of the style ratings begin in the middle: 0.500 for D1 and D2, 1.000 for S1.
Figure 6-5: The second page in the session: The user visits the Data section, sug-gesting that he is analytic and deliberative. The style rating of the current session updates to become more analytic and deliberative (see “Session style”). The session as a whole matches most closely past sessions that mostly visited the Data section; therefore, the style of the associated cluster is even more analytic and deliberative (see “Cluster style”). The overall style of the user is the average of these two ratings (see “Current style estimate”). The information palette adapts to display detailed, numerical information to appeal to the analytic and deliberative style.
Figure 6-6: The third page in the session: The user visits the Fast Solutions section, suggesting that he is impulsive and also late in the buying process. However, the system does not immediately assume this is true because the user may have mistakenly clicked the wrong link and because the session does not yet match any past Impulsive-Buying sessions.
Figure 6-7: The fourth page in the session: The user visits the Deals & Promotions page under the Fast Solutions section. This gives a stronger indication that he is impulsive and late in the buying process. Accordingly, the style of the current session updates to be Impulsive and Buying (see “Session style”). In addition, the session now matches past sessions that were Impulsive-Buying; therefore, the style of the most similar cluster is also Impulsive and Buying. The information palette changes to reflect this new style: it displays incentives for scheduling a test drive and a link to locate local dealerships.