THE DESIGN AND IMPLEMENTATION OF
MATERIAL AND INFORMATION FLOW FOR
MANUFACTURING SYSTEMS
by
Brandon J. Carrus B.S. Mechanical Efjineering
Massachusetts Institute of Technology, 1998
SUBMITTED TO THE DEPARTMENT OF MECHANICAL ENGINEERING IN PARTIAL FULFILLMENT OF THE REQUIREMENTS FOR THE DEGREE OF
MASTER OF SCIENCE IN MECHANICAL ENGINEERING
AT THE
MASSACHUSETTS INSTITUTE OF TECHNOLOGY JUNE 2000
0 2000 Massachusetts Institute of Technology. All rights reserved.
Signature of Author:
Certified By:
16artment of Mechanical Engineering May, 2000
David S. Cochran Assistant Professor of Mechanical Engineering Thesis Supervisor
Accepted By:
A. Sonin
MASSACHUSETTS INSTITUTE Professor of Mechanical Engineering
OF TECHNOLOGY Chairman, Graduate Thesis Committee
THE DESIGN AND IMPLEMENTATION OF
MATERIAL AND INFORMATION FLOW FOR
MANUFACTURING SYSTEMS
by
Brandon J. Carrus
Submitted to the Department of Mechanical Engineering On May 19, 2000 in Partial Fulfillment of the Requirements for the Degree of Master of Science in
Mechanical Engineering
ABSTRACT
Production systems are characterized by complex interactions between elements, both human and mechanical, with the goal to accomplish certain high-level manufacturing objectives. In order to ensure that the decisions made and the actions taken during the design and
implementation of production systems are aligned with all of the objectives, a structured approach must be followed. In developing this structured approach, the axiomatic design methodology is applied, which provides the means for creating a hierarchy of system design objectives (what to do) and solutions (how to do it).
From this conceptual design process, a Production System Design and Implementation
(PSDI) Path is presented here. The PSDI Path guides the design through a series of steps in
creating a successful physical manufacturing system environment in terms of the original high-level objectives.
Defining the material and information flow in the system is a critical part of the PSDI path. Based on the steps in the PSDI Path and the design hierarchy, a procedure for constructing the material and information flow in the production system is developed. To aid in the design of material and information flow in the manufacturing system, a manufacturing system modeling environment is developed as the tool for visualizing and communicating the flow in the manufacturing system design.
KEYWORDS: Lean Manufacturing, Value Stream Management, Manufacturing System Design,
Production System Design, Cellular Manufacturing, Axiomatic Design
Thesis Supervisor: David S. Cochran
Table of Contents
1
IN T R O D U C T IO N
...
11
1.1 The Third Industrial Revolution ... 11
There is no universal production system design solution ... 14
M o tiv atio n ... 14
Definition of a manufacturing and production system ... 15
Improvements from a systems perspective... 18
1.2 Problem Statem ent...20
1.3 Research Objectives... 20
2
SCOPE, FLOW AND FOCUS
...
23
2.1 Levels of scope ... 23
2 .2 F lo w ... 2 3 2 .3 F o cu s ... 2 4
3
A X IO M A T IC D E S IG N
...
29
3.1 Design Dom ains...30
C u sto m er D om ain ... 3 1 F u n ctio n al D o m ain ... 3 1 P h y sical D om ain ... 32
P ro cess D o m ain ... 3 3 3.2 M apping and Decom position... 34
3 .3 A x io m s ... 3 5 Axiom 1: The Independence Axiom ... 35
Axiom 2: The Information Axiom ... 36
3.4 Design M atrix and Coupling... 36
Im p lem entation o f design s ... 40
3.5 Applying Axiom atic Design to M anufacturing System s... 41
4
THE CONCEPTUAL MODEL OF PRODUCTION SYSTEM
DESIGN 43
4 .1 D efin itio n s ... 4 3 4.2 Design Hierarchy ... 464.3 The Conceptual Design Process... 47
M anagem ent A pproach to psd... 48
Engineering and Operator Approach to psd ... 49
Mapping Technique ... 49
Decomposition Technique... ... 49
4.4 Beginning the Design of Production System s... 51
5
THE PRODUCTION SYSTEM DESIGN & DEPLOYMENT
F R A M E W O R K
...
55
5.1 Design Decom position... 58
P S D D eco m p o sition ... 5 8 F R /D P E x am p les... 6 1 5.2 Interrelationships in the PSD ... 62
D e sig n M atrix ... 6 2 F lo w ch art ... 6 3 5.3 System Perform ance ... 63
Performance Measures (PM)...68
E v alu atio n T o o ls ... 6 8 5.4 The PSDI Path ... 69
6
THE ANALYTICAL MODEL OF PRODUCTION SYSTEMS...79
6.1 Object-Oriented M odeling (OOM )... 81
6.2 M odeling Production System s... 82
E le m e n ts ... 8 3 C ontinuous Flow E lem ents... 84
S W IP E lem en ts ... 8 5 L in k s ... 8 5 L in k O bject A ttrib u tes...8 6 6.3 Integrated Structures... 88
M ach in e s ... 8 8 C e lls ... 8 9 Information Leveling and pacing (Heijunka)... 92
S h ipp in g & S ch edu ling ... 9 3 B u ild -to -S to ck ... 9 3 B u ild -to -O rd er... 9 5 6.4 System M apping Technique ... 96
Modeling existing systems (Brownfield)... 97
6.5 Designing N ew (Greenfield) System s W ith M odeling... 97
7
DESIGNING LINKED-CELL MANUFACTURING SYSTEMS....99
7.1 Design Requirem ents... 99
7.2 Linked-Cell System D esign Procedure... 102
Capacity planning and Focus ... 102
T ak t tim e calcu lation ... 10 3 Design of system flow in 5 Steps... 104
1 B atch size an d lo t size ... 104
2 Location of SWIP (Decoupled Flow)...106
3 First production authorization (PA) point...107
4 SWIP Levels and Replenishment Routines...107
8
APPLICATION OF
THE
PSDI PATH...111
8 .1 In itia l S tate ... 1 1 1 Step 1: A lign Business Perform ance M easures... 112
8.2 L inked-C ell System D esign ... 113
Step 2: D efine Focus and C apacity ... 113
Steps 3 & 4: Identify Custom er Groups and Takt Tim e ... 115
Step 5 : D efin e S y stem F low ... 117
Initial Step s: D efine C ontinuous Flow ... 117
Step 5.1: B atch Size and L ot Size ... 118
Step 5.2: Location of SW IP (D ecoupled Flow )...118
Step 5.3: First Production A uthorization Point...119
Step 5.4: SW IP Levels and Replenishm ent Routines...120
Step 5.5 : E stablishing L inks/L oops...12 1 Steps 6 & 7: Form Cells Based on Takt Time & Setup Reduction... 124
StepS 8 & 9: Level Assembly and Operation with High SWIP ... 126
Steps 10: tow ards SW IP R eduction... 126
Steps 11 & 12: Supplier and Product Developm ent ... 128
9
CONCLUSION
...
1.30
APPENDIX A - THE PSD DECOMPOSITION...133
APPENDIX B - THE PSD DESIGN MATRIX...139
Acknowledgements
To fully describe the feeling you get at the completion of the thesis would be impossible, but it's something like reaching the peak of a mountain after years of climbing up and falling down. To all of those people who have helped me along the way, this is my chance to say that I am genuinely grateful for all of your support.
My experience in the Production System Design Laboratory at M.I.T. was truly
rewarding in all aspects, and I would like to give thanks to all the PSD-ers who made trudging through this research a pleasure. Alex Chu, David Estrada and Ania
Mierzejewska each deserve a special thank you for putting up with me and being my partner on "The Book," "The Class," and "The Monroe Project," respectively. I am very
sad that our work must come to a close, and I would be delighted to get the chance to see you in the future (I know I will!). To Pat Smethurst, who is by far the most valuable PSD-er of all time, I thank for all the conversation and enlightenment: your perspective
on work and life has been rewarding. And to the chief, Professor David Cochran, I send a million thanks for giving me the opportunity to grow so much over the past 3 years. You have opened my mind in ways I never could have imagined. I would welcome any chance to work with you again in the future.
One day I woke up and found myself in Monroe, Michigan, working in a factory. There,
I learned more about the way to really design effective systems than I ever had before,
and I thank all the players for your open-mindedness, support and understanding: Larry Hinkle, Tim Rosengarten, Mike Foley, Bill Nolan, Phil Wylie, Erik Engel, Nick Uran, Ed Patino, Jin Kim, Donna Sannow, Dale Rathbun, and especially the front-line: the
operators.
Most of all, I wish there was a way to tell my friends and family how truly important they have been to me through all this. To all of the Michigan folks: Bobby T, Yvonne, Travis, Jen H., Veronica, Cori, Jen G., Carla, Cheryl, Andy and Lara, Blair, Erle and Heather, who would of thought we could have so much fun? Thank you all for taking me in and
becoming my friend. To Adam, Alex and Waleed: you guys rock the planet. We must use that tape recorder: we could the world. To Carole, I know you will never read this., but I didn't forget you. You know that I know that you are the coolest. To Tom and Holly: you two understand me better than anyone, and for that I thank you. I love you both very much. To my brothers, who I enjoy spending time with more than anything, I'm done! Now let's go cause some trouble. To my parents (all of them), whom I love very very much, each of you has helped me in your own special way, and I thank you for being yourselves. Mom, you get your own special sentence because you are the most
special person around. I love you with all my heart. Dad, you do too, because I need you to know how much you mean to me. You've taught me so much about life, even when you weren't trying to. To Grandma, you can't imagine how much influence you have had over me during my whole life, and when I look back on something like this I truly understand that I owe it all to you and Pop. Tell him that I love him very much and that I finally made it.
And finally, to triumphantly end two years worth of work on this thesis, I must say something to that ever-so forgotten group of inanimate objects that were so important during the climb. I send my regards as we end this love-hate relationship of ours: Dell computers, Microsoft Word, Waleed's coffeemaker, the lab printer, the M.I.T. campus, Trident Booksellers, Toscanini's, and that gosh-dam parking ticket giver-outer. I will remember you all.
1
Introduction
1.1 The Third Industrial Revolution
In his book The Structure of Scientific Revolutions, Thomas Kuhn presented the notion of progress in science as a series of revolutionary events followed by widespread development of the new concepts. Major advancements in all areas of technology such as biology, computer science and manufacturing tend to follow a progression through three phases, from a state of relative disorder toward structured development. These scientific revolutions begin in "crisis phase." [Kuhn, 1970] The conditions in society create a strong need for improvement in a particular area of technology. The Industrial Revolution followed this model, and the crisis phase in America can be traced back to the need for industry to support the development of a stronger military in the late 1 8th
century. The crisis phase is characterized by a vast difference between the perceived needs of society and the lacking state of technology.
Technology then emerges from this crisis phase into a state of "revolution," during which scientific progress begins to close the gap between technology and societal need. An innovative concept will spark this transition and will lead to progress in a specific direction. Almost 3 decades after Thomas Jefferson proposed a contract for 4000 muskets to be manufactured with interchangeable parts, a system of inspection with standard gages was introduced at the Springfield Armory. The gages would later prove to be the fundamental tool behind the early success of the industrial revolution in the U.S. [Hounshell, 1984]
With the goal now attainable, the innovation spreads. This phase of "normal science" is characterized by the spread of not only the new technological concepts, but also the core knowledge base behind it. Researchers follow a more structured path toward observing and understanding the technology progression, followed by iterations of experimentation and learning. The technological change diffuses throughout society until it becomes
common practice. The Industrial Revolution, for example, is still happening today, and it has already changed the course of society in ways that could not have been imagined at its onset. Similar examples of scientific revolutions came from the introduction of relativity and quantum mechanics, theories that have given rise to the nuclear energy and microelectronics revolutions, respectively [Hawking, 1988].
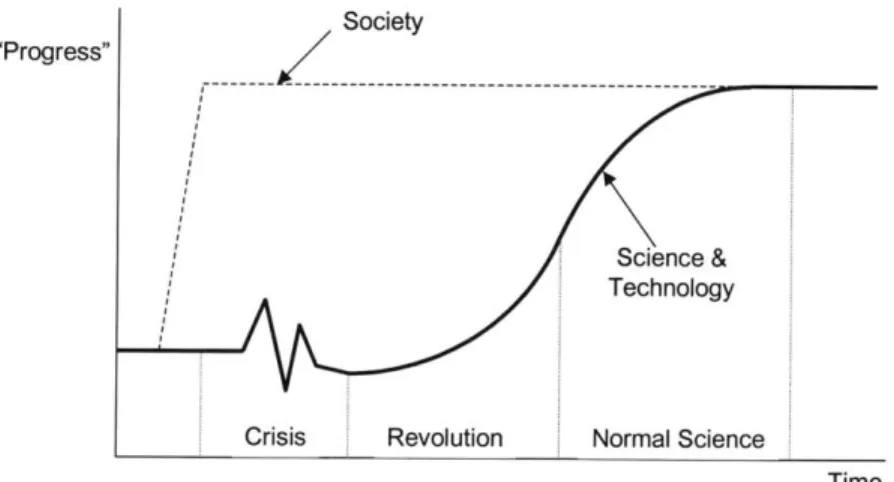
Figure 1.1 is an interpretation of this model of scientific revolutions. Progress, used here to mean either the perceived needs of society or the advancement of science and
technology, is plotted versus time. Two curves are shown. The dashed line represents a changing society and the solid line represents how progress in science and technology lags behind societal need.
Society "Progress"
science & Technology
Crisis Revolution Normal Science
Time
Figure 1.1
A model of the progress of scientific revolutions relative to societal need [adapted from Kuhn, 1970]
The industrial revolution has happened in waves. The first wave described above, resulted in the ability to produce field serviceable products in large quantities, thanks to interchangeable parts. During the second wave of the industrial revolution, many sought a way to improve the quality of transportation by manufacturing automobiles efficiently. With Henry Ford's assembly line at Highland Park in 1913, that goal was achieved, and the concept of mass production spread throughout the manufacturing world over the past century. [Hounshell, 1984]
The third wave of the industrial revolution has been progressing since the end of World War II. The crisis phase first took place in Japan, which, after the close of the war was in a state of economic distress. The existing mass production approach to manufacturing no longer suited the needs and constraints of Japanese industry. In other words, the
assumptions behind the success of mass production were no longer applicable in post-war Japan. The success of the Ford system lied in its ability to minimize cost factors by efficiently producing in large quantities. [Hounshell, 1984] Huge amounts of capital investment and seemingly infinite market demand supported this approach to mass production for decades preceding WWII, but post-war Japan saw different requirements
for its production systems. [Cochran, 1994]
This state of economic stress is the environment in which the Toyota Production System
(TPS) was born and developed into a fierce strategy of eliminating waste- in all forms.
Later coined Lean Manufacturing by the MIT International Motor Vehicle Program (IMVP) and Machine that Changed the World [Womack, Roos, Jones, 1990], the Toyota Production System has been the innovation, or the "technology" in our third wave of the industrial revolution. Just as Ford's mass production system revolutionized
manufacturing through the 201h century, TPS will re-revolutionize the discipline of Production System Design.
Using Kuhn's term, this thesis exists in the context of the "revolution" phase of the 3rd wave of the industrial revolution and is intended to support the ongoing research in the Production System Design Laboratory at the Massachusetts Institute of Technology in Cambridge, Massachusetts. Based on the advancements in the design, implementation and operation of production systems there is a motivation for the development of knowledge and tools that enable those who interact with production systems to ensure that it is designed properly; production systems must be designed as systems.
THERE IS NO UNIVERSAL PRODUCTION SYSTEM DESIGN SOLUTION
Rather than think of a particular production system design, such as TPS or "lean"
manufacturing as a ubiquitous solution that accomplishes any objective, it is necessary to design production systems based on the explicit manufacturing and business strategic objectives. No production system design can be thought of as universal; the optimal production system design varies with industry, product and time. [Suh, Cochran, Lima,
1998] Therefore, it is necessary to approach the design of production systems as a
methodology that links the manufacturing and business strategy to the specific goals and solutions of the production system design.
MOTIVATION
The need for a structured approach to Production System Design (PSD) and a PSD Framework to provide the necessary tools stems from the realization that:
(a) The production system plays a significant and increasingly intensive role in the business, the industry and market, and society. Manufacturing and production is only one individual element of an entire business, but it may be a company's strongest competitive weapon. In terms of all of the sources of competitive advantage (price, quality, leadtime, reliable delivery, product/process innovation, product/process flexibility, field service) the decisions made in manufacturing system design, implementation and control will determine the level to which the business will succeed.
(b) The production system is a complex engineering system that is composed of technical
elements of all natures, both human and mechanical. Every decision in production system design, implementation and control involves an interaction of objectives and solutions. The PSD Framework provides the means for communicating the choice of solutions and guaranteeing that the solutions chosen will independently achieve all
objectives. [Cochran, 1998] This approach to system design is especially important for production systems in which humans are playing a critical role in performing both direct labor tasks and system control tasks (both long-term and short-term control). It is common for systems with this characteristic of human participation and supervision to be misdirected by the decision-makers. The decision-makers tend to get trapped in traditional modes of thinking (mental models), and often the best solutions to
problems are hidden by the structure of the system [Senge, 1990].
(c) The production system is a system that is designed and operated with the impetus of
achieving simultaneous goals. There exist several frameworks and methods that
classify a complete set of system objectives, from which a subset can be derived that describes the specific goals of a particular production system [Hayes, Pisano, 1996].
The PSD Framework provides clear definition of objectives (what to do) and physical solutions (how to do it). "The goal is to provide a means for communicating and deploying a system design to numerous people. The Framework uses the axiomatic design methodology to prevent confusion and the blind and rote application of rules."
[Cochran, 1998]
DEFINITION OF A MANUFACTURING AND PRODUCTION SYSTEM
A manufacturing system is a group of physical objects arranged to transform raw material
into finished product. [Black, 1991] These physical objects include machines, tools, material handling equipment and people. Along with the raw material, a manufacturing
system also requires information (customer orders, current system status), capital
(money, equipment, fixed assets) and energy (labor, power, support resources) as inputs. The total output includes finished product, information, waste and profit.
Manufacturing systems are affected by internal and external disturbances, and can be evaluated by measuring its intrinsic parameters (cost, time, quantity, area). The
customers of the manufacturing system are those who receive finished product from the
A production flow value stream is a way of mapping a manufacturing system. "A value
stream is all the actions (both value-added and non-value-added) currently required to bring a product through the main flows essential to every product: the production flow from raw material into the arms of the customer." [Rother, Shook, 1998]
Depending on how the system boundaries are defined, the customer of the manufacturing system value stream may be a retailer, a distribution channel, a processing plant, or a downstream function in the same plant. Important attributes of the system are defined by the system's functional requirements (formally defined in chapter 3) and are measured by the system's performance measures. A formal model of the control of manufacturing systems is presented in section 5.3.
The production system includes the manufacturing system and all functions required for the support, operation and control of the manufacturing system. Maintenance,
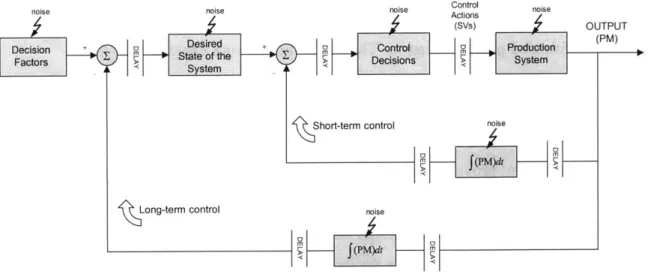
engineering, human resources, accounting, sales and marketing are examples of resources that are part of the production system. A sub-function of the production system is the performance measurement system, which acts as a control mechanism for the
manufacturing system. The set of variables being measured, along with the chosen target values, will determine the type of system that exists. In other words, a production system with a purely cost-based performance measurement scheme will be very different from a production system with performance measurement scheme that rates production cost, quality and lead time. [Cochran, Kim, Kim, 2000] Figure 1.2 shows a graphical representation of production systems. [adapted from Cochran, 1994]
Support Maintenance Engineering Marketing Accounting Material In Information In Energy Capital Production System Control P People Processes Equipment Tools Mat'l Handling Manufacturing System erformance Measures Products Out Information Out Waste Profit (or Loss)
Figure 1.2
A graphical representation of production systems
Production System Design presents a significant challenge to those involved mostly because of a single characteristic: the human element. To fully define the structure of a production system, one must consider the role that humans play. A set of characteristics of human systems, [from Senge, 1990] include:
1. Structure influences behavior. Not all system responses are the fault of external disturbances or an individual's decisions and actions. Most system responses are determined by the functional structures of the system (e.g., human resources and performance measurement). This phenomenon of human systems is modeled in the Beer Game simulation in which a system will exhibit strikingly similar responses when operated by different
individuals [Sterman, 1992].
2. Structure in a human system is subtle. "Systemic structure is concerned with the key interrelationships that influence behavior over time. These are not
between people, but among key variables." In a production system, this may include processing times, information transfer delays and reliability rates. "It is very important to understand that when we use the term 'systemic structure' we do not just mean structure outside the individual. The nature of structure
in human systems is subtle because we are part of the structure. This means that we often have the power to alter structures within which we are
operating." [Senge, 1990]
3. Leverage often comes from new ways of thinking. Because of limited focus,
people often overlook their ability to change the system. "More often than not, we do not perceive the power [to alter structures within which we are operating]. In fact, we usually don't see the structures at play much at all. Rather, we just feel ourselves compelled to act in certain ways." [Senge,
1990] New ways of thinking about how to design and operate production
systems will provide greater advancements than trying to optimize the existing faulty system design.
IMPROVEMENTS FROM A SYSTEMS PERSPECTIVE
In designing and managing complex systems, it is critical to view change from a systems perspective. Each decision in the design, implementation and control of production systems should be derived in terms of the objectives of the system. Problems must be solved at the root cause in order to avoid wasteful optimization efforts. In the decision-making process, keeping a narrow view of a part of a system will lead to the optimization of particular operations, rather than the optimization of the overall system. It is important to define value from the viewpoint of the customer. What is the customer willing to pay for? Is it possible to eliminate all the operations that do not add value, rather than spend resources optimizing wasteful areas?
For example, systems that have been designed properly will have minimal waste. Operations will be linked closely to their downstream customers, quality levels will be
consistently high and delays in throughput will be consistently low. A system that has not been designed, but has been optimized will show signs of waste. [Shingo, 1989] For
example, final quality checks, expensive material handling systems and large levels of inventory are all examples of "improvements" attempting to compensate for fundamental problems in the system design.
TPS has demonstrated its ability to eliminate waste and make effective systems
improvements. The notions of eliminating non-value added operations and eliminating problems at the root cause level serve as tools to support the focus of banishing waste. In production systems, waste comes in several forms [Cochran, 2000]:
Forms of Waste in a Production System
1. OVERPRODUCTION (producing too much and/or too early) 2. INVENTORY (to hide problems between operations)
3. TRANSPORTATION (moving parts)
4. EXCESS PROCESSING (unnecessary steps)
5. DEFECTS (quality problems as seen by the customer requiring rework or scrap)
6. MOTION (unnecessary worker movements)
7. WAITING (workers waiting for machines or parts)
Production systems must be designed with simultaneous goals in mind. All elements of the system must be operating in harmony to ensure that all performance criteria are being optimized. This design process is by no means easy, but it is the most important theme in all of this research. It is a challenge that will be faced by all those involved with
manufacturing system design, implementation and control. The research presented here has been developed in attempt to better enable success in manufacturing by aligning the approach of production system design with the theme of making systemic improvements.
How do we understand the interaction between all of the areas of the production system (people, equipment, flow, etc.)? To answer this question, it is critical to understand design objectives (what to do) vs. design solutions (how to do it). For every physical
system parameter or object, there is a set of objectives that it should be accomplishing. First, these objectives must be developed by decomposing the high-level goals. Then, solutions must be designed for the objectives, and finally, the solutions must be
implemented as physical system objects. A framework for performing these three tasks is presented in chapter 4 as the Production System Design and Implementation (PSDI) Path.
The trend in the implementation of lean manufacturing over the past decade has been to observe and implement particular "lean concepts" as seen in TPS. These misdirected efforts are not complete systems implementation, and many researchers have pinpointed this issue as the reason for failure in manufacturing. A system design must accomplish the high-level system goals and conditions. [Suh, Cochran, Lima, 1998] An effective system design cannot be assembled from a set of low-level elements of best-practices. [Spear, Bowen, 1999] [Cochran, 1998]
1.2 Problem Statement
The design and implementation of a manufacturing system must be approached from a systems perspective as defined above. In particular, the design of the material and information flow in a system must be matched with the high-level objectives of the business. In order to ensure that these objectives are met and embodied in both the
conceptual and physical designs, there should be a set of tools developed to aid in the design and implementation of these flow systems. Prior work has been done to develop a complete set of production system functional requirements (objectives) and design
parameters (design solutions) to apply to a production system design.
1.3 Research Objectives
As part of the approach to the design of manufacturing systems from a scientific and systematic perspective, a framework will be constructed for discussing the interaction between strategy, objectives, design solutions, constraints, performance measures and implementation. The specific tasks necessary for successful design and implementation of manufacturing systems will be summarized in the creation of the Production System
Design and Implementation (PSDI) Path. The design of material and information flow in the system, a critical link between the high-level system objectives and the detailed subsystem design, is expanded upon. In the context of existing research on Production System Design, an approach to the design of material and information flow in
manufacturing systems will be proposed. As part of this approach, requirements for the design of material flow systems and information flow systems are identified. It will be shown that the material and information flow in a manufacturing system must be
implemented as an integrated structure. To form the language of this discussion, a model of material and information flow in manufacturing systems will be shown. This model will serve as a tool to visualize flow in a system, as well as communicate the system design at the material and information flow view of the system. Addressing the material and information flow in the manufacturing system design is a critical part of the design process, in which the high-level objectives are translated to the low-level design requirements of the detailed subsystems.
2 Scope, Flow and Focus
Throughout the course of this thesis, some themes will frequently be used to explain the characteristics of production systems and production system design. In order to better understand the physical nature of manufacturing systems and the procedure of designing and implementing production systems, it will be helpful to create abstract notions of how the pieces of a system fit together.
2.1 Levels of scope
The first theme that is important in conceptualizing the design of production systems is the notion of levels of scope. Analogous to a birds-eye view of the physical system, the
level of scope defines the resolution of detail that we are considering at a point in time. At the very detailed, "microscopic" level of scope, the most intricate details of individual workstations are being considered; at this level of scope, the exact layout, timing and automation content of each machine becomes significant in designing equipment for the system. At a higher level of scope, for example, when analyzing entire distribution channels, simply modeling an entire plant as a single entity with attributes defining key variables may suffice. Various levels of scope that will be discussed here include, in order of most detail to most general, the operation level, the workloop level, the cell level, the linked-cell level, the plant level and the value stream level. In the following chapters, it will be shown that production system design involves the transition through all levels of scope, in consonance with the functional requirements and design parameters of each level.
2.2 Flow
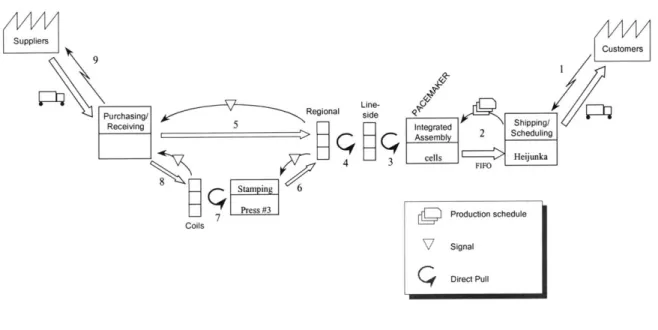
Visualizingflow in production systems is a critical aspect of production system design.
Of the two types of flow, material flow is usually the easiest to see by simply following
parts as they move through the system. In seeing material flow, it is important to notice discontinuities in the flow, because of buffers, queues, waiting times, mis-sequencing of
parts, parallel paths and reversed flow (e.g., parts that are moved backward or upstream in the plant for rework or repair).
Information flow may be harder to visualize than material flow. As material is flowing from the suppliers, through value-added processing and to the customers, information traverses through the system in the opposite direction, away from the customer and toward the suppliers. Whether or not the information is taking a clear and logical path through the system is another issue, but the information is moving opposite the material flow nonetheless. Information comes in different forms in different systems. Batch and queue manufacturing systems typically rely on forecast data and a central production scheduling department (sometimes using Material Requirements Planning (MRP) scheduling) to provide production information to the processes in the plant. In lean manufacturing systems, information is transferred to the process directly upstream, giving exact demand requirements in frequent time intervals. Material is exchanged for
information in the correct mix and volume, thus providing the customer process with reliable supply, just-in-time (JIT). This idea has been called a pull system and is also a critical aspect of TPS [Monden, 1990]. In watching the information flow from the customer to the supplier, it is important to notice at which point in the information stream the customer order integrity is lost. What types of delays and discontinuities are there in the information flow?
One of the caveats of the Toyota Production System is that the flow of material and information throughout the system is clearly visible, which helps in reducing the waste in the system.
2.3 Focus
The design of the production system across all levels of scope must remain focused. The design objectives must be based on the needs of the customer and the characteristics of the products, processes, industry and market of the production system. To understand the notion offocus, consider the task of adopting a manufacturing strategy. A subset of the
overall business strategy, the manufacturing strategy is the approach that the
manufacturing system takes to maximize business objectives and create a competitive advantage for the company. A typical manufacturing strategy will define what sort of focus the system must take to maximize customer and shareholder satisfaction and maximize profits with low risk. Manufacturing strategies can only be determined on a
case-by-case basis, since every decision involves weighing several environmental variables simultaneously. The following characteristics will play a role in determining the manufacturing strategy [Hayes, Wheelwright, 1984]:
1. Product characteristics (material cost, development burden, size, life-cycle
production volume and production volume flexibility)
2. Process characteristics (investment, capacity and capacity flexibility,
technology innovativeness, cycle time, changeover time, product flexibility, predictability in future process characteristics)
3. Customer characteristics (distribution requirements, demand average and
deviation, customization and product differentiation, method of information transfer from customers, quality requirements)
4. Market/Industry characteristics (market size, market share, life-cycle length, predictability in future market/industry characteristics)
Based on all of these characteristics (although some of them may be negligible compared to others), a proper focus strategy can be devised. Figure 2.1 shows the types of focus decisions that can be made based on characteristics of the system. In designing the
system, a set of attribute/decision factor combinations will be chosen as the focus. One combination will be the primary focus of the system, while some other combinations may have secondary influence.
Common strategy Possible situation Unlikely situation
Invalid attribute for this decision factor
Figure 2.1 Focus Decision Matrix
For example, a typical effective strategy in production system design is the customer-focused linked-cell system [Black, 1991]. The flow through these systems is designed based on customer demand volumes, maximizing customer satisfaction through superior
quality, response time and reliability. Another example of a production system design is the process technology focused design. These types of systems can be seen in innovative
industries with very short life-cycles in product and process technology, such as the semiconductor industry. Because of long development lead times and costs, the production systems are designed to accommodate process and product flexibility.
Designing production systems with focus gives companies a significant competitive advantage in the market [Lee, 1992]. As will be seen in the Production System Design and Implementation Path presented in chapter 4, the focus decision is one of the early steps in the production system design and implementation process, and all subsequent decisions are fully dependent on it. The focus decision will have a large impact on the
Decision Factor Individual Markets Idsr
Attribute C mers (Customer (Competi rs) Product Process
Groups)
Mean+
Demand Volume
Fixed (Overhead & Investment) Cost
Variable+ Life-cycle duration++++
Physical attributes (size, speed, location, resources)++++
Product differentiation & customnization++++
Quality (specification or output) + Reliability or predictability of any of these characteristics + + + + +
TO READ THIS CHART:
"The flow of the production system may need to be focused based on the <attrbute > of the <decision tactor>."
approach to designing the material and information flow in the production system. Without a clear definition of focus in the production system design, it will be ineffective, regardless of the level of effectiveness of individual components of the system.
3 Axiomatic Design
In chapter 1, it was shown why it is important to approach the design and implementation of production systems based on a standard methodology. When analyzing complex systems it becomes difficult to conceptualize the design without a tool to relate the physical properties of the system to the original design goals. "Design involves a continuous interplay between what we want to achieve and how we want to achieve it." [Suh, 1990] Developing a structure for discussing design goals and solutions is the first step in understanding manufacturing system design. The concepts presented here are a direct application of the work of Nam Suh, The Principles of Design [Suh, 1990].
Axiomatic design is a methodology that is used to translate the goals of a design to the physical implementation of the outcome. Formalizing the design process is an idea that stems from the fact that there exists a tangible notion of the "success" of a design and that there must be specific features of a good design that set it apart from a bad design. The simplest design that independently translates design objectives (defined by the customer) into physical components is the best design. The two important words here are
independent and simple; these two characteristics of a design will be defined by the two fundamental axioms of axiomatic design. The notion of "translating" objectives into
solutions is an iterative process of mapping and decomposing the design between different realms of definition, and will be discussed in further detail in the following
sections.
Following the process of axiomatic design helps to keep the only the most key features as the driving force of the design during the process, thus producing an effective solution that always performs as desired. In the complex production systems being discussed in this paper, the key to achieving success through axiomatic design is that all design and
engineering decisions, from the high-level conceptual design to the specific sub-system and component details all directly evolve from already known design requirements. Each decision on a design feature can be related to a functional goal of the design and every
mapping of design features to customer desires ensures a successful outcome from the customer's point of view.
Axiomatic design is ultimately flexible in how it can be used; it can be applied to any engineering problem. The methodology comes in two parts: it provides instruction for the designer to develop the design details from the design goals, and it defines two
guidelines to ensure that the design decisions being made are the best possible choices. Even with these guidelines, axiomatic design does not restrict us from applying the method to any type of problem. Applications of axiomatic design range from system-level design based on business objectives through detailed engineering design based on customer desires and market trends.
3.1 Design Domains
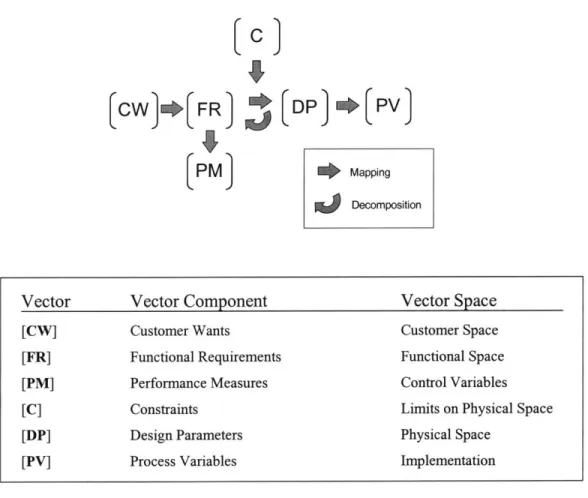
When considering a design, we usually visualize a physical entity that has been created. The design process that resulted in the creation of the product actually steps through 4 domains, which are shown in Figure 3.1.
CUSTOMER FUNCTIONAL PHYSICAL PROCESS
DOMAIN DOMAIN DOMAIN DOMAIN
CW FR DP $> PV
OBJECTIVES SOLUTIONS
("What To Do") ("How to do it")
Figure 3.1
CUSTOMER DOMAIN
The customer, or the user of the design, should specify what the product will look like. The goal of any design process is, of course, to satisfy the need of the customer. The first step of any design process is to identify the customer "wants." In a typical organization, the management staff along with the marketing team will usually perform this task. It is important to be very general in this task, and to create a set of independent customer requirements that are solution-neutral. In other words, the customer wants domain should not give any pre-conceived notion of a design solution.
The customer requirements can be arranged into a vector of independent statements that will sufficiently define the space of the customer's view of the design. For example, a customer requirements vector for the design of a water faucet is:
=CW1: Deliver water at a comfortable temperature
CW2: deliver water at a comfortable pressure
These two statements fully specify what it is about a water faucet that the user cares about. These statements are neither dependent on each other nor do they imply any design approach (they are solution-neutral).
FUNCTIONAL DOMAIN
A functional requirement is analogous to a customer want in that it helps us define what
the design must accomplish. A set of functional requirements, which are derived from the customer requirements space, will create a new space called thefunctional space. The functional space defines the desired output of the product completely and
specifically. It becomes the launching point for the conceptual design of the product. "Functional requirements are defined to be the minimum set of independent requirements that completely characterize the design objectives for a specific need. By definition, FRs are independent of other FRs and can be stated without considering other FRs." [Suh,
1990, chapter 2] However, a functional space is not necessarily unique over time, space
system change over time (decades, for instance) [Cochran, 1994], depending on the environment in which they exist (European systems vs. American systems vs. Japanese systems) and depending on the way they are perceived by the designers.
Using the example of the water faucet, the functional space may be defined by the following set of FRs:
= FR1: Deliver water in a temperature range of 50 'F -150 'F
FR2: Deliver water at a pressure range of 2psi 5psi
PHYSICAL DOMAIN
Design parameters are chosen to satisfy the functional requirements. The design is translated from the functional space into the physical space, and the physical characteristics of the design begin to be identified. It is through this mapping of
functional requirements to design parameters that the creative part of design takes place. Any given designer may select a different set of design parameters to define the physical space, so the design space is not unique. There can be an infinite number of plausible design solutions and mapping techniques. By applying the rules of axiomatic design, the best design solution can be chosen from the set of possible design solutions.
From the vector of function requirements for the design of the water faucet, we may derive a vector of design parameters such as:
[DPI ={DP 1: Volume flow rate of water from hot reservoir
DP2: Volume flow rate of water from cold reservoir
DP1 : Volume flow rate of water mix between hot and cold flows
DP2: Pressure of flow through faucet
Both of these physical domain representations were derived from the same set of functional requirements, and each set of design parameters could result in design
solutions that solve the customer wants [CW] . However, one of these two solutions is more ideal than the other, because each of its design parameters is independent of the other. In the section titled "Design Axioms" below, we will analyze these two designs and identify which of the two is a better solution.
PROCESS DOMAIN
Once the physical domain has been defined by the selection of design parameters (DPs), the conceptual idea of the product can be manifested into a physical object. This object or product can be produced and controlled by manipulating certain process variables. These process variables (PVs), or control variables are defined in the process domain, and are derived directly from the design parameters. The process variables are the levers
by which the design parameters are manipulated. The process domain, completely
defined by these process control variables, is what the production system designer (or operations manager) has freedom to control. Some process variables are built into the long-term control structure of the system and some can be manipulated via real-time control policy. Each design parameter should be able to be controlled by altering one and only one of the process variables, but this is often impossible in manufacturing systems because of coupling between the design parameters and process variables.
Figure 3.2 shows what the water faucet design looks like in the process domain, based on the 2 different design parameter vector spaces shown above. In design (a), the design parameters are hot water flow and cold water flow. The process variables in this design are hot water valve position (DPla) and cold water valve position (DP2a).
rpV1 ={PVl: Hot water valve position PV2: Cold water valve position
In design (b), the design parameters are hot/cold mixing level and water flow pressure control. The process variables in this design are mixing flow rate valve position (DP1b), and total flow valve position (DP2b).
PV: Mixing flow rate valve position PV2: Total flow valve position
HOT COLD PV1 PV2 DPI DP2 FRI Design (a) Pv1 DP1 PV2 DP2-Design (b) Figure 3.2
Alternative designs for a water faucet
3.2 Mapping and Decomposition
In the example of the water faucet, the design was translated between the four domains of axiomatic design. Customer requirements were translated to functional requirements. Through the creative design process, design parameters were chosen to satisfy these functional requirements. Finally, process variables were selected in order to control the state of the design parameters. In each of these steps, the design underwent a mapping from one domain to the next. The design is conceptualized in a different way in each domain, and the 3 mapping steps took the design through each conceptual phase.
In fact, the water faucet was a very simple application of the axiomatic design process. Once the customer needs and functional requirements were identified, design parameters were chosen. These design parameters were so simple that the design was able to be mapped directly into the process domain; no further detailed design was necessary to
In complex design problems, such as production system design, one iteration of these 3 mapping steps is not sufficient enough to provide a detailed explanation of the design. Once the primary customer requirements and functional requirements are chosen, and the design is mapped to the design parameters, the design may not be detailed enough to implement. In cases such as these, the design zig-zags between the functional and physical domains (FR
<-->
DP) several times, until the design is described with enough detail in the physical domain to be implemented. Mapping is half of this zig-zag process, as the functional requirements, which identify "what" the system design must accomplish are translated into design parameters, which identify "how" the system design will accomplish the "what" through creative selection. These design parameters can then be decomposed into lower-level functional requirements by asking "what" objectives need to be met in order to accomplish the "how" identified by the design parameters.Decomposing the DPs into lower-level FRs moves the design back into the functional domain, at a level of finer detail.
These two functions, mapping and decomposition will be discussed in further detail in the context of production system design in chapter 4. By iterating these two functions, the design is manifested in both the functional and physical domains, at all levels of detail. The result of this zig-zagging is a complete hierarchy of design objectives and solutions. From this conceptual design hierarchy, the physical system can be constructed and implemented.
3.3 Axioms
AXIOM 1: THE INDEPENDENCE AXIOM
Axiom 1 deals with the relationship between the functional and physical variables of a design. When mapping the functional domain ([FR]) to the physical domain ([DP]) , the choice of DPs must be such that a change in one DP affects one and only one FR.
AXIOM 2: THE INFORMATION AXIOM
As discussed above, the definition of the physical domain from the functional domain is not a unique process. Rather, it is a creative process, and therefore different designers will create different [DP] vectors. Axiom 2 deals with the selection of the most optimal
[DP] space. The best design will be a design that satisfies axiom 1 and has the least
information content. In design, the information content is the probability that the FR will be satisfied. In other words, if there is a high probability of success (robust products that
are easily calibrated to the target), the information content is low. Formally, axiom 2 states "Minimize the information content of the design." [Suh, 1990]
3.4 Design Matrix and Coupling
The functional space, physical space and process space are defined by the vectors [FR],
[DP] and [PV] respectively. Axiom 1 states that the relationship between the spaces
defined by [FR] and [DP] must be independent. If we create an equation showing the relationship between [FR] and [DP], there is an element called the design matrix [A] that qualifies the type of dependence.
[FR ]= [A ][DP
]
The matrix [A] will be an m x n matrix where m is the size of matrix [FR] and n is the size of vector [DP]. In a design that is not redundant, i.e., there is the same number of design parameters as functional requirements, the matrix [A] will be square.
The elements of the design matrix indicate a dependence relationship between FR and
DPj if Ai;= X. If Ai;= 0, then the corresponding FR - DP pair is independent. If by changing the state of a DP, the state of a FR is altered, then there is a dependence relationship and the corresponding design matrix element is X. 1
1 A special case of a design matrix is the non-linear case. Normally, the elements of the design matrix can
be modeled as constant relationships, i.e., across the entire range of [DP], the elements A1 indicate either
Just as there is a design matrix [A] relating [FR] and [DP], there is a design matrix [B] relating [DP] and [PV]. If the alteration of a process variable affects the state of a design parameter, then the corresponding element of [B] is X.
[DP ]= [B ][PV
The design matrices for water faucet design (a) are:
[FR] =
[
X][DPLIX X
[DP]a
= X 0][PV]The design matrices for water faucet design (b) are:
[FR] =
[
0][DPL [ b X[DPlb
= X 01p~ f 1 X COUPLED UNCOUPLED UNCOUPLED UNCOUPLEDAs defined by the independence axiom, design (b) is uncoupled between the functional and physical domains. The X's on the diagonal of the design matrix indicate that each design parameter affects one and only one FR, and equivalently, each FR is affected by one and only one DP. To arrive at a desired state of [FR]ideal, one can alter [DP] in a single iteration. Uncoupled designs are examples of acceptable designs, and the simplest design will be the most ideal (the one that also satisfies axiom 2).
Aij=f1 ([DP]).
So, the coupling of these designs can only be determined over discrete ranges of [DP]. If the design is coupled, varying [DP] may never lead to convergence on [FR]ideal.
Design (a) is fully coupled because alterations in a single DP affect the state of both FRs;
it is impossible to change the state of one FR without affecting the other FR. In order to
arrive at a desired state [FR]ideal, the operator must continually iterate on [DP] until the current state converges to the desired state. If the design is non-linear, the design may never converge. Water faucet (a) is a coupled design, because the user can not alter a single FR at one time. Whenever one design parameter is changed, both functional requirements change. We have all experienced this coupling between the process domain (faucet controls) and functional domain (water temperature & pressure) in the search for the perfect shower. If we want more water pressure (FR2), then we might turn up the cold water (PV2), increasing the flow of cold water (DP2). But now the temperature is too cold (FRI is no longer satisfied), so me must increase the hot water level (DPI). In doing so, we have overshot the desired level of water pressure (FR2). So, we must iterate several more times until we converge on a perfect water pressure and temperature. Five minutes later, when there is a lot less hot water in the reservoir, the entire iterative control process must be repeated.
Axiom 1 can be interpreted to mean that coupled designs are too complex and therefore undesirable. In Figure 3.3, the graphical representation of a coupled design shows what happens when coupled systems are controlled. When a single DP is altered by
controlling its associated PV, it is analogous to traveling along one of the DP axes in the design space. While moving along the DPI axis, both values of FRI and FR2 are changing. Similarly, in a fully coupled case, both values of FRI and FR2 change when moving along the DP2 axis. It is impossible to independently alter one FR.
The intermediate case between coupled and uncoupled is quasi-coupled (also known as decoupled and path-dependent). In a quasi-coupled design, the design matrix is:
[FR] O][]
Design Type
FR 1 is only affected by changes in DP 1, but FR2 is affected by changes in either DP 1 or DP2. In order to quickly arrive at the desired state of [FR]ideal, the designer can alter DP2 until FR2ideal is reached. This action will also affect the state of FRI. Then DP 1 will be altered until FRlideal is reached. As in the uncoupled case, the desired state of [FR] can be reached with a single iteration. However, there is a distinction in the order in which
the DPs should be altered. The DP with the most influence on [FR] should be altered first, followed by those DPs with lesser influence. Further discussion on this path-dependency problem in production system design can be found in [Carrus, Cochran,
1998]
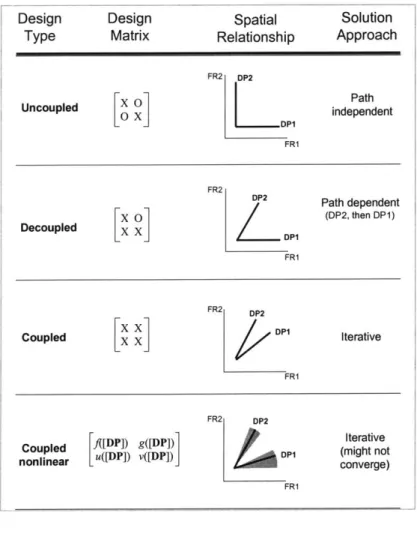
Figure 3.3 shows the key characteristics of each type of design relationship.
Spatial Solution Relationship Approach FR2 DP2 xL0
Path
Uncoupled 0 X independent FRI FR2 DP2 Path dependent x 01 (DP2, then DP1) Decoupled X FRI FR2 DP2Coupled DPI Iterative
FRI
FR2 DP2
Coupled ]([DP]) g([DP]) DI Iterative
nonlinear [ogo converge)
FRI
Figure 3.3
Characteristics of the types of relationships between design domains Design
IMPLEMENTATION OF DESIGNS
Any design problem can be thought of as progressing through the four domains of axiomatic design. The process of decomposing functional requirements and design parameters creates a top-down hierarchy of the design. Once the design has been
modeled in the physical domain to such a level of detail that it can be implemented in the process domain, the physical embodiment of the design is created. In the case of product design, this will mean manufacturing the product for distribution to the users. In the case
of production system design, this physical realization stage is commonly known as implementation of the system design.
There is a theorem that is derived from the independence axiom that discusses the
implementation of designs. A design can be implemented if the relationships between the functional, physical and process domains are all uncoupled. Theorem 9, on Design for Manufacturability states "For a product to be manufacturable, the design matrix for the product, [A] (which relates the [FR] vector for the product to the [DP] vector of the product) times the design matrix for the manufacturing process, [B] (which relates the
[DP] vector to the [PV] vector of the manufacturing process) must yield either a diagonal
or triangular matrix. Consequently, when any one of the design matrices, that is, either
[A] or [B], represents a coupled design, the product cannot be manufactured." [Suh, 1990, ch. 4.10]
The physical realization (implementation) of a design is a step in the design process that is characterized by matrix [C]. Matrix [C] defines the relationship between the process domain and the functional domain. If matrix [C] is uncoupled, then the design is said to befunctionally independent. The customer is able to optimize a particular functional requirement of the device by altering one and only one control variable.
[C
=[A ][B ]
In order to simplify the design, its components may be physically integrated.
"Integration of more than one function into a single part, as long as the functions remain independent, should reduce complexity." [Suh, 1990] In general, the most ideal design is one that is physically integrated and functionally independent. In production system design, most components are physically integrated structures; each implementable component (labor tasks, equipment, material/information flow loops, cells, SWIP) is a physical manifestation of several functional requirements.
3.5
Applying Axiomatic Design to Manufacturing Systems
In summary, this chapter has presented a structured approach to addressing design problems. Four design domains were identified. As the design is mapped and decomposed through each of these four domains, a complete hierarchy of the design objectives and solutions is created at all levels of detail. Once the finest level of detail is reached, the design can be implemented.
Chapter 4 will develop the model of the design process in further detail in the context of production system design. In this model, the entity being designed is a production system. The customer, i.e., the user of the production system in this case, is the business to which the production system belongs. This "business" customer is the element that defines the highest-level goals of the production system, i.e., the customer domain [CW] in the axiomatic design model. Examples of elements that together comprise the business customer are company owners and executives, shareholders and employees. Other factors that help determine the business customer might include such abstract entities such as the environment, societal ethics, the community, the government, the economy and the global village. In other words, all of these factors can have an effect on the goals or objectives of a production system, and thus are treated as customers in the axiomatic design model.
An analogy can be made between the disciplines of production system design and product design. The terminology of axiomatic design applies to both; the application of product design and production system design is compared in Figure 3.4 [adapted from
Cochran, 1994].
It is important to note here that the word customer will take on a different meaning later on in this thesis. When using the axiomatic design model, the customer is an aggregation of all factors that will determine the objectives of the system. On the other hand, other types of customers are those who consume the products manufactured by the production system, i.e., the value stream customer (or, supply chain customer). These customers are part of the production system; material and information flows to and from these
customers. These customers are analogous to suppliers; material flows from suppliers to customers.
Axiomatic Design Product Design Production System
Term Analogy Design Analogy
Business (internal) and
Customer End User Value Stream (external)
Customers
Product Product Production System
Customer Domain Customer Needs Strategy/ObjectivesManufacturing
Functional Domain FRs of product FRs of system
Physical Domain DPs of product DPs of system
Production System
Process Domain Product Settings Control Variables
Physical Realization Manufacturability System Implementation
Feedback Control Product Performance Criteria measurementsPerformance
Figure 3.4