HAL Id: inserm-00086147
https://www.hal.inserm.fr/inserm-00086147
Submitted on 4 Sep 2009
HAL is a multi-disciplinary open access archive for the deposit and dissemination of sci-entific research documents, whether they are pub-lished or not. The documents may come from teaching and research institutions in France or abroad, or from public or private research centers.
L’archive ouverte pluridisciplinaire HAL, est destinée au dépôt et à la diffusion de documents scientifiques de niveau recherche, publiés ou non, émanant des établissements d’enseignement et de recherche français ou étrangers, des laboratoires publics ou privés.
Ecological association between indoor radon
concentration and childhood leukaemia incidence in
France, 1990-1998.
Anne-Sophie Evrard, Denis Hémon, Solenne Billon, Dominique Laurier, Eric
Jougla, Margot Tirmarche, Jacqueline Clavel
To cite this version:
Anne-Sophie Evrard, Denis Hémon, Solenne Billon, Dominique Laurier, Eric Jougla, et al.. Ecological association between indoor radon concentration and childhood leukaemia incidence in France, 1990-1998.. European Journal of Cancer Prevention, Lippincott, Williams & Wilkins, 2005, 14 (2), pp.147-57. �10.1097/00008469-200504000-00011�. �inserm-00086147�
Ecological Association between Indoor Radon Concentration and
Childhood Leukaemia Incidence in France, 1990-1998
Evrard AS1, Hémon D1, Billon S2, Laurier D2, Jougla E3, Tirmarche M2, Clavel J1
1
Institut National de la Santé et de la Recherche Médicale, INSERM U170-IFR69, Villejuif, France
2
Institut de Radioprotection et de Sûreté Nucléaire, IRSN/DRPH/SRBE/LEPID, Fontenay-aux-Roses, France
3
Centre Epidémiologique sur les Causes Médicales de Décès, INSERM CépiDc-IFR69, Le Vésinet, France
Published in European Journal of Cancer Prevention 14: 147-157; 2005.
http://www.eurjcancerprev.com/
Correspondence to:
Jacqueline CLAVEL INSERM U170, 16, avenue Paul Vaillant-Couturier, F-94807 Villejuif cedex, France clavel@vjf.inserm.fr
This work was supported by grants from the Ministère de l’Environnement et de l’Aménagement du Territoire, INSERM, the Direction Générale de la Santé, the Fondation pour la Recherche Médicale, and the Fondation de France.
Abstract
Objective – Evaluating the ecological association between indoor radon concentration and
acute leukaemia incidence among children under 15 years of age in the 348 geographical units (zones d’emploi, ZE) of France between 1990 and 1998.
Methods – During that period, 4015 cases were registered by the French National Registry of
Childhood Leukaemia and Lymphoma. Exposure assessment was based on a campaign of 13240 measurements covering the whole country.
Results – The arithmetic mean radon concentration was 85 Bq/m3 (range: 15-387 Bq/m3) and
the geometric mean, 59 Bq/m3 (range: 13-228 Bq/m3). A positive ecological association, on the borderline of statistical significance (p = 0.053), was observed between indoor radon concentration and childhood leukaemia incidence. The association was highly significant for AML (p = 0.004) but not for ALL (p = 0.49). The Standardised Incidence Ratio (SIR) increased by 7%, 3% and 24% for all acute leukaemia, ALL and AML, respectively, when radon concentration increased by 100 Bq/m3.
Conclusion – The present ecological study supports the hypothesis of a moderate association
between indoor radon concentration and childhood acute myeloid leukaemia. It is consistent with most previous ecological studies. Since the association is moderate, this result does not appear inconsistent with the five published case-control studies, most of which found no significant association.
Introduction
The association between ionising radiation and leukaemia in humans has been clearly established for high-dose medical exposure (UNSCEAR, 1994), intrauterine exposure (Doll and Wakeford, 1997) and among survivors of the atomic bombs of Hiroshima and Nagasaki (Preston et al., 1994). In contrast, the risk associated with natural radiation exposure still needs to be documented.
Natural irradiation accounts for 58% of the French population’s exposure to ionising radiation (3 mSv on average: 34% due to radon, 11% due to telluric gamma rays, 7% due to cosmic gamma rays and 6% due to ingestion of water and food) (Sugier and Hubert, 2002). Radon is the second greatest source of exposure to ionising radiation, the greatest source being medical exposure. Most of the dose of radon and its decay products is delivered to the airways, mainly in the lungs. However, a fraction of the dose may be delivered to other organs, especially bone marrow. Depending on age and dosimetric model, the dose delivered to the bone marrow is estimated to range from 0.01 to 0.16 mSv per year for an average indoor radon concentration of 20 Bq/m3 (Khursheed, 1996 – Rommens et al., 2001). These estimated doses are roughly 100 times lower than those estimated for the lungs at the same level of radon exposure. Nevertheless, it cannot be ruled out that low dose of radiation increase the risk of leukaemia in humans.
Since the end of the 1980’s, ecological or case-control studies have investigated the association between childhood leukaemia incidence and indoor radon concentration (Laurier
et al., 2001). The studies addressed all forms of leukaemia, or acute lymphocytic leukaemia
(ALL), or acute myeloid leukaemia (AML).
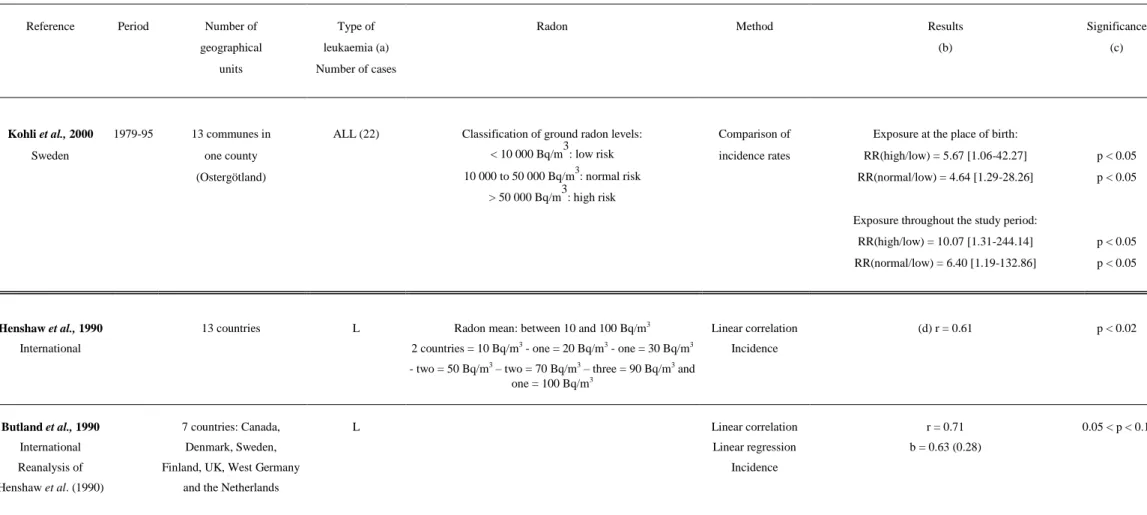
Some ecological studies (table 1) have evidenced positive associations between indoor radon concentration and all leukaemia (Henshaw et al., 1990 – Muirhead et al., 1991, 1992 –
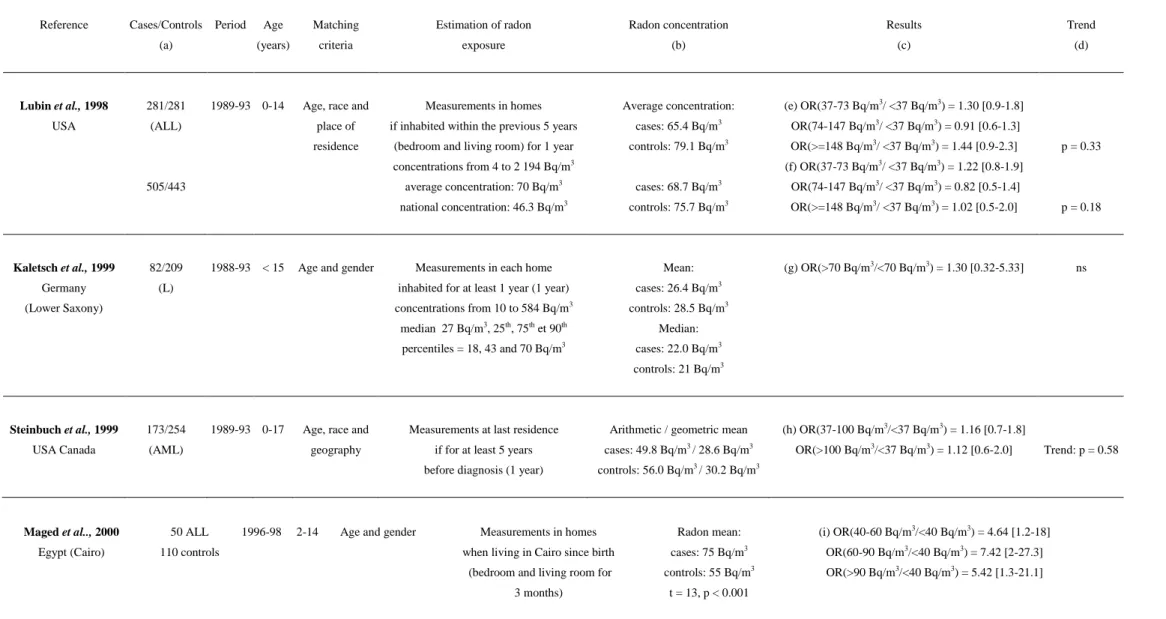
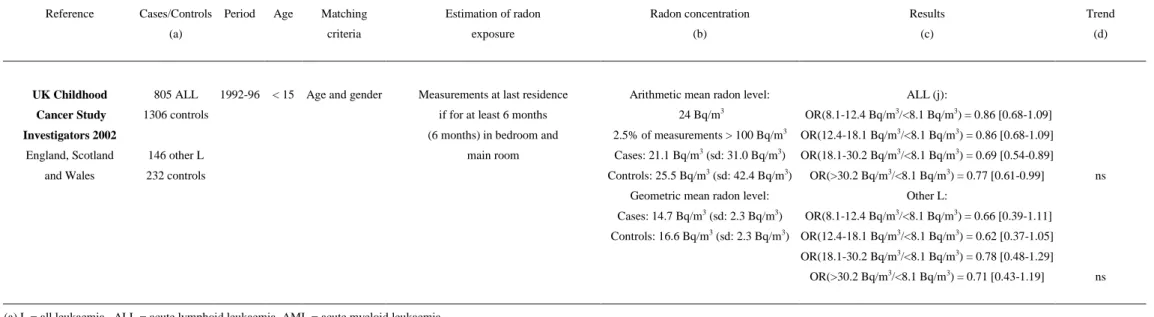
Richardson et al., 1995). The largest study pooled the data from 13 countries and detected a significant positive linear correlation of 0.61 (p < 0.02) between indoor radon concentration and leukaemia incidence (Henshaw et al., 1990). Lucie (1990) and Alexander et al. (1990) suggested a significant positive ecological association between childhood ALL incidence and indoor radon concentration in Great Britain. In contrast, Thorne et al. (1996) did not observe any significant positive association between childhood ALL incidence and indoor radon concentration in Great Britain, but suggested excess childhood AML for radon concentrations higher than 100 Bq/m3 (relative risk = 2.47, p = 0.02). It should be noted that six of the ecological studies are not independent of one another because there are many overlaps in geographic area and time period (Lucie, 1990 – Alexander et al., 1990 – Muirhead et al., 1992 – Richardson et al., 1995 – Foreman et al., 1994 – Thorne et al., 1996). The case-control studies with individual measurements yielded discordant results (table 2). Most of those studies did not show any significant association between indoor radon concentration and all childhood leukaemia, or ALL, or AML incidence (Lubin et al., 1998 – Kaletsch et al., 1999 – Steinbuch et al., 1999 – UK Childhood Cancer Study, 2002). Maged et al. (2000) were alone in reporting that the ALL cases in Cairo were exposed to a significantly higher (p < 0.001) average radon concentration than the controls. It should be noted, however, that this study only included 50 cases and 110 controls.
Other authors have studied the ecological association between radon and childhood leukaemia, but studied mortality rates (Gilman and Knox, 1998), and/or used other exposure metrics such as groundwater radon concentration (Collman et al., 1991), distance from an uranium processing plant (Hoffmann et al., 1993) and ground radon levels (Kohli et al., 2000). With the exception of Gilman and Knox, they all suggested a significant positive association between radon and leukaemia. The present study intentionally focuses on the incidence of childhood leukaemia instead of mortality because of the gap between leukaemia
incidence and leukaemia mortality. Leukaemia mortality has markedly decreased over the last ten years, thanks to improved therapies.
The United Nations Scientific Committee on the Effects of Atomic Radiation recently presented a review of the international data on indoor radon concentrations (UNSCEAR, 2000). Among the countries where an association between indoor radon concentration and childhood leukaemia incidence has been observed, indoor radon concentration generally shows marked variation. In Canada, Great Britain and the USA, indoor radon concentrations were moderate (geometric mean: 14, 15 and 25 Bq/m3, respectively). In the former West Germany, France and Sweden, radon levels were relatively high (geometric mean: 40, 41 and 56 Bq/m3, respectively). However, the geometric standard deviation of the radon measurements varied less between countries (from 2 to 3.6 Bq/m3) [Green et al., 1992 - UNSCEAR, 2000]. In each country, there were marked variations in concentration. For example, in Great Britain, even though the average radon level is relatively low, the counties of Devon and Cornwall have particularly high indoor radon concentrations (arithmetic mean: 68 and 170 Bq/m3, respectively). In 12% of the dwellings in those counties, radon concentrations were higher than 200 Bq/m3 [Thorne et al., 1996a]. The international study by Henshaw et al. (1990) pooled the data from 13 countries. The level in the country with the highest mean radon concentration was ten-fold higher than in the country with the lowest mean concentration.
Viel (1993) investigated the ecological association between adult leukaemia mortality between 1984 and 1986 and indoor radon concentration in 41 French administrative areas (“départements”) and he found a significant positive association between AML mortality and indoor radon concentration. The present paper is the first investigation for an ecological association between childhood leukaemia incidence and indoor radon concentration in France,
where average exposure is known to be relatively high and to exhibit marked between-region variations.
Subjects and methods
Cases
The study included all cases (4015) of acute leukaemia diagnosed between 1st January 1990 and 31st December 1998 in children less than 15 years old and living in mainland France at the time of diagnosis. The cases were provided by the French National Registry of Childhood Leukaemia and Lymphoma, which has registered all cases of childhood leukaemia since the 1st January 1990 (Clavel et al., 2004). The distribution of childhood acute leukaemia cases by age-group (0-4, 5-9 and 10-14), gender, period and type of acute leukaemia is given in table 3. The “all acute leukaemia” category was divided into 3 types: ALL, AML and not specified acute leukaemia. The analyses were only undertaken for ALL, AML and all acute leukaemia. Among all acute leukaemia cases, there were more boys (57%) than girls (43%), especially because of ALL. Eighty-one percent of all acute leukaemia cases were ALL and 17% were AML.
Demographic data
Age- and gender-specific population counts by “commune” (the smallest French administrative division), were derived from the national censuses of March 1990 and March 1999 provided by the National Institute for Statistics and Economic Studies (INSEE). For each “commune” and for each year from 1990 to 1998, the annual number of births by gender (INSEE) and the annual age- and gender-specific number of deaths (Cépi-Dc, INSERM) were used to obtain age- and gender-specific population estimates for 1991 to 1998, for each “zone
linear diagonal interpolation method developed by Benhamou and Laplanche (1991) and by Pottier (1992). Each of the individual age cohorts was followed up to 1999, from the 1990 census or from birth, by ageing one year at a time and subtracting the number of deaths which occurred in the given age cohort during that year. In order to construct the final age- and gender-specific population estimates, the difference between 1999 population estimates and the actual 1999 census population was then distributed between 1990 and 1999, assuming a log-linear model. The population at risk for a given year and a given ZE were subsequently calculated using these estimates. National age- and gender-specific incidence rates for childhood leukaemia in France (1990-1998), based on the National Registry data, were used as reference rates to derive annual expected numbers of cases for each age group and ZE under study.
Geographical units
Mainland France is divided into 22 “régions”, 95 “départements” (Corsica is considered as a single “département”) and 348 “zones d’emploi” (ZEs). Most of the statistical analyses were carried out using ZE as the geographical unit. ZEs are geographical areas defined in terms of employment criteria: most inhabitants of a ZE find work in the same ZE and most ZE firms recruit their employees in the ZE. Migrations, main economic activity, and average distance to facilities are also taken into account in the definition. ZE population varied from 9,300 to 2,126,000. The statistical distribution of ZE population is highly dissymmetrical with a first quartile of 60,000, a median of 95,000 and a third quartile of 177,000.
Exposure assessment
A French national radon measurement campaign was carried out by the IRSN (Institute for Radioprotection and Nuclear Safety), in collaboration with the Ministry of Health. The main objectives were to identify radon-prone areas in France, to estimate the percentage of private
dwellings above action levels and to investigate factors affecting radon concentrations (Pirard
et al., 1998 – Gambard et al., 2000). Beginning in 1982, indoor radon activity per cubic meter
was determined in the main room, over two months, using a Kodalpha LR115 passive track-etch detector. The technique used was based on nuclear track detectors, in particular the LR115 cellulose nitrate film produced by Kodak-Dosirad (France). Only one measurement per household was performed, except if the result of the first measurement was below 5 Bq/m3 or over 400 Bq/m3. In that case, a second measurement was made to confirm that low or high values existed in the room. A questionnaire designed to identify housing and lifestyle characteristics that may have influenced radon concentration was associated with each measurement. The data used in this study are those published elsewhere (Pirard et al., 1998 – Gambard et al., 2000), together with some recent data collected until March 2002 (Billon et
al., 2004). The measurement campaigns consisted of 13240 measurements, with an average
distribution of 602 measurements per “région”, 138 per “département” and 39 per ZE. For 343 ZEs out of 348, the number of measurements, their arithmetic mean and standard deviation, and their geometric mean and standard deviation were available. It should be noted that, as is the case in most ecological studies, indoor radon concentration was measured over a period of several years and was then implicitly assumed to be stable over time. This hypothesis is plausible, except in the event of an abrupt change in housing characteristics or lifestyle. However, some authors have reported that indoor radon concentration changes over time in Sweden (Hubbard and Swedjemark, 1993). Such studies have yet to be conducted in French houses.
Statistical analysis
The variability of indoor radon concentration within the areas under study was analysed using the decimal logarithm of the geometric means of radon measurements, since the distribution
of radon concentration was log-normal. However, the arithmetic means were chosen to describe the ecological association between indoor radon concentration and childhood leukaemia incidence in order to enable comparisons with most published studies.
The global variance of indoor radon concentration (σ2X , X = log10(Rn)) was partitioned into a
variance within each area under study (σ2W ) and a variance between areas (σ 2
B), using the
classical method described by Armitage and Berry (1987).
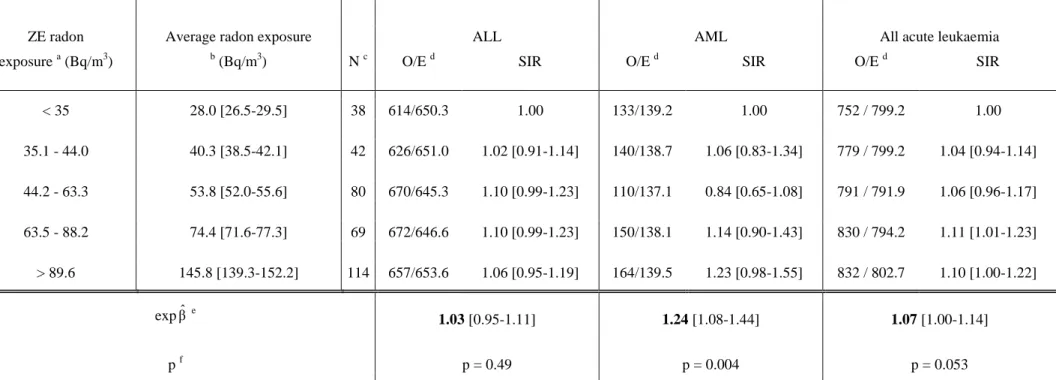
Radon exposure in each ZE was transformed into a five-category qualitative variable. Each category included approximately a quintile of the expected number of cases, with arithmetic means of 28.0, 40.3, 53.8, 74.4 and 145.8 Bq/m3, respectively. The arithmetic mean radon concentration was also considered as a quantitative variable.
The ecological association between radon concentration and leukaemia was first studied for all cases (0-14 years) and for the complete period (1990-1998), and then, separately, by age group (0-4, 5-9 and 10-14 years), gender, period (1990-1994, 1995-1998), leukaemia type (ALL, AML), and without the cases with Down's syndrome. Since infant cases are aetiologically distinct, analyses were also restricted to the 1-14 and 1-4 age groups. Analyses were also performed excluding the outlying ZEs where the exposure was less precise or the population less stable, in order to evaluate the stability of the results.
The socio-demographic and socio-economic characteristics recorded in the 1990 and 1999 French censuses (INSEE) were used as covariates by ZE: average net income, proportion of farmers, tradesmen, workers, managers, employees, and professionals, proportion of university graduates and proportion of the inhabitants living in rural areas.
Analyses were conducted using Poisson regression, including socio-demographic ecological covariates. Poisson regressions were performed using the generalised linear models computed
by the SAS® GENMOD procedure. Over-dispersion was systematically estimated using deviance tests and Pearson’s chi-square tests. The over-dispersion of leukaemia cases was also tested by Potthoff-Whittinghill and Fisher’s chi-square tests. To determine the degree of significance of the tests, the statistical distributions of the Potthoff-Whittinghill and Fisher’s chi-square results were simulated using Splus® software, with the hypothesis of non-heterogeneity of the standardised incidence ratios (SIR) in the geographical units, by a multinomial distribution proportional to the expected numbers of leukaemia cases. The absence of spatial autocorrelation of the SIRs was tested using Moran’s test and the statistical distribution of the Moran’s test results was also simulated under the null hypothesis of non-heterogeneity of the SIRs.
Results
The arithmetic mean of the 13240 indoor radon concentration measurements in France was 85 Bq/m3 and their geometric mean was 59 Bq/m3. Indoor radon concentration varied widely between geographical units, with the highest concentrations in areas with granitic soil (Brittany, Massif Central, Vosges and Corsica). Table 4 shows the main characteristics of the statistical distribution of radon concentration in the ZEs. The geometric mean radon concentration varied significantly between ZEs from 13 to 228 Bq/m3 (p < 10-6). Twenty-seven percent of the global variability of radon concentration (s2X 0.167 ) was due to between-ZE variability (s2B 0.045 ) and the remaining 73% to within-ZE variability (s2W 0.122 ).
The heterogeneity of SIRs was statistically significant between “régions” (p = 0.03), on the borderline of significance between “départements” (p = 0.06), and non-significant between
ZEs (p = 0.24). The SIRs differed significantly from unity for 4 “régions” out of 22, 6 “départements” out of 95 and 12 ZEs out of 343.
Table 5 shows the SIRs for ALL, AML and all acute leukaemia, as a function of the five classes of radon exposure. A positive ecological association, on the borderline of statistical significance (p = 0.053), between indoor radon concentration and childhood acute leukaemia incidence was observed. The association was highly significant for AML (p = 0.004) but not for ALL (p = 0.49). The SIRs increased by 7%, 3% and 24% for all acute leukaemia, ALL and AML, respectively, for a 100-Bq/m3 increase in radon concentration. Similar slopes were observed using the three geographical scales: ZE, “département” and “région” (data not shown). The results were stable over age, gender and period for all acute leukaemia and ALL, but the association with AML seemed restricted to cases aged less than 10 years and the relationship was non significantly higher for the period 1995-1998 than for the period 1990-1994 (table 6). When analyses were restricted to the 1-14 and 1-4 age groups, the results were unchanged. Neither exclusion of the cases with Down's syndrome (100 cases) nor exclusion of the outlying ZEs altered the results (data not shown).
All the ecological covariates under study were negatively and significantly correlated with radon concentration, except the proportion of people living in rural areas, which was positively correlated with radon concentration. None of the covariates was significantly associated with childhood acute leukaemia, or ALL, or AML. The positive association between radon concentration and AML at the ZE scale remained significant (p = 0.003) when the covariates were included in the Poisson regression model, and the strength of the association was unchanged (table 6). Conversely, the association between radon and all acute leukaemia became non-significant.
Deviance tests and Pearson’s chi-square tests did not reveal any significant evidence of over-dispersion. The Potthoff-Whittinghill statistic and Fisher’s chi-square did not show any evidence of over-dispersion between the ZEs (p = 0.38) or between the “départements” (p = 0.31). Using Moran’s statistic, no spatial autocorrelation of the SIRs was observed for the ZEs (p = 0.90) or “départements” (p = 0.89).
Discussion
The present study is the first ecological study to investigate a relationship between childhood leukaemia incidence in France and natural exposure to radon. During the period 1990-1998, 4015 cases of childhood acute leukaemia were diagnosed and registered in France by the French National Registry of Childhood Leukaemia and Lymphoma. The average indoor radon concentration in France was relatively high, with a geometric mean of 59 Bq/m3, in comparison to other studies having focused on the same topic. Exposure varied widely between ZEs (from 13 to 228 Bq/m3).
A positive ecological association, close to statistical significance, was observed between radon concentration and childhood acute leukaemia incidence. The association was highly significant for AML but not for ALL. The SIR increases per 100 Bq/m3 were 7%, 3% and 24% for all acute leukaemia, ALL and AML, respectively. The existence of a significant positive association for AML but not for ALL is unlikely to be due to the inaccuracy of the diagnoses, which were documented by cytology. The association with AML seemed restricted to cases aged less than 10 years, whereas the difference between the two periods (1990-1994 and 1995-1998) was non-significant.
So far, only a few risk factors for childhood leukaemia have been identified: high doses of radiation, some cancer therapies and some genetic syndromes. Those factors are unlikely to
risk factors for acute leukaemia (Kinlen’s hypothesis), but no viral infection measurements or surrogates for such exposures were available for the present study. Other risk factors such as proximity to busy streets and extremely low frequency magnetic fields, evaluated as possibly
carcinogenic to humans (Group 2B) [IARC, 2002], have not been investigated in the present
study. However, these exposures are unlikely to parallel exposure to radon. Some socio-economic factors were taken into account in the present analysis without introducing any change in the positive ecological association between indoor radon concentration and leukaemia.
The ecological association between average exposure and the average incidence of a disease may be different from the individual relationship (Elliott et al., 2000). This issue has been particularly discussed in settings where there is a powerful individual risk factor for a disease, such as smoking for lung cancer (Lubin, 1998 – Lagarde and Pershagen, 1999 – Darby et al., 2001). No such powerful risk factor has yet been identified for childhood leukaemia. In addition, when the individual dose-risk relationship is curvilinear, a discrepancy between individual and ecological studies may occur, due to individual variability of exposure within an area. However, any such discrepancy is not expected to have a major effect in the present study, because the dose-risk relationship is expected to be nearly linear for low-dose exposures. Finally, the possibility that the association could be due to some unknown confounding factors with geographical distributions similar to that of radon concentration cannot be excluded.
The positive ecological association in the present study was consistent with the findings of most of the ecological studies on childhood leukaemia. The average national radon concentration was 85 Bq/m3 and the excess relative risk 7% per 100 Bq/m3. Thus 5.4% (95%CI = [0.008% - 11.3%]) of childhood leukaemia would be due to radon if the association
were really causal and totally explained by the ecological association between radon concentration and leukaemia. This estimate is lower than the attributable risk found by Henshaw et al. (1990). According to those authors, 5% of childhood leukaemia may be due to radon, but the average exposure was 20 Bq/m3 (national arithmetic mean for Great Britain). On the basis of the results of the present study, the value of the attributable risk for 20 Bq/m3 would be 1.3%. However, a reanalysis of Henshaw’s data, restricted to the most reliable data, by Butland et al. (1990), showed that only 0.5 to 1% of childhood leukaemia may be due to radon at the same 20 Bq/m3 exposure level. Butland’s estimate is in agreement with that made in the present study.
Most of the case-control studies have not shown any significant association between indoor radon concentration and childhood leukaemia incidence (Lubin et al., 1998 – Kaletsch et al., 1999 – Steinbuch et al., 1999 – UK Childhood Cancer Study, 2002). On the basis of the present study, if the relationship between indoor radon concentration and leukaemia were causal, it would be restricted to AML and it would only explain 5.4% of all childhood acute leukaemia in France. Such an association would be very difficult to evidence using case-control studies.
In conclusion, the present study supports the hypothesis that natural exposure to radon may slightly increase the risk of childhood acute leukaemia. The results are consistent with most ecological studies. The association was mainly observed for AML, for children aged less than 10 years.
Acknowledgements
The authors are grateful to G. Desplanques (National Institute for Statistics and Economic Studies, INSEE) for population data provided as part of the INSEE-INSERM agreement, S. Caër, A. Goubin and M. White-Koning for technical assistance, A. Mullarky for his skilful revision of the manuscript.
References
Alexander FE, McKinney PA, Cartwright RA (1990). Radon and leukaemia. Lancet 335: 1336-1337
Armitage P, Berry G (1987). Components of variance. In Statistical Methods in Medical
Research, pp. 196-200. Blackwell Scientific Publications
Benhamou E, Laplanche A (1991). Estimation de la population à risque entre deux recensements pour le calcul d'un taux d'incidence ou de mortalité par cancer: comparaison de quatre méthodes. Rev Epidémiol Santé Publique 39: 71-77
Billon S, Morin A, Caër S, Baysson H, Gambard JP, Rannou A, Tirmarche M, Laurier D (2004). Evaluation de l'exposition de la population française à la radioactivité naturelle.
Radioprotection 39 (2). In Press.
Butland BK, Muirhead CR, Draper GJ (1990). Radon and leukaemia. Lancet 335: 1338-1339
Clavel J, Goubin A, Auclerc MF, Auvrignon A, Waterkeyn C, Patte C, Baruchel A, Leverger G, Nelken B, Philippe N, Sommelet D, Vilmer E, Bellec S, Perrillat-Menegaux F, Hémon D (2004). Incidence of childhood leukemia and non-Hodgkin’s lymphoma in France – National Registry of Childhood Leukemia and Lymphoma, 1990-1999. Eur J Cancer Prev 13 (2): 97-103
Collman GW, Loomis DP, Sandler DP (1991). Childhood cancer mortality and radon concentration in drinking water in North Carolina. Br J Cancer 63: 626-629
Darby S, Harz D, Doll R (2001). A parallel analysis of individual and ecological data on residential radon and lung cancer in south-west England. J R Statist Soc A 164, Part 1 : 193-203
Doll R, Wakeford R (1997). Risk of childhood cancer from fetal irradiation. Br J Radiol 70: 130-139
Elliott P, Wakefield J, Best N, Briggs D (2000). Spatial Epidemiology, Methods and
Applications. Oxford University Press
Foreman NK, Thorne R, Berry PJ, Oakhill A, Mott MG (1994). Childhood Malignancies in the South-West Region of England, 1976-1985. Med Ped Oncol 23: 14-19
Gambard JP, Mitton N, Pirard P (2000). Campagne nationale de mesure de l'exposition domestique au radon IPSN-DGS. Bilan et représentation cartographique des mesures au 01 Janvier 2000. Institut de Protection et de Sûreté Nucléaire, http://www.irsn.fr
Gilman EA, Knox EG (1998). Geographical distribution of birth places of children with cancer in the UK. Br J Cancer 77: 842-849
Green BMR, Lomas PR, O’Riordan MC (1992). Radon in dwellings in England. National
Radiological Protection Board NRPB-R254. London, HMSO
Henshaw DL, Eatough JP, Richardson RB (1990). Radon as a causative factor in induction of myeloid leukemia and other cancers. Lancet 335: 1008-1012
Hoffman W, Kranefeld, Schmitz-Feuerhake I (1993). Radium-226-contaminated drinking water: hypothesis on an exposure pathway in a population with elevated childhood leukemia.
Hubbard LM and Swedjemark GA (1993). Challenges in comparing radon data sets from the same Swedish houses: 1955-1990. Indoor Air 3: 361-368
International Agency for Research on Cancer (2002). Monographs on the evaluation of carcinogenic risks to humans: Non-ionising radiation, Part 1: Static and Extremely Low Frequency Electric and Magnetic Fields. Lyon: International Agency for Research on Cancer
Kaletsch U, Kaatsch P, Meinert R, Schüz J, Czarwinski R, Michaelis J (1999). Childhood cancer and residential radon exposure – results of a population-based case-control study in Lower Saxony (Germany). Radiat Environ Biophys 38: 211-215
Khursheed A (1996). Doses from radon to tissues other than lung. Radiol Prot Bull 181: 33-35
Kohli S, Noorlind Brage H, Löfman O (2000). Childhood Leukaemia in areas with different radon levels: a spatial and temporal analysis using GIS. J Epidemiol Community Health 54: 822-826
Lagarde F, Pershagen G (1999). Parallel analyses of individual and ecologic data on residential radon, cofactors, and lung cancer in Sweden. Am J Epidemiol 149: 268-274
Laurier D, Valenty M, Tirmarche M (2001). Radon exposure and the risk of leukemia: a review of epidemiological studies. Health Phys 81(3): 272-288
Lubin JH (1998). On the discrepancy between epidemiologic studies in individuals of lung cancer and residential radon and Cohen’s ecologic regression. Health Phys 75(1): 4-10
Lubin JH, Linet MS, Boice JD, Buckley J, Conrath SM, Hatch EE, Kleinerman RA, Tarone RE, Wacholder S, Robison LL (1998). Case-control study of childhood acute lymphoblastic leukemia and residential radon exposure. J Natl Cancer Inst 90: 294-300
Lucie NP (1990). Radon and acute lymphoblastic leukaemia. Leukaemia and lymphoma 1: 213-216
Maged AF, Mokhtar GM, El-Tobgui MM, Gabbr AA, Attia NI, Abu Shaby MM (2000). Domestic Radon Concentration and Childhood Cancer Study in Cairo, Egypt. Environ
Carcino & Ecotox Revs C18(2): 153-170
Muirhead CR, Butland BK, Green BM, Draper GJ (1991). Childhood leukaemia and natural radiation. Lancet 337: 503-504
Muirhead CR, Butland BK, Green BM, Draper GJ (1992). An analysis of childhood leukaemia and natural radiation in Britain. Radiat Prot Dosim 45: 657-660
Pirard P, Robé MC, Roy M (1998). Expositions par inhalation du radon atmosphérique. In Le
radon de l'environnement à l'homme pp. 83-106. Institut de Protection et de Sûreté Nucléaire,
Métivier H et Robé MC, EDP Sciences, Paris
Pottier D (1992). Population at risk. In Cancer Incidence in Five Continents, Vol VI, pp. 174-177. IARC Scientific Publications No.120. IARC, Lyon
Preston DL, Kusumi S, Tomonaga M, Izumi S, Ron E, Kuramoto A, Kamada N, Dohy H, Matsuo T, Matsui T (1994). Cancer incidence in atomic bomb survivors. Part III. Leukemia, lymphoma and multiple myeloma, 1950-1987. Radiat Res 137: S68-97
Richardson S, Montfort C, Green M, Draper G, Muirhead C (1995). Spatial Variation of Natural Radiation and Childhood Leukemia Incidence in Great Britain. Stat Med 14: 2487-2501
Rommens C, Ringeard C, Hubert P (2001). Exposure of red bone marrow to ionising radiation from natural and medical sources in France. J Radiol Prot 21: 209-219
Steinbuch M, Weinberg CR, Buckley JD, Robison LL, Sandler DP (1999). Indoor residential radon exposure and risk of childhood acute myeloid leukaemia. Br J Cancer 81: 900-906
Sugier A, Hubert P (2002). Dans le domaine des rayonnements ionisants, les données dosimétriques existantes sont-elles suffisantes? Rev Epidémiol Santé Publique 50, 13-26
Thorne R, Foreman NK, Mott MG (1996a). Radon in Devon and Cornwall and paediatric malignancies. Eur J Cancer 32A: 282-285
Thorne R, Foreman NK, Mott MG (1996b). Radon exposure and incidence of paediatric malignancies. Eur J Cancer 32A, No. 13, 2371-2372
UK Childhood Cancer Study Investigators (2002). The United Kingdom Childhood Cancer Study of exposure to domestic sources of ionising radiation: 1: radon gas. Br J Cancer 86: 1721-1726
UNSCEAR (1994). Epidemiological studies of radiation carcinogenesis. In UNSCEAR: Sources and effects of ionising radiation, Annex A, pp. 11.New-York: United Nations
UNSCEAR (2000). Exposure from natural radiation sources. In UNSCEAR: Sources and effects of ionising radiation, Annex B, pp. 133. New-York: United Nations
Viel JF (1993). Radon Exposure and Leukaemia in Adulthood. Int J Epidemiology Vol.22, No. 4: 627-630
Table 1: Association between indoor radon concentration and childhood leukaemia: ecological studies
Reference Period Geographical Type of Radon Method Results Statistical
units leukaemia (a) (b) significance
(number of cases) (c)
Lucie 1990 1984-86 22 counties ALL (187) Mean in UK: 22.3 Bq/m3 Linear correlation (d) r = 0.56 p < 0.01
England and Wales 18 counties between 10 Bq/m3 and 40 Bq/m3- Incidence
one = 60 Bq/m3 - one = 70 Bq/m3 – one = 110 Bq/m3 (e) r = 0.57 p < 0.01
and one = 120 Bq/m3
Alexander et al., 1990 1984-88 22 counties ALL (438) Spearman’s rank (e) = 0.65 p < 0.005
England and Wales correlation coefficient
Incidence
Muirhead et al., 1992 1969-83 459 districts L and non-Hodgkin Poisson regression (f) between districts: b = 3.85 (5.97) ns
England, Scotland 22 counties lymphomas Incidence (f) between counties: b = 18.9 (10.4) 0.05 < p < 0.1
and Wales (f) between districts within counties: b = -9.61 (8.13) ns
Richardson et al., 1995 1969-83 459 districts 6 691 L with Poisson regression 1974-78: LL: Significant positive association which p < 0.05
England, Scotland 80.2% of LL Incidence became ns when using a hierarchical Bayesian model ns
and Wales and 16.5% ANLL No evidence of an association between L or ANLL
and radon ns
Foreman et al., 1994 1976-85 2 groups L (245) Cornwall and Devon: highest radon Comparison of IR (Cornwall + Devon) = 41.1 [33.8-49.7]
South-West of the (2 counties per exposure incidence rates
United Kingdom group: IR (Avon + Gloucestershire)=47.4 [39.7-56.1]
Cornwall + Devon and Avon and Gloucestershire: very low radon level
Gloucestershire+ -> RR = 0.88 p = 0.30
Avon)
Table 1 - Continued
Reference Period Number of Type of Radon Method Results Significance
geographical leukaemia (a) (b) (c)
units Number of cases
Thorne et al., 1996a 1976-85 283 postcodes 108 L with Radon mean in the group: Comparison of L: RR(>=100 Bq/m3/<100 Bq/m3) = 0.90 p = 0.60 England and Wales into 2 groups: 10 AML (>=100 Bq/m3): 183 Bq/m3 incidence rates ALL: RR(>=100 Bq/m3/<100 Bq/m3) = 0.79 p = 0.28 (Devon and Cornwall) 113 (>=100 Bq/m3) with 98 ALL (<100 Bq/m3): 57 Bq/m3 AML: RR(>=100 Bq/m3/<100 Bq/m3) = 2.79 p = 0.11
170 (<100 Bq/m3)
Thorne et al., 1996b 1986-95 1986-95, AML: RR(>=100 Bq/m3/<100 Bq/m3) = 2.31 p = 0.08
1976-95 1976-95, AML: RR(>=100 Bq/m3/<100 Bq/m3) = 2.47 p = 0.02
Gilman et Knox, 1998 1953-80 893 demographic L and lymphoma Median radon level: 21 Bq/m3 Poisson regression Rate ratio shows cumulative mortality for twice the ns England, Scotland districts (10-km (less than 4851) 5% of demographic districts had radon Mortality mean value compared with the cumulative mortality
and Wales grid squares) ages: <15 levels at or above 63 Bq/m3 for the mean value (27.01 Bq/m3): 1.06 [0.99-1.12]
Collman et al., 1991 1950-79 100 counties 1 194 L (234 in Geometric mean groundwater radon Comparison of RR(229-1375 pCi/l / 0-228 pCi/l) = 1.26 [1.08-1.47] p < 0.05
USA (North Carolina) the low group, 585 concentration mortality rates RR(1376-10692 pCi/l / 0-228 pCi/l) = 1.33 [1.13-1.57] p < 0.05
in the medium one 3 radon-groups: 0-228 pCi/l, and 375 in the 229-1375 pCi/l and 1376-10692 pCi/l
high one) (g)
ages: <15
Hoffmann et al., 1993 1970-89 Circular areas with radii L (31) Comparison of 0-5 km: SIR = 2.82 p = 0.034
Germany of 5, 10, 15 and 20 km around 0-5: 5; 5-10: 4 incidence rates 5-10 km: SIR = 1.10 p = 0.49
(Rheinland-Pfalz) an uranium processing plant 10-15: 8; 15-20: 14 10-15 km: SIR = 1.16 p = 0.39
ages: <15 15-20 km: SIR = 0.92 p = 0.65
2 villages L (4) 360 mBq/l et 75 mBq/l of 226Ra in drinking water
Excess cases: 57% of cases of the inner zone (0-5) 23 % of population in the inner zone
Table 1 - Continued
Reference Period Number of Type of Radon Method Results Significance
geographical leukaemia (a) (b) (c)
units Number of cases
Kohli et al., 2000 1979-95 13 communes in ALL (22) Classification of ground radon levels: Comparison of Exposure at the place of birth:
Sweden one county < 10 000 Bq/m3: low risk incidence rates RR(high/low) = 5.67 [1.06-42.27] p < 0.05
(Ostergötland) 10 000 to 50 000 Bq/m3: normal risk RR(normal/low) = 4.64 [1.29-28.26] p < 0.05
> 50 000 Bq/m3: high risk
Exposure throughout the study period:
RR(high/low) = 10.07 [1.31-244.14] p < 0.05 RR(normal/low) = 6.40 [1.19-132.86] p < 0.05
Henshaw et al., 1990 13 countries L Radon mean: between 10 and 100 Bq/m3 Linear correlation (d) r = 0.61 p < 0.02
International 2 countries = 10 Bq/m3 - one = 20 Bq/m3 - one = 30 Bq/m3 Incidence
- two = 50 Bq/m3 – two = 70 Bq/m3 – three = 90 Bq/m3 and one = 100 Bq/m3
Butland et al., 1990 7 countries: Canada, L Linear correlation r = 0.71 0.05 < p < 0.1
International Denmark, Sweden, Linear regression b = 0.63 (0.28)
Reanalysis of Finland, UK, West Germany Incidence
Henshaw et al. (1990) and the Netherlands
(a) L = all leukaemia, LL = lymphoid leukaemia, ANLL = acute non-lymphoid leukaemia, ALL = acute lymphoid leukaemia, AML = acute myeloid leukaemia
(b) r = correlation coefficient, b = regression slope, ( ) = standard deviation of b, = Spearman’s rank correlation coefficient, RR = relative risk (high/low group), IR = Incidence ratio, SIR = Standardized Incidence Ratio (c) ns = non significant (p>0.05)
(d) Correlation with the arithmetic mean of radon measurements (e) Correlation with the geometric mean of radon measurements (f) Regression coefficient – annual number of cases per 108 per (Bq/m3) (g) 1 pCi/l = 37 Bq/m3
Table 2: Association between indoor radon concentration and childhood leukaemia incidence: case-control studies
Reference Cases/Controls Period Age Matching Estimation of radon Radon concentration Results Trend
(a) (years) criteria exposure (b) (c) (d)
Lubin et al., 1998 281/281 1989-93 0-14 Age, race and Measurements in homes Average concentration: (e) OR(37-73 Bq/m3/ <37 Bq/m3) = 1.30 [0.9-1.8] USA (ALL) place of if inhabited within the previous 5 years cases: 65.4 Bq/m3 OR(74-147 Bq/m3/ <37 Bq/m3) = 0.91 [0.6-1.3]
residence (bedroom and living room) for 1 year controls: 79.1 Bq/m3 OR(>=148 Bq/m3/ <37 Bq/m3) = 1.44 [0.9-2.3] p = 0.33 concentrations from 4 to 2 194 Bq/m3 (f) OR(37-73 Bq/m3/ <37 Bq/m3) = 1.22 [0.8-1.9]
505/443 average concentration: 70 Bq/m3 cases: 68.7 Bq/m3 OR(74-147 Bq/m3/ <37 Bq/m3) = 0.82 [0.5-1.4]
national concentration: 46.3 Bq/m3 controls: 75.7 Bq/m3 OR(>=148 Bq/m3/ <37 Bq/m3) = 1.02 [0.5-2.0] p = 0.18
Kaletsch et al., 1999 82/209 1988-93 < 15 Age and gender Measurements in each home Mean: (g) OR(>70 Bq/m3/<70 Bq/m3) = 1.30 [0.32-5.33] ns
Germany (L) inhabited for at least 1 year (1 year) cases: 26.4 Bq/m3
(Lower Saxony) concentrations from 10 to 584 Bq/m3 controls: 28.5 Bq/m3
median 27 Bq/m3, 25th, 75th et 90th Median: percentiles = 18, 43 and 70 Bq/m3 cases: 22.0 Bq/m3
controls: 21 Bq/m3
Steinbuch et al., 1999 173/254 1989-93 0-17 Age, race and Measurements at last residence Arithmetic / geometric mean (h) OR(37-100 Bq/m3/<37 Bq/m3) = 1.16 [0.7-1.8]
USA Canada (AML) geography if for at least 5 years cases: 49.8 Bq/m3 / 28.6 Bq/m3 OR(>100 Bq/m3/<37 Bq/m3) = 1.12 [0.6-2.0] Trend: p = 0.58 before diagnosis (1 year) controls: 56.0 Bq/m3 / 30.2 Bq/m3
Maged et al.., 2000 50 ALL 1996-98 2-14 Age and gender Measurements in homes Radon mean: (i) OR(40-60 Bq/m3/<40 Bq/m3) = 4.64 [1.2-18] Egypt (Cairo) 110 controls when living in Cairo since birth cases: 75 Bq/m3 OR(60-90 Bq/m3/<40 Bq/m3) = 7.42 [2-27.3]
(bedroom and living room for controls: 55 Bq/m3 OR(>90 Bq/m3/<40 Bq/m3) = 5.42 [1.3-21.1] 3 months) t = 13, p < 0.001
Table 2 - Continued
Reference Cases/Controls Period Age Matching Estimation of radon Radon concentration Results Trend
(a) criteria exposure (b) (c) (d)
UK Childhood 805 ALL 1992-96 < 15 Age and gender Measurements at last residence Arithmetic mean radon level: ALL (j):
Cancer Study 1306 controls if for at least 6 months 24 Bq/m3 OR(8.1-12.4 Bq/m3/<8.1 Bq/m3) = 0.86 [0.68-1.09]
ns Investigators 2002 (6 months) in bedroom and 2.5% of measurements > 100 Bq/m3 OR(12.4-18.1 Bq/m3/<8.1 Bq/m3) = 0.86 [0.68-1.09]
England, Scotland 146 other L main room Cases: 21.1 Bq/m3 (sd: 31.0 Bq/m3) OR(18.1-30.2 Bq/m3/<8.1 Bq/m3) = 0.69 [0.54-0.89]
and Wales 232 controls Controls: 25.5 Bq/m3 (sd: 42.4 Bq/m3) OR(>30.2 Bq/m3/<8.1 Bq/m3) = 0.77 [0.61-0.99]
Geometric mean radon level: Other L:
Cases: 14.7 Bq/m3 (sd: 2.3 Bq/m3) OR(8.1-12.4 Bq/m3/<8.1 Bq/m3) = 0.66 [0.39-1.11] ns Controls: 16.6 Bq/m3 (sd: 2.3 Bq/m3) OR(12.4-18.1 Bq/m3/<8.1 Bq/m3) = 0.62 [0.37-1.05] OR(18.1-30.2 Bq/m3/<8.1 Bq/m3) = 0.78 [0.48-1.29] OR(>30.2 Bq/m3/<8.1 Bq/m3) = 0.71 [0.43-1.19]
(a) L = all leukaemia, ALL = acute lymphoid leukaemia, AML = acute myeloid leukaemia (b) t = Student’s statistic, sd = standard deviation
(c) OR = odds ratio (high/low level)
(d) ns = non-significant (p>0.05), Trend = relative risk trend between radon groups (e) Non-matched analysis, adjusted on age and gender
(f) Match analysis adjusted on gender
(g) Logistic regression: OR adjusted on urbanization and socio-economic status
(h) Non-matched analysis, logistic regression: OR adjusted on age, race, mother’s educational level and family’s income (i) Non-matched analysis
Table 3: Distribution of ALL, AML and all acute leukaemia by age-group, gender and period in France between 1990 and 1998
ALL AML All acute leukaemia
N = 3270 N = 697 N = 4015 Age-group (years) 0 - 4 1677 (51.3%) 326 (46.8%) 2030 (50.5%) 5 - 9 1009 (30.9%) 175 (25.1%) 1195 (29.8%) 10 - 14 584 (17.8%) 196 (28.1%) 790 (19.7%) Gender Girls 1385 (42.4%) 336 (48.2%) 1744 (43.4%) Boys 1885 (57.6%) 361 (51.8%) 2271 (56.6%) Period 1990 - 1994 1836 (56.2%) 378 (54.2%) 2243 (55.9%) 1995 - 1998 1434 (43.8%) 319 (45.8%) 1772 (44.1%)
Table 4: Indoor radon concentration: statistical distribution of radon measurements carried out from 1982 to 2002 in 343 ZE geographic units out of 348 in France
Number Arithmetic Geometric 5th
Median
90th 95th of measurements Mean / Standard deviation Mean / Standard deviation a percentile percentile percentile
per ZE Mean 38.6 84.8 / 94.0 58.7 / 2.2 18.4 55.9 176.6 260.5 Minimum 3 14.8 / 7.7 12.5 / 1.3 2.0 12.0 23.0 26.0 Maximum 198 386.8 / 819.3 228.3 / 3.8 74.0 201.0 994.0 1880.0
All variables except the number of measurements are given in Bq/m3
Table 5: Ecological association between indoor radon concentration and the incidence of ALL (3 239), AML (697) and all acute leukaemia (3 984) in children aged 0 - 14 years (France, 343 ZE geographic units; 1990 - 1998)
ZE radon Average radon exposure
N c
ALL AML All acute leukaemia
exposure a (Bq/m3) b (Bq/m3) O/E d SIR O/E d SIR O/E d SIR
< 35 28.0 [26.5-29.5] 38 614/650.3 1.00 133/139.2 1.00 752 / 799.2 1.00 35.1 - 44.0 40.3 [38.5-42.1] 42 626/651.0 1.02 [0.91-1.14] 140/138.7 1.06 [0.83-1.34] 779 / 799.2 1.04 [0.94-1.14] 44.2 - 63.3 53.8 [52.0-55.6] 80 670/645.3 1.10 [0.99-1.23] 110/137.1 0.84 [0.65-1.08] 791 / 791.9 1.06 [0.96-1.17] 63.5 - 88.2 74.4 [71.6-77.3] 69 672/646.6 1.10 [0.99-1.23] 150/138.1 1.14 [0.90-1.43] 830 / 794.2 1.11 [1.01-1.23] > 89.6 145.8 [139.3-152.2] 114 657/653.6 1.06 [0.95-1.19] 164/139.5 1.23 [0.98-1.55] 832 / 802.7 1.10 [1.00-1.22] exp βˆe 1.03 [0.95-1.11] 1.24 [1.08-1.44] 1.07 [1.00-1.14] p f p = 0.49 p = 0.004 p = 0.053
France is divided into 348 “zones d'emploi” (ZE). The 343 ZE where radon exposure was determined were classified using 5 categories, each including approximately a quintile of the expected number of cases of all acute leukaemia
a Limits of radon exposure classes when using the arithmetic mean of radon measurements b Arithmetic mean of radon exposure and its 95% confidence interval
c Number of ZE
d Number of observed (O) and expected (E) cases of leukaemia – Reference: age- and gender-specific incidence ratios for the whole of France eβˆ : linear regression coefficient of the logarithm of the SIR of leukaemia over the arithmetic mean of the radon measurements
expβˆ : multiplying factor for the increase in the SIR when radon exposure increases by 100 Bq/m3 f p = p-value of the regression coefficient over the arithmetic mean of the radon measurements
Table 6: Ecological association between indoor radon concentration and childhood leukaemia incidence for each age-group, gender and period, and after adjusting on ecological covariates
(France, 343 ZE geographic units, 1990-1998)
exp βˆ a
ALL AML All acute leukaemia
n = 3 239 n = 697 n = 3 984 Age-group (years) 0 - 4 1.02 [0.91-1.13] 1.29 [1.05-1.59] 1.07 [0.97-1.18] 5 - 9 1.01 [0.88-1.16] 1.37 [1.04-1.80] 1.06 [0.94-1.20] 10 - 14 1.09 [0.91-1.29] 1.06 [0.78-1.42] 1.07 [0.92-1.24] Gender Girls 1.05 [0.93-1.17] 1.20 [0.97-1.49] 1.08 [0.98-1.19] Boys 1.01 [0.92-1.12] 1.28 [1.05-1.56] 1.06 [0.97-1.16] Period 1990 - 1994 1.04 [0.94-1.15] 1.11 [0.90-1.37] 1.06 [0.97-1.16] 1995 - 1998 1.01 [0.90-1.14] 1.40 [1.15-1.71] 1.08 [0.98-1.19] All b 1.03 [0.95-1.11] 1.24 [1.08-1.44] 1.07 [1.00-1.14]
Association between radon Rural areas 1.01 [0.93-1.10] 1.28 [1.09-1.51] 1.06 [0.99-1.14]
and leukaemia adjusted on:
Proportion of managers 1.01 [0.93-1.10] 1.27 [1.09-1.48] 1.06 [0.99-1.14]
Proportion of university graduates 1.02 [0.94-1.10] 1.26 [1.08-1.47] 1.04 [0.99-1.14]
Average net income 1.01 [0.93-1.09] 1.27 [1.09-1.48] 1.06 [0.98-1.14]
All 4 covariates 0.98 [0.90-1.08] 1.30 [1.10-1.54] 1.05 [0.97-1.13]
aβˆ : linear regression coefficient of the logarithm of the SIR of leukaemia over the arithmetic mean of radon measurements expβˆ : multiplying factor for the increase in the SIR when domestic radon exposure increases by 100 Bq/m3